Search for articles:
Manoj Kumar Pathak , K. K. S. Mer
Corresponding authors:
Received: 2018-08-1
Revised: 2018-10-23
Accepted: 2018-11-26
Online: 2018-11-26
Copyright: 2018 Editorial board of Acta Metallurgica Sinica(English Letters) Copyright reserved, Editorial board of Acta Metallurgica Sinica(English Letters)
More
Abstract
Tensile properties, microstructural evolution and fracture toughness of Al 2014 alloy subjected to cryorolling followed by warm rolling (CR + WR) have been investigated in the present study. The solution-treated (ST) Al 2014 alloy is cryorolled followed by warm rolling process at different temperatures (110, 170 and 210 °C). The mechanical properties and microstructural features of deformed and undeformed Al 2014 alloys were characterised by optical microscopy, transmission electron microscopy (TEM) and scanning electron microscopy (SEM). The CR + WR samples at 170 °C showed an improved hardness (179 HV), tensile (UTS 499 MPa, YS 457 MPa) and fracture toughness (KQ = 37.49 MPa $\sqrt {\text{m}}$, Kee = 37.39 MPa $\sqrt {\text{m}}$ and J integral = 33.25 kJ/mm2) with respect to ST alloy as measured from the tensile and fracture toughness test. The improved mechanical properties of CR + WR alloy are attributed to grain boundary strengthening, combined recovery and recrystallisation, precipitation hardening and dynamic ageing effect during the deformation. The precipitation of metastable spherical phase Al2Cu was responsible for the improved tensile and fracture properties of fine-grained Al 2014 alloy observed in the present work.
Keywords:
The age hardenable Al 2xxx alloys are widely used in automobile and structural applications due to their excellent combination of strength, ductility, and fatigue and fracture properties [1]. These alloys are strengthened by solid solution strengthening and age hardening treatment [2]. Al 2014 is one of the widely used alloys in Al 2xxx series. The major alloying elements in this alloy are Cu, Si and Mn. T6 tempered condition is a well-known condition for this alloy to improve the mechanical properties by precipitation of various second phase particles [3]. The mechanical properties of this alloy can further be improved by reducing the grain size less than 1 µm [4]. It is reported that the grain size of the metals/alloys plays a significant role in achieving the superior mechanical, fatigue and fracture properties of polycrystalline metals/alloys [5, 6, 7]. In the past few decades, some of severe plastic deformation (SPD) methods like multidirectional forging (MDF) [8], continuous repetitive corrugating and straightening (CRCS) [9], asymmetric rolling (AR) [10], cross-rolling [11], hot pressing [12] and equal channel angular pressing (ECAP) [13] have been developed to produce ultrafine grain (UFG) materials, in which the grain size lies between 100 nm and 1 µm. However, the major limitation of these methods is the need of severe plastic strain (greater than 1), expensive tooling, high cost and also the quantity of material produced is less [14].
To overcome these limitations, conventional rolling at liquid nitrogen temperature has emerged out as a promising method to produce ultrafine grain (UFG) microstructure in metals and alloys with significant improvement in mechanical properties of cryorolled (CR) materials. The basic reason for the exceptional mechanical properties of cryorolled (CR) material is attributed to fine-grained microstructure developed during cryorolling. It is reported that recovery kinetics of cryorolled material is entirely different than that of material processed by other deformation routes [15]. Recently, Dhal el al. [15] have investigated the microstructure evolution during cryo-SPD of various Al alloys (pure Al, Al 5083 and Al 2014) and compared the mechanism of formation of UFG microstructure in these pure Al, non-heat treatable Al 5083 and heat treatable Al 2014 alloys. Their study on heat treatable Al 2014 alloy revealed the generation of numerous artefacts/defects in the form of vacancies and dislocations at low plastic strain, producing dislocation tangled network due to accumulation of microdefects more rapidly at cryogenic temperature than those of other deformation methods. With further increase in plastic strain, dislocation tangled network relaxed, rearranged and transformed into the relatively ordered microstructure known as low angled dislocation cells. The dislocation cell boundaries are thick and made of dense dislocation walls (DDWs) having interior consisting of lesser dislocation density. The dislocation cell boundaries tend to become more regular and well-defined boundaries during subsequent stages and known as subgrain boundaries having higher misorientation than those of previous disordered state. It leads to the formation of ultrafine subgrain microstructure in metals/alloy in cryodeformed material. Mechanism of formation of ultrafine grains in precipitation hardenable Al alloy during cryo-SPD process is shown in Fig. 1 [15].
Fig. 1 Mechanism of formation of UFG microstructure in precipitation hardenable Al alloy during cryo-SPD process [
Cryorolled (CR) material shows a high strength due to storage of excessive dislocation content resulting from grain refinement, but often shows poor ductility, which limits the use of these materials in high-strength structural applications, where strength and ductility both are desired [16]. Various strategies have been proposed by different researchers for improvement in ductility of age hardenable severely deformed Al alloys. Wang and Ma [17] reported the effect of bimodal structure on the ductility of nanostructured Cu fabricated by cryorolling (CR). Cryorolling followed by annealing has been identified as a suitable method for improving ductility of the UFG metals and alloys as observed from their work. However, the improvement in the ductility was achieved at the expense of strength of the material. Recently, Joshi et al. [16] have investigated the effect of cryorolling process followed by annealing on the mechanical properties and precipitation behaviour of AA 2014 alloy and found that metastable spherical phase Al2Cu and needle phase AlCuMgSi are responsible for significant improvement in the mechanical properties of this alloy. These precipitates emerged out during the annealing treatment and obstructed the dislocation motion, thereby improving mechanical properties. Panigrahi et al. [18, 19, 20] studied the effects of deformation temperature, processing strain and post-deformation treatments (short annealing/ageing) on the microstructure evolution and mechanical properties of Al 6061, 6063 and 7075 alloys and found that short annealing and ageing treatment after deformation can be used for simultaneous improvement in strength and ductility of Al alloys. Recently, Rao et al. [21] identified the cryorolling followed by warm rolling (WR) as a promising method for simultaneous improvement in the strength as well as ductility of UFG metals and alloys. The simultaneous improvement in the strength and ductility of the cryorolled followed by warm rolled alloy is attributed to the formation of the subgrains due to dynamic recovery as reported in their work. In precipitation hardenable Al alloys, the effect of cryorolling followed by warm rolling was observed to be significant as reported in earlier work of various researchers due to evolution of precipitates [21, 22]. It has been well established that the shape, size, sequence and distribution of the precipitates play a vital role in enhancing the mechanical properties of metals and alloys. It may be mentioned from the past studies that cryorolling followed by warm rolling is a worthwhile technique for enhancing the strength and ductility simultaneously as compared to the existing methods in age hardenable aluminium alloy [23].
The mechanical behaviour and microstructure evolution in AA 2014 alloy deformed through multidirectional cryoforging (MDCF), cryorolled, followed by annealing (CR + AN) have been explored by earlier published work of Joshi et al. [3, 8]. However, the studies on the tensile, fracture properties and microstructure evolution of Al 2014 alloy subjected to combined effect of cryorolling followed by warm rolling are rare in the existing literature. Therefore, the current work has been envisaged to investigate the effect of cryorolling followed by warm rolling on the microstructure evolution, tensile properties and fracture toughness of AA 2014 alloy. Mechanical behaviour of cryorolling followed by warm rolled (CR + WR) AA 2014 alloy was studied by hardness, tensile and three-point bend test, while microstructural evolution of the deformed alloy is examined by optical microscopy, scanning electron microscopy (SEM) and transmission electron microscopy (TEM).
The chemical composition (in wt%) for material (Al 2014 alloy with T6 tempered) used in the current study is listed in Table 1. The material for present investigation is procured from Bharat Aerospace Materials, Navi Mumbai, India. The samples in prismatic shape with the dimension of 60 mm × 40 mm × 10 mm were cut from the as-received plate and solution treated (ST) at 540 °C for 2 h followed by quenching in water. Solution-treated samples were first subjected to cryorolling up to 70% thickness reduction at cryogenic temperature followed by warm rolling up to 90% thickness reduction at the temperature of 110, 170 and 210 °C by using oil bath furnace. The schematic representation of cryorolling followed by warm rolling process is shown in Fig. 2. The detailed procedure for cryorolling followed by warm rolling is discussed elsewhere [22]. To investigate the mechanical behaviour of cryorolled followed by warm rolled alloy, the tensile test and Vickers hardness test were executed at room temperature. For tensile testing, the samples were prepared as per the ASTM:E8 subsize specimen with gauge length of 25 mm and machined along the plane, which is parallel to the direction of rolling. Tensile tests were performed on a tensile testing machine (H25 K-S Tinius Oslen) operated at a constant crosshead speed and a strain rate of 5 × 10⁻⁴ s-1 to investigate the strength (UTS and YS) and ductility of processed and unprocessed Al 2014 alloy. Hardness of the samples was measured by using a Vickers hardness tester (FEI-VM 50 PC) with 5 kg load and dwell time of 15 s. The microstructures of solution-treated (ST) and warm rolled (WR) samples were studied through optical microscopy (Leica DMI 5000) and TEM. TEM analysis was performed on a transmission electron microscope (Philips CM 12) operating at 120 V, and the samples for TEM inspection were prepared by mechanical grinding of the sample thinning up to 100 µm thickness with the help of emery papers (using 320, 800, 1000 and 1200 grit size), and subsequently, twin jet electropolisher (3 mm disc) was used for thinning of samples with the solution having 75% methanol and 25% nitric acid at - 30 °C. Fractured surface morphology of ST and WR samples after tensile and the three-point bend test was examined by field-emission scanning electron microscope (FESEM).
Table 1 Chemical composition (wt%) of bulk Al 2014 alloy
| Cu | Si | Mg | Mn | Fe | Zn | Al |
|---|---|---|---|---|---|---|
| 4.8 | 1.0027 | 0.3454 | 0.7209 | 0.2158 | 0.1165 | Balance |
Fig. 2 Systematic diagram representing the process of cryorolling followed by warm rolling process
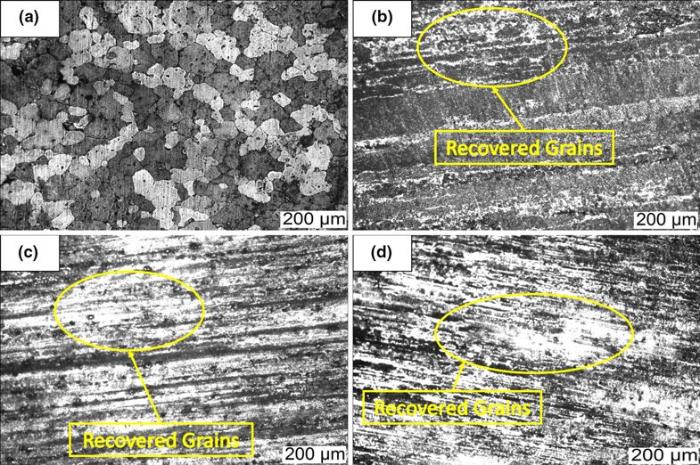
Optical micrographs of Al 2014 alloy in solution treated (ST) and cryogenic rolled and warm rolling (CR + WR) at 110 °C (WR 110), 170 °C (WR 170) and 210 °C (WR 210) are shown in Fig. 3a-d, respectively. Figure 3a illustrates the optical micrograph of solution-treated AA 2014 alloy. The equiaxed homogenous grains with an average grain size of 100-120 µm are observed from this figure. Figure 3b-d corresponds to the samples undergone cryorolling followed by warm rolling at temperature of 110, 170 and 210 °C, respectively. The severely fragmented and elongated substructure in rolling direction can be clearly visualised. Figure 3b depicts the microstructure of cryorolling followed by warm rolling at 110 °C. The heavily deformed microstructure is observed in this case as discussed above. In addition, distinction between the grain boundaries and grain interior is difficult due to severe fragmentation of the grains. However, it is very difficult to measure the grain size from this micrograph due to limitation of optical microscopy. With the increase in warm rolling temperature to 170 and 210 °C, the microstructure of Al 2014 alloy is gradually recovered due to the dynamic recovery as shown in Fig. 3c, d. It appears that with higher warm rolling temperature, recovery rate of cold deformed grains increases. It may be mentioned that with the increase in warm rolling temperature from 110 to 210 °C, dynamic recovery is prominent since dislocation content in the sample decreases gradually. However, for clear visualisation of microstructural refinement, the TEM studies were also performed and discussed in later part of the section. Similar findings were reported by Yogesha et al. [14] and Singh et al. [24] during the warm rolling of Al 5052 and Al 5083 alloy, respectively.
Fig. 3 Optical images of Al2014 alloy for a solution treatment, b cryorolling followed by warm rolling at 110 °C, c cryorolling followed by warm rolling at 170 °C, d cryorolling followed by warm rolling at 210 °C
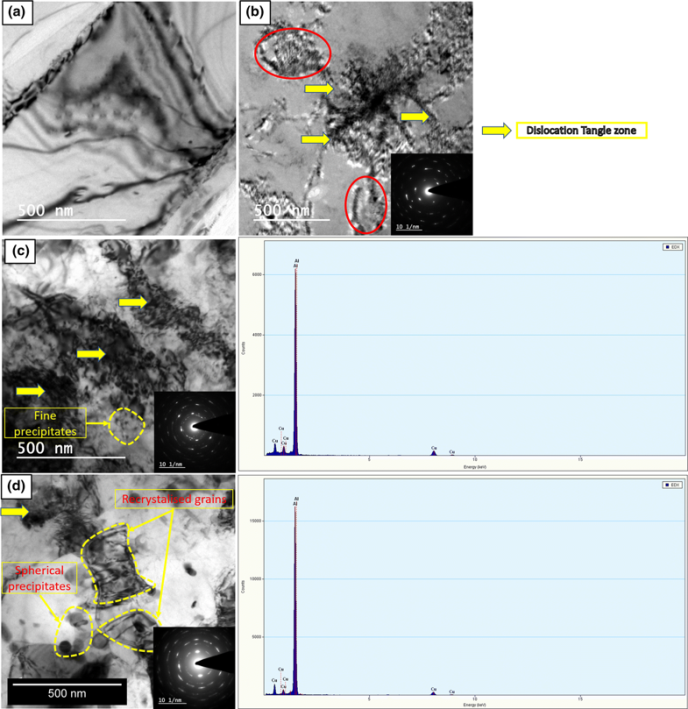
Figure 4a-d shows the TEM micrographs of solution-treated and CR + WR Al 2014 alloy processed at 110, 170 and 210 °C. Figure 4a shows the TEM micrograph of ST sample. The dislocation-free coarser grains are observed from this figure. Figure 4b shows the TEM micrograph of CR + WR sample at 110 °C. The numerous dislocation tangled zones (marked by yellow arrows) along with fine dislocation cells (marked with red circles) can be observed. In addition, deformation band/cell band structure is also observed, which is represented by the yellow dotted lines as noticed. Moreover, the microstructure in this sample condition represents the existence of heavily deformed structure associated with high density of dislocation inside the material. The selected area electron diffraction (SAED) pattern associated with TEM micrograph (Fig. 4b), as inset image, clearly reveals the ring pattern, which suggests the considerable misorientation due to the creation of ultrafine grains in Al 2014 alloy after processing through cryorolling followed by warm rolling at 110 °C.
Fig. 4 TEM micrographs with SAED pattern of Al 2014 alloy for a solution treatment, b cryorolling followed by warm rolling at 110 °C, c cryorolling followed by warm rolling at 170 °C along with TEM-EDX, d cryorolling followed by warm rolling at 210 °C along with TEM-EDX
Figure 4c represents the TEM micrograph corresponding to the condition when ST Al 2014 alloy is warm rolled at 170 °C. The dislocation density as well as dislocation tangling zones is slightly reduced as compared to previous condition as observed from this figure. It means that dynamic recovery is prominent at this temperature since dislocation density is slightly reduced. In addition, a fine spherical phase (covered under yellow dotted enclosure) can clearly be observed under this processing condition. The discussion regarding this spherical phase as Al2Cu has been reported in previous published work of Joshi et al. [16] during the cryorolling process followed by annealing of Al 2014 alloy and observed to be main hardening phase as observed from their work. The presence of Al2Cu phase is also confirmed by energy-dispersive X-ray spectrometer (EDX) pattern in the present work at this sample condition as shown in Fig. 4c. The selected area electron diffraction (SAED) pattern corresponding to this TEM micrograph (Fig. 4c) as inset clearly reveals the formation of discontinuous rings with centred broaden spot, which represent the heavily deformed microstructure with high-angle boundaries as reported in the literature. Figure 4d shows the TEM micrograph for the warm rolled sample at 210 °C. The dynamic recovery effect is further accelerated as compared to previous condition. The most of the dislocation cell boundaries are recovered, relaxed and transformed into fine subgrains. The dislocation content in the sample is drastically reduced due to higher warm rolling temperature. The fine spherical phase (covered under red rectangular box) which was detected in previous condition is also observed here; however, it is slightly coarsened due to rise in temperature. The similar findings were observed by Dhal et al. [25] and Joshi et al. [3] during cryorolling and post-deformation annealing of Al 2014 alloy. The SAED pattern corresponding to this TEM micrograph (Fig. 4d), as inset image, clearly reveals the formation of continuous rings as compared to previous conditions, which gives an indication that recovery and recrystallisation processes have just started but not completed in this sample condition.
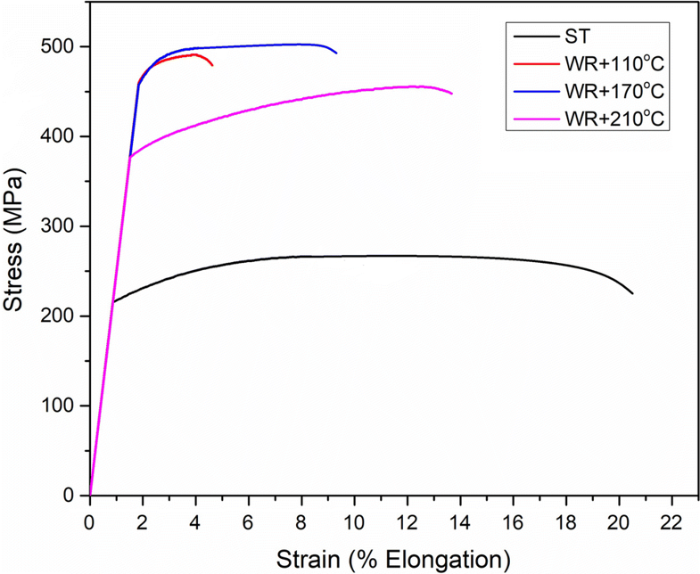
Figures 5, 6 and Table 2 show the variation in tensile strength and Vickers hardness for ST, WR 110, WR 170 and WR 210 Al 2014 alloy. The solution-treated sample shows the ultimate tensile strength (UTS) of 262 MPa, yield strength (YS) of 215 MPa, Vickers hardness of 118 HV and percentage elongation to failure as 21%. The UTS, YS and hardness in WR 110 sample have enhanced to 490 MPa, 459 MPa and 148 HV, respectively, whereas the reduction in ductility is observed as 4.5% as compared to the ST samples. The increases in UTS, YS and hardness of WR 110 sample as compared to ST sample are attributed to escalation in dislocation density due to creation of ultrafine microstructure as noticed from TEM micrograph in this processing condition. The percentage elongation of WR 110 sample is significantly reduced due to lesser strain hardening ability resulting from UFG microstructure as reported in the literature [26]. In WR 170 samples, the UTS, YS and hardness are increased to 499 MPa, 457 MPa and 179 HV, respectively, while a reduction in ductility is observed as 9.5% as compared to the ST material. The slight improvements in the UTS, YS and hardness of WR 170 sample are due to the dynamic ageing effect combined with dynamic recovery, which results in the precipitation of fine metastable spherical phase Al2Cu as seen from TEM micrograph (Fig. 4c) at this processed condition. The similar phase is identified by Dhal et al. [26] and Joshi et al. [16] during cryogenic rolling and annealing of Al 2014 alloy as the strengthen phase in this alloy as observed from their studies. It may be mentioned that WR 170 samples hold the better tensile and hardness properties as compared to the other samples due to the combined effect of the high dislocation density, dynamic ageing during warm rolling at 170 °C, solid solution strengthening and partial grain refinement. In addition, reasons accountable for effective pile up of dislocation in WR 170 sample is the development of fine spherical precipitates, which causes the improvement in strength due to hindering of dislocations during the deformation. Similar findings were reported by Kang et al. [27] and Singh et al. [24] for Al-Mg alloy during the process of cryorolling followed by warm rolling. The reason for improved percentage elongation (9.5%) as compared to WR 110 sample is attributed to the accelerated recovery phenomena at this sample condition leading to slight drop in dislocation density as seen from TEM micrograph (Fig. 4c).
Fig. 5 Variation in ultimate tensile strength (UTS), yield strength (YS) and percentage elongation before failure for Al 2014 alloy for different processed conditions
Fig. 6 Variation in strength (UTS and YS) and hardness of Al 2014 alloy for different processed conditions
Table 2 Mechanical properties of Al 2014 alloy at various material conditions
| Processing condition | Vickers hardness (HV) | Yield strength (MPa) | Ultimate tensile strength (MPa) | Percentage elongation |
|---|---|---|---|---|
| ST | 118 | 215 | 262 | 21 |
| WR + 110 °C | 148 | 459 | 490 | 4.5 |
| WR + 170 °C | 179 | 457 | 499 | 9.5 |
| WR + 210 °C | 137 | 376 | 452 | 14 |
On warm rolling at 210 °C, the UTS, YS and hardness are significantly reduced to 452 MPa, 376 MPa and 137 HV, respectively, while an improvement in ductility is observed to be 14% as compared to the previous sample condition (Figs. 5, 6 and Table 2). This can be attributed due to the combined recovery and recrystallisation effect at 210 °C as seen from TEM micrograph (Fig. 4d) at this sample condition, which causes more dislocation-free zones inside the grains which allows the accumulation of dislocations as reported elsewhere [4, 19]. In addition, the spherical phase (Al2Cu) evolved in this sample condition becomes slightly coarser, in comparison with the previous sample condition as shown in Fig. 4d. It is reported that coarser spherical phase becomes brittle at this condition since crack initiation results easily in significant drop in the strength of the warm roll sample at 210 °C as compared to the previous processed conditions (WR 110, WR 170) [16]. However, the improvement in the strength and hardness for all processed conditions is noted to be more in comparison with the ST sample due to the grain boundary strengthening resulting from evolution of UFG microstructure as noticed from TEM micrographs (Fig. 4a-d).
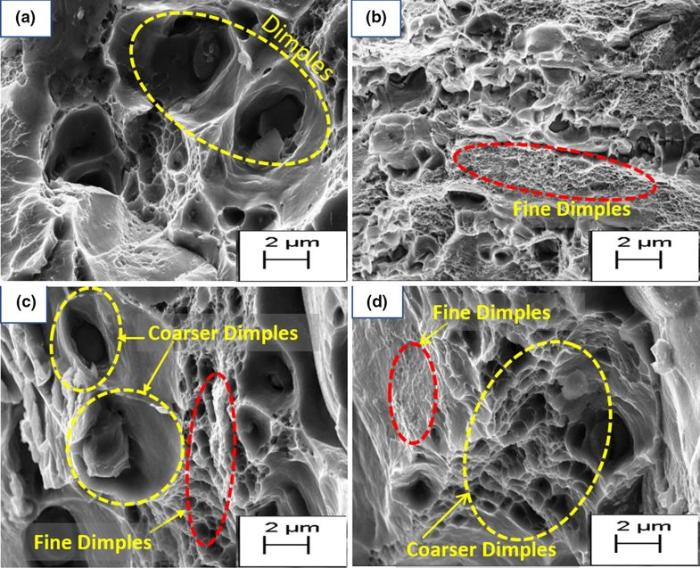
Analysis of the fracture surface after tensile testing has been carried out by SEM to understand the mechanism of failure for ST, WR 110, WR 170 and WR 210 Al 2014 alloy. Fractograph for various processing conditions after tensile testing is shown in Fig. 7a-d. Fractograph of ST sample (Fig. 7a) shows typical ductile failure with large number of dimples with an average size of 4 µm dispersed throughout the fracture surface. Dimpled rupture is characterised by equiaxed dimples formed on the fracture surface due to coalescence of microvoids. It is reported that these microvoids are initiated at the second phase particles and grow and eventually the tear between these voids. In the cryorolling process followed by warm rolling process at various temperatures, the fine dimples are observed as shown in Fig. 7b-d. The reduction in the size of the dimples for warm rolled samples also validates the microstructural refinement of the grains. It is reported that when the grain size is large as in ST alloy, nucleation sites are less, which further grows to a bigger size before coalescing causes dimpled fracture as observed in this work [28]. After microstructural refinement, the various nucleation sites are developed in the sample which further coalesces and prevents the microvoids from growing to a bigger size. This might be the possible reason for the reduction in larger size dimples with increasing grain refinement. Figure 7c shows the fractograph of warm rolled sample at 170 °C. Fracture surface in this sample condition consists of fine (marked by red circle) as well as few coarser dimples (marked by yellow circle) representing the ductile fracture mode in this sample condition. In addition, the number of fine dimples and the sizes also increase on the fracture surface, since ductility of warm rolled sample at 170 °C is observed to be more with respect to previous condition (warm rolled samples at 110 °C). Similarly, fracture surface of warm rolled sample at 210 °C shows the appearance of large number of coarser (marked by yellow circle) and few fine dimples (marked by red circle) as depicted in Fig. 7d substantiating the ductile fracture resulting in larger ductility of this processed condition as compared to previous conditions.
Fig. 7 Fractured surface morphology after tensile test of Al 2014 alloy for a solution treatment, b cryorolling followed by warm rolling at 110 °C, c cryorolling followed by warm rolling at 170 °C, d cryorolling followed by warm rolling at 210 °C
In addition to the ductility (measured by tensile testing), fracture toughness is also having vital role in many engineering applications [29]. Generally, tensile testing specimens are subjected to the uniaxial stress states, whereas a high amount of tensile triaxiality involves in fracture toughness testing. The broader and diversified view of deformation behaviour of materials under different states of stress can be obtained by performing the fracture toughness tests [30]. An excellent mechanical as well as the physical properties are shown by the ultrafine grain materials processed through SPD techniques, but deformation ability is deteriorated due to the reduction in percentage of elongation before failure, the reduction in strain hardening response and inability to accommodate additional space for dislocation movement as the size of grains lies in the range of ultrafine regime to nanometre regime. Recently, a lot of efforts have been made to improve the tensile ductility of metals/alloys processed through SPD techniques. However, the studies focused towards improving the fracture toughness of fine grain Al alloys are very limited. Additionally, the tensile triaxiality imposed near the crack tip during fracture toughness test is very high, which allows us to get general insight into deformation and fracture behaviour of metals/alloys [31]. It is very difficult to perform fracture toughness test in the ultrafine grain material processed through cryorolling, warm rolling and other SPD techniques due to the limited dimensions of the final material received after these processing techniques. It turns out to be more challenging when the small-scale yielding condition is also imposed around the crack tip. To deal with such kind of situation, the thickness of the processed Al 2014 alloy specimen must satisfy the condition of plane strain as prescribed in ASTM standards [16]. The studies on the evaluating fracture toughness parameters of Al 2014 alloy processed via cryorolling followed by warm rolling are very limited in previous published work. In this work, cryorolling followed by warm rolling of Al 2014 alloy at 170 °C shows the improved strength (UTS and YS) and hardness in comparison with the ST, WR 110 and WR 210 Al 2014 alloy samples. The major areas of application of Al 2014 alloy are aerospace and structural applications, and to use this material for these applications, it must exhibit the high fatigue and fracture toughness properties. Therefore, the three-point bent test was performed to find the fracture toughness parameters of processed UFG Al 2014 alloy using single edge notch bending (SENB) specimen. The ASTM E 399-05 standard was followed to prepare the specimen for three-point bent test [32]. A computer-controlled wire cut EDM (WEDM) machine was used to prepare the pre-cracked specimens to achieve the ratio of 0.5 for crack length (a = 3.75) to width (W = 7.5) as per the ASTM standard. Specimen thickness (B) for three-point bend test is taken to be 3.75 mm while the unbroken ligament (b = W-a) comes out to be 3.75 mm for all samples. Schematic view of the specimen with typical dimensions is reported elsewhere [16]. Various fracture parameters like plane strain fracture toughness (KIC), equivalent energy fracture toughness (Kee) and J integral were then evaluated from the fracture toughness test.
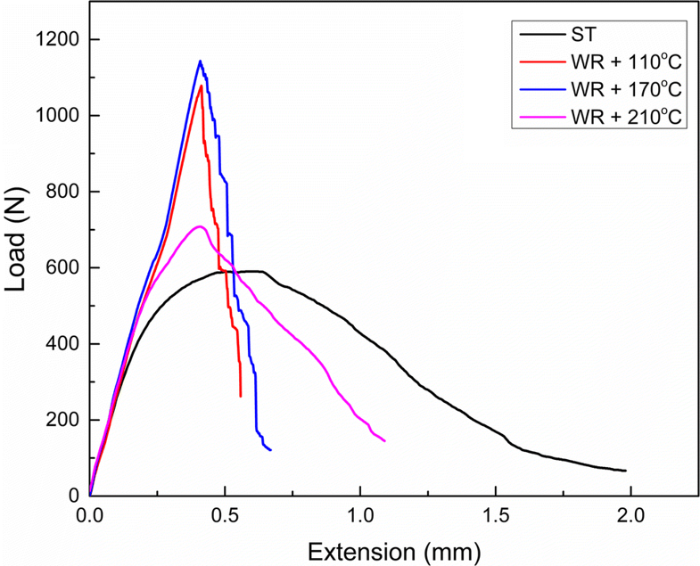
Linear elastic fracture mechanics (LEFM) approach is applied to determine the plane strain fracture toughness (KIC) of the material [33]. Figure 8 shows the load vs. extension curves for all the samples by subjecting them to a monotonically load until failure. From the analysis of load-extension curve, we are able to find the apparent fracture toughness (designated as KQ) . Crack length and apparent load PQ were measured and used in the following equation [32] to find out the value of apparent fracture toughness KQ:
$K_{{{\text{Q}} }} = \frac{{P_{{{\text{Q}} }} }}{B}\frac{S}{{W^{{3/_{2} }} }}\left[ {2.9 \left( {\frac{a}{W}} \right)^{{\frac{1}{2}}} - 4.6\left( {\frac{a}{W}} \right)^{{\frac{3}{2}}} + 21.8\left( {\frac{a}{W}} \right)^{{\frac{5}{2}}} - 37.6\left( {\frac{a}{W}} \right)^{{\frac{7}{2}}} + 38.7\left( {\frac{a}{W}} \right)^{{\frac{9}{2}}} } \right],$ (1)
where S is the length of the specimen taken as 30 mm for current investigation.
Fig. 8 Load versus Extension curve after three-point bend test for Al 2014 alloy at various processing conditions
The value of KQ obtained from Eq. (1) is termed as plain strain fracture toughness (KIC) of the material, if the following validity conditions are satisfied as reported in the literature [8, 17]:
$P_{ \hbox{max} } /P_{\text{Q}} \le 1.10,$ (2)
$a,b, B > 2.5\left( {{\raise0.7ex\hbox{${K_{\text{IC}} }$} \!\mathord{\left/ {\vphantom {{K_{\text{IC}} } {\sigma_{\text{y}} }}}\right.\kern-0pt} \!\lower0.7ex\hbox{${\sigma_{\text{y}} }$}}} \right)^{2},$ (3)
where a is crack length, b is unbroken ligament and B is the specimen thickness.
If the above validity conditions are not satisfied, KQ obtained from Eq. (1) is termed as apparent/provisional fracture toughness. The apparent fracture toughness of the material is reported in the current investigation because of unfulfillment of the above validity conditions caused due to the limited size obtained after cryorolling process followed by warm rolling process at various temperatures. The apparent fracture toughness for various processed conditions has been calculated as per the ASTM standard E 399 and discussed in the literature [32]. The apparent fracture toughness for ST Al 2014 alloy comes out to be 19.28 MPa $\sqrt m$. Similar procedure is adopted to determine the value of apparent fracture toughness for Al 2014 alloy processed via different processing conditions, and the same is reported in Table 3.
Table 3 Fracture toughness parameters of Al 2014 alloy at various material conditions
| Processing Condition | Apparent fracture toughness, KQ (MPa $\sqrt m$ | Equivalent energy fracture toughness, Kee (MPa $\sqrt m$ | Crack propagation energy/J integral (kJ/mm2) |
|---|---|---|---|
| ST | 19.28 | 24.54 | 20.49 |
| WR at 110 °C | 35.36 | 35.73 | 31.67 |
| WR at 170 °C | 37.49 | 37.39 | 33.25 |
| WR at 210 °C | 23.22 | 27.73 | 20.45 |
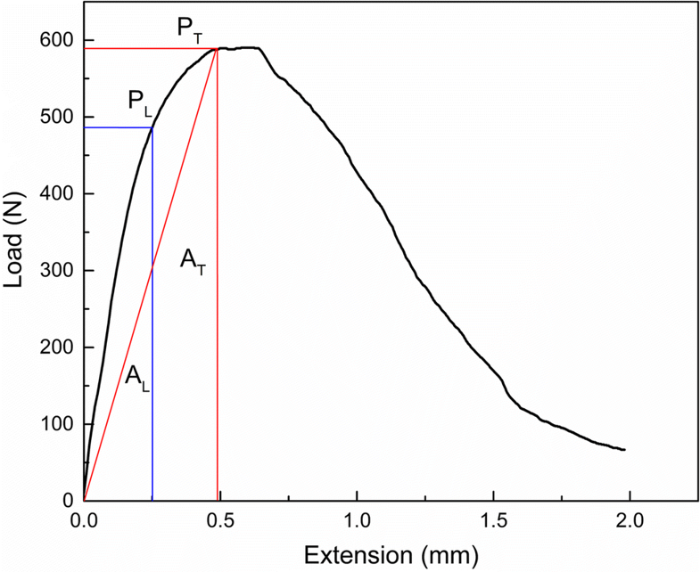
ASTM standard E 992 [34] is followed to determine the equivalent energy fracture toughness (Kee) as one of the fracture parameters used for comparison of fracture toughness of Al 2014 alloy samples obtained through different processing conditions. It has been reported in the literature that Kee obtained through equivalent energy method overestimates the value of KIC by 6%-22% while following ASTM standard E 399 [34]. The basic methodology is similar for this method as followed in ASTM standard E 399. However, there is a need to find the value of equivalent load (PE) as an alternative of apparent load (PQ) as per ASTM standard E 992. Therefore, with the help of load versus extension curve as shown in Fig. 9 (drawn for Al 2014 alloy at solution-treated condition as per the ASTM standard E 992), the area AL (area under the diagram up to which linear part of curve exists, designated as PL) has to be calculated first, and then, AT (area of the curve up to the point where the maximum load exists, designated at PT) needs to be calculated. In the present investigation, AT = 144.06 mm2, PT = 588 N, AL = 60.75 mm2, PL = 486 N. To find the value of equivalent load, the following equation is used as per the literature [35]:
$P_{\text{E}} = P_{\text{L}} \sqrt {{\raise0.7ex\hbox{${A_{\text{T}} }$} \!\mathord{\left/ {\vphantom {{A_{\text{T}} } {A_{\text{L}} }}}\right.\kern-0pt} \!\lower0.7ex\hbox{${A_{\text{L}} }$}}}.$(4)
Fig. 9 Procedure showing the measurement of equivalent energy fracture toughness (Kee) for ST Al 2014 alloy
After evaluating the equivalent load (PE = 748.40 N for Al 2014 alloy at ST condition as shown in Fig. 9), the following equation is used to determine the equivalent energy fracture toughness (Kee):
$K_{\text{ee}} = \frac{{P_{\text{E}} }}{B}\frac{S}{{W^{{3/_{2} }} }}\left[ {2.9 \left( {\frac{a}{W}} \right)^{{\frac{1}{2}}} - 4.6\left( {\frac{a}{W}} \right)^{{\frac{3}{2}}} + 21.8\left( {\frac{a}{W}} \right)^{{\frac{5}{2}}} - 37.6.\left( {\frac{a}{W}} \right)^{{\frac{7}{2}}} + 38.7\left( {\frac{a}{W}} \right)^{{\frac{9}{2}}} } \right],$ (5)
where all the variables used in Eq. (5) are similar to the variables used in Eq. (1) as per the ASTM standard E 399.
After substituting the value of equivalent load in Eq. (5), the equivalent energy fracture toughness comes out to be 24.54 MPa $\sqrt m$
for Al 2014 alloy at ST condition. Similar method is followed to find the equivalent energy fracture toughness of Al 2014 alloy processed via different processing conditions. The values of Kee for processed Al 2014 alloy in all processing conditions are reported in Table 3.
In the present investigation, J integral is performed in accordance with the ASTM standard 1820-15a and is evaluated using the following relation as reported in the literature [36]:
$J = \frac{2 A}{B b},$(6)
where A is the area (in load-extension curve up to the point where the maximum load exists), b is the unbroken ligament (3.75 mm) and B is the thickness of SENB specimen (3.75 mm). For solution-treated Al 2014 alloy, the value of A is determined as 144.06 mm2 (from load versus extension curve for ST Al 2014 alloy) and corresponding J integral is calculated as 20.49 kJ/mm2. The similar procedure is adopted for determining the value of J integral for Al 2014 alloy processed through different processing conditions, and values are reported in Table 3, and Table 3 represents the distinction of various parameters of fracture toughness (like KQ, Kee and J integral) for Al 2014 alloy processed through different processing conditions.
Fractured surface morphologies after three-point bend test for all processed conditions are shown in Fig. 10a-e. Figure 10a shows the pre-crack region in which the pre-cracking is made by the help of computerised wire cut EDM. Figure 10b depicts the fractograph for solution-treated Al 2014 alloy after three-point bend test. Very few dimples along with wider crack opening marked by yellow region can be seen. All the parameters of fracture toughness (such as apparent fracture toughness KQ, equivalent energy fracture toughness Kee and J integral) were detected to be less due to the wider crack opening, which facilitates the ease in crack initiation as well as crack propagation. Figure 10c shows the morphology of fractured surface for warm rolled samples processed at 110 °C. Fractured surface in this case comprises numerous fine dimples. It is reported that mechanism of initiation, growth and coalescence of the microvoids gives rise to characteristic fractographic features. In addition, fracture mode is also governed by the shape and size of the dimples and size in which they appear entirely depending on the type of stress system that were active during the deformation [28]. In the present work, slightly elongated dimples were observed for all processed conditions after three-point bend test. This might be due to high stress triaxiality involved in three-point bent test as reported in the literature [16]. WR sample at 110 °C has shown the improved fracture toughness in comparison with the solution-treated Al 2014 alloy because of ductile tearing fracture as seen from SEM micrograph corresponding to this condition. With the increase in warm rolling temperature up to 170 °C, the dimples size is slightly increased due to the recovered grain (Fig. 10d). Additionally, a large number of the dimples along with minor cracks were also observed which indicates that fracture mode is still ductile tearing in this condition. However, the volume fraction of ductile dimples is maximum in this case as compared to rest condition substantiating high values of fracture toughness among all processed conditions. Figure 10e shows the fractograph of WR sample at 210 °C after three-point bend test. Fractured surface in this condition consists of majority of minor crack and ductile dimples. In addition, the proportion of ductile dimples was also observed to be less as compared to previous condition resulting in reduced fracture toughness values. This might be due to the formation of coarser spherical phase Al2Cu which acts as a crack initiating source resulting in significant drop in fracture toughness values in this processed condition.
Fig. 10 Fractographs of Al 2014 alloy after three-point bend test for a pre-crack zone, b solution-treated condition, c cryorolling followed by warm rolling at 110 °C, d cryorolling followed by warm rolling at 170 °C, e cryorolling followed by warm rolling at 210 °C
The combined effect of cryorolling followed by warm rolling process at 110, 170 and 210 °C on Al 2014 alloy has been investigated in the present study to achieve the improved strength, fracture toughness and ductility of the material. The following conclusions are drawn based on the present study:
1.The remarkable improvements in strength and ductility (UTS 499 MPa, YTS 457 MPa and ductility 9.5%) are observed in the samples processed through combination of cryorolling followed by warm rolling at 170 °C compared to other samples processed through different processing conditions. An enhancement in the strength and elongation before failure can be attributed to combined effect of recovery, recrystallisation and precipitation of metastable spherical phase Al2Cu as observed from TEM studies.
2.A significant enhancement in hardness values 51.69% (179 HV) is observed for the samples processed through cryorolling followed by warm rolling at 170 °C due to the formation of UFG microstructure.
3.The significant improvement in the fracture toughness parameters such as apparent fracture toughness KQ (19.28-37.49 MPa $\sqrt {\text{m}}$) equivalent energy fracture toughness Kee (24.54-37.39 MPa $\sqrt {\text{m}}$) and J integral (20.48-33.25 kJ/mm2) as compared to solution-treated Al 2014 alloys observed is due to the formation of ultrafine grains, dislocation tangle zones and dislocation substructures, which increases the crack initiation as well as crack propagation period as noted from LEFM and EPFM analysis.
4.The failure mode of cryorolled followed by warm rolled (170 °C) samples after three-point bend test is transformed to mix mode ductile tearing as compared to the solution-treated alloy, where fracture is entirely governed by mixed mode brittle fracture as noticed from FESEM studies.
The authors have declared that no competing interests exist.

 WeChat
/
| 〈 |
|
〉 |


