Search for articles:
Yu-Peng Sun , Qi Li, Lu Yin
Corresponding authors:
Received: 2019-01-30
Revised: 2019-03-20
Online: 2019-12-10
Copyright: 2019 Editorial board of Acta Metallurgica Sinica(English Letters) Copyright reserved, Editorial board of Acta Metallurgica Sinica(English Letters)
More
Abstract
The Stern-Geary constant (B value) is indispensable to measure the corrosion rate in the microbiologically influenced corrosion (MIC) systems. Linear polarization resistance (LPR) and weight loss methods were used to study the variation of B values for X80 pipeline steel in the presence of Pseudomonas aeruginosa, Acetobacter aceti and Desulfovibrio vulgaris. The results showed that B values in the presence of three different bacteria were 35.60 ± 0.55 mV, 33.00 ± 1.00 mV and 58.60 ± 0.55 mV, respectively, suggesting that the change of corrosion system significantly affected the B values of X80 pipeline steel. This work further indicated that the determination of B values is necessary to accurately measure the MIC rate by LPR method.
Keywords:
Microbiologically influenced corrosion (MIC) has attracted more and more attention in recent years [1]. It has caused serious economic losses in many industries such as oil, natural gas and water treatment [2, 3]. MIC and other factors such as the stress corrosion cracking (SCC) ultimately lead to the failure of metal materials, shortening their service life. It was reported that MIC accounts for more than 20% of all corrosion damages [4, 5, 6]. Taking the USA as an example, its economic loss due to MIC amounts to billions dollars annually [7]. MIC caused the leakage of Alaska oil pipelines at Prudhoe Bay in 2006, which directly resulted in the price rising of global crude oil and serious environmental pollution [8].
Electrochemical techniques have been widely used to measure the MIC rate. Among these, linear polarization resistance (LPR) method is a simple, efficient and “nondestructive” electrochemical technique, which can be widely applied for the continuous monitoring to obtain corrosion rate [9]. Corrosion current density (icorr) can be deduced from the Stern-Geary equation [10] if proper Stern-Geary constant values can be provided.
$i_{\text{corr}} = \frac{B}{{R_{\text{p}} }} .$ (1)
where Rp represents the polarization resistance and B stands for the Stern-Geary constant that can be calculated according to anodic and cathodic Tafel constants $\beta_{\text{a}}$ and $\beta_{\text{c}}$:
$B = \frac{{\beta_{a} \times \beta_{\text{c}} }}{{2.303 \times (\beta_{\text{a}} + \beta_{\text{c}} )}}.$ (2)
In general, B value is assumed to be 26 mV or 52 mV in an active or passive corrosion system [11], respectively, and it has been directly used to calculate the corrosion current density in many published references (Appendix A in supplementary material) [12, 13, 14, 15, 16, 17, 18, 19, 20, 21, 22, 23, 24, 25, 26]. However, LPR method has some limitations, and it is only applicable to evaluate the uniform corrosion rather than the localized corrosion. A proper B value is the prerequisite to guarantee accuracy of the corrosion rate obtained by LPR method. In general, the slopes of the cathodic and anodic curves, which can be obtained from the potentiodynamic polarization curves, are used to calculate the B values and the corrosion rates. Because most of the researchers still regarded B value as a constant or a fixed value, and the influence of microbes on the variation of B values was invariably neglected. The presence of microorganisms can considerably change the B values, affecting the accuracy of the obtained corrosion rate [27, 28, 29].
There are main two types of MIC, extracellular electron transfer-MIC (EET-MIC) and metabolite-MIC (M-MIC) [30, 31, 32]. Therein, sulfate-reducing bacteria (SRB), a typical representative of EET-MIC, can obtain electrons from iron oxidation and reduce sulfate as the final electron acceptor. Acid-producing bacteria (APB) are capable of corroding metal materials by their production of organic acids [33], which is so-called M-MIC. It has been demonstrated that the EET-MIC is the major contributor of MIC due to SRB rather than hydrogen sulfide produced by SRB [34, 35]. Little is known on the B values for these different types of MIC. Therefore, in this work, we measured the B values in different MIC systems. Then LPR method was used to calculate the corrosion rate; therein, $\beta_{\text{a}}$ and $\beta_{\text{c}}$ were obtained by tracing the tangential line in the Tafel region, and the B value was calculated according to Eq. (2). In addition, the weight loss (WL) measurements and surface analysis techniques were employed to validate the accuracy and reliability of the results.
The chemical composition of X80 pipeline is listed in Table 1. All the samples used for electrochemical experiments and surface morphology analysis were cut into a dimension of 10 mm × 10 mm × 3 mm and then abraded with SiC papers of 150, 240, 400, 600, 800, 1000 and 1200 grit in sequence. Afterward, the coupons were rinsed with absolute ethanol.
Table 1 Chemical composition of X80 pipeline steel
| C | Si | Mn | Mo | Ni | Cu | Cr | V | P | S | Fe |
|---|---|---|---|---|---|---|---|---|---|---|
| 0.03 | 0.28 | 1.90 | 0.22 | 0.29 | 0.20 | 0.08 | 0.03 | 0.03 | 0.01 | Bal. |
Three corrosive bacteria including Pseudomonas aeruginosa, Acetobacter aceti and Desulfovibrio vulgaris were selected to investigate the variation of B values. For EET-MIC, P. aeruginosa and D. vulgaris were chosen because they are ubiquitous in various corrosive environments [34, 36, 37, 38, 39]. Acetobacter sp, a strain of acid-producing bacteria, can accelerate corrosion of steel by secreting organic acids, which belongs to M-MIC [40]. To culture P. aeruginosa and D. vulgaris, 2216E and ATCC 1249 media were used, respectively [34, 35]. The medium for A. aceti was composed of (g/L) 100.0 glucose, 10.0 yeast extract, 15.0 agar and 20.0 CaCO3.
The electrochemical workstation (Reference 600, Gamry Instruments, Inc., USA) was used for the electrochemical tests using a classical three-electrode system which consisted of a saturated calomel electrode (SCE) as reference electrode, a platinum electrode (10 mm × 10 mm × 1 mm) as counter electrode and X80 pipeline steel coupon (10 mm × 10 mm × 3 mm) as working electrodes. The working electrode coupons were welded with copper wire and then sealed with epoxy resin, leaving a working area of 1 cm2. Before experiment, the working electrode and platinum electrode were soaked in an absolute ethanol solution for 30 min and then exposed to ultraviolet light for 30 min. All the culture media used in this work were sterilized at 121 °C for 20 min. LPR was measured at a scan rate of 0.125 mV/s, and the potential range was from - 5 to 5 mV versus Eocp. The potentiodynamic polarization was also performed at a sweep speed of 0.5 mV/s with a scope from - 0.5 to 1.0 V compared to Eocp. The potentiodynamic polarization measurements were carried out after 1, 4, 7, 10 and 14 days, and the initial bacteria cell concentration was approximately 106 CFU/mL. Each experiment was repeated three times to ensure the reproducibility of the results. The anaerobic culture and electrochemical measurements of D. vulgaris were followed by Jia et al. [35].
The weight loss of the coupons was measured according to ASTM G1-03. In order to ensure the accuracy and persuasion of the experimental data, five parallel samples were prepared for each measurement. Coupons were first soaked in bacterial culture medium at 37 °C for 7 and 14 days and then taken out to remove the corrosion products from the coupon surfaces. The coupon weight was measured by an analytical balance with an accuracy of 0.0001 g (Shimadzu-AUW220D, Japan). By measuring the initial weight of the coupon (W0) and the weight of the coupon after immersion in the bacterial culture medium for 7 and 14 days (W1), the corrosion rate (VC) was calculated according to the following formula:
$V_{\text{C}} = \frac{{87600\,(W_{0 } - W_{1} )}}{t\rho A}.$ (3)
where VC (mm/year) represents the corrosion rate, t (h) is the soaking time, ρ (g/cm3) stands for the density of X80 pipeline steel and A (cm-2) is the exposed area of the coupons.
On the basis of the equation below, corrosion rate (VC) can be transformed into the corrosion resistance (Rp) according to the formula reported by Zhao et al. [41]:
$i_{\text{corr}} = V_{\text{C}} \times \frac{n}{M} \times 26.8 \times 10^{ - 4}.$ (4)
where icorr represents the corrosion current density, n stands for the number of moles of electron transferred per mole of corroded iron and M means the relative atomic mass of iron.
Scanning electron microscopy (SEM, Ultra-Plus, Zeiss, Germany) was used to observe the morphology and distribution of the biofilm on the coupon surfaces. The biofilm on sample surface was fixed with 3% glutaraldehyde (v/v) for 4 h; then, gradient dehydration was carried out with 50%, 60%, 70%, 80%, 90%, 95% and 100% absolute ethanol (v/v) for 10 min in sequence [38]. The coupons were finally sputtered with gold. To remove the biofilms and corrosion products, the coupons were pretreated in a Clark solution composed of 20 g Sb2O3, 50 g SnCl2 and 1000 ml HCl. The average pit depth and maximum pit depth were measured by confocal laser scanning microscopy (CLSM, 710, Zeiss, Germany). The average pit depth was measured at twelve different positions for each coupon.
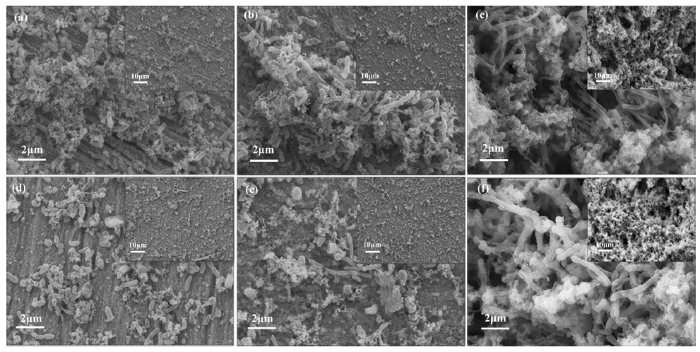
Figure 1 shows the SEM images of the biofilms on the surface of X80 pipeline steel after incubation for 7 (Fig. 1a-c) and 14 days (Fig. 1d-f). As shown in Fig. 1, the coupons surfaces were mostly covered by different biofilms. For P. aeruginosa and A. aceti, a large number of sessile bacteria was attached on the coupon surfaces after 7 days of incubation. However, after 14 days of incubation, the quantity of the sessile bacteria decreased gradually, which might be caused by the exhaustion of the carbon source. Nevertheless, the D. vulgaris biofilm was found to fully cover the coupon surfaces during the 14 days of incubation.
Fig. 1 SEM images of X80 pipeline steel coupon surface in the presence of three bacteria for 7 days: aP. aeruginosa, bA. aceti, cD. vulgaris and 14 days: dP. aeruginosa, eA. aceti, fD. vulgaris. The insets are taken at ×600 for biofilm
Figure 2 and Table 2 show the atomic concentrations of elements C, O, N and P on the sample surfaces before and after 14 days of incubation. As can be seen from Fig. 2b-d, the presence of bacteria obviously increased the contents of C and O compared to those on the bare coupon surface because of the metabolic activity of the biofilms on the coupon surface. The increase in P content also attributed to the formation of biofilms on the coupon surface because the cell membrane is generally composed of phospholipid bilayers [42]. The N content was relatively low and even cannot be detected in the presence of P. aeruginosa and D. vulgaris.
Fig. 2 EDS results of coupons in different culture media after 14 days: a bare X80 pipeline steel coupon surface, bP. aeruginosa biofilm, cA. aceti biofilm, dD. vulgaris biofilm
Table 2 Chemical composition (at.%) of biofilms on the coupon surfaces after 14 days determined by EDS: a bare X80 pipeline steel coupon surface, bP. aeruginosa biofilm, cA. aceti biofilm, dD. vulgaris biofilm
| C | N | O | P | S | Cr | Mn | Fe | |
|---|---|---|---|---|---|---|---|---|
| a | 14.43 | 2.00 | 0.64 | - | 0.02 | 0.12 | 1.73 | 81.16 |
| b | 39.29 | - | 37.67 | 3.72 | 0.12 | 0.02 | 0.32 | 18.86 |
| c | 43.71 | 2.08 | 36.33 | 2.94 | 0.24 | 0.09 | 0.38 | 14.23 |
| d | 73.00 | - | 21.56 | 0.22 | 2.77 | - | 0.01 | 2.44 |
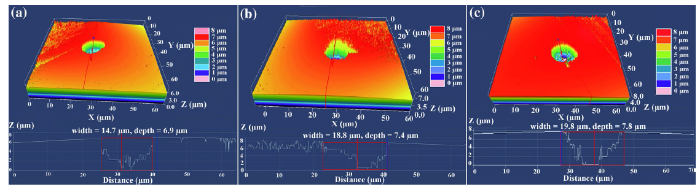
Figure 3 shows the images of the largest pit depths, and Table 3 gives the detailed data of the pit analysis. As displayed in Table 3, the largest pit depth was 6.9 μm in the presence of P. aeruginosa for 14 days of incubation and the corresponding average pit depth was 5.6 ± 1.1 μm. In comparison, the average and maximum pit depths of samples incubated were increased to 7.4 μm and 6.3 ± 1.3 μm for A. aceti, and 7.8 μm and 7.1 ± 0.9 μm for D. vulgaris, respectively. Obviously, D. vulgaris showed the stronger corrosion activity.
Fig. 3 Largest pit depth measured by CLSM on the coupon surface of X80 pipeline steel in the presence of three bacteria for 14 days: aP. aeruginosa, bA. aceti, cD. vulgaris
Table 3 Pit depths of X80 pipeline steel coupons incubated in the presence of different bacteria for 14 days
| Pit depth | P. aeruginosa broth | A. aceti broth | D. vulgaris broth |
|---|---|---|---|
| Largest pit depth (μm) | 6.9 | 7.4 | 7.8 |
| Average pit depth (μm) | 5.6 ± 1.1 | 6.3 ± 1.3 | 7.1 ± 0.9 |
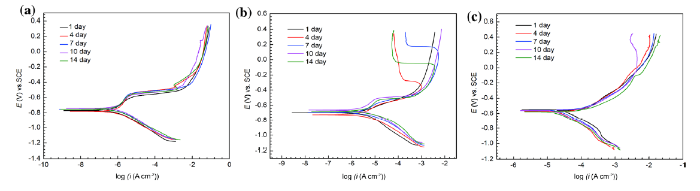
Figure 4 shows the potentiodynamic polarization plots of coupons after incubation with three types of bacteria for different incubation time. The values of βa and βc were extracted from the polarization curves, and the corresponding B values were obtained by Eq. (2). As shown in Table 4, the B values of X80 pipeline steel in the presence of different bacteria varied significantly, and the B values incubated with P. aeruginosa, A. aceti and D. vulgaris were 35.60 ± 0.55 mV, 33.00 ± 1.00 mV and 58.60 ± 0.55 mV, respectively.
Fig. 4 Potentiodynamic polarization curves of X80 pipeline steel coupons in the presence of different bacteria for 1, 4, 7, 10 and 14 days: aP. aeruginosa, bA. aceti, cD. vulgaris
Table 4 Corrosion parameters extracted from LPR and polarization curves of X80 pipeline steel in the presence of three bacteria for different times
| Bacteria | Time (day) | EOCP (V) versus SCE | RP (kΩ cm-2) | βa (V dec-1) | βc (V dec-1) | B (mV) | B′ (mV) | icorr (μA cm-2) |
|---|---|---|---|---|---|---|---|---|
| P. aeruginosa | 1 | - 0.68 ± 0.01 | 54.64 ± 4.50 | 0.21 ± 0.01 | - 0.13 ± 0.01 | 35.11 ± 1.12 | 35.60 ± 0.55 | 0.64 ± 0.02 |
| 4 | - 0.69 ± 0.04 | 54.35 ± 9.65 | 0.24 ± 0.04 | - 0.13 ± 0.03 | 36.18 ± 4.71 | 0.67 ± 0.09 | ||
| 7 | - 0.66 ± 0.02 | 61.20 ± 13.08 | 0.26 ± 0.05 | - 0.12 ± 0.01 | 35.45 ± 2.34 | 0.58 ± 0.04 | ||
| 10 | - 0.64 ± 0.03 | 66.44 ± 12.58 | 0.22 ± 0.02 | - 0.13 ± 0.02 | 34.71 ± 1.55 | 0.52 ± 0.02 | ||
| 14 | - 0.67 ± 0.01 | 69.66 ± 8.54 | 0.27 ± 0.01 | - 0.12 ± 0.01 | 36.33 ± 1.01 | 0.52 ± 0.01 | ||
| A. aceti | 1 | - 0.64 ± 0.01 | 4.06 ± 1.51 | 0.12 ± 0.01 | - 0.20 ± 0.02 | 32.39 ± 1.45 | 33.00± 1.00 | 7.98 ± 0.36 |
| 4 | - 0.66 ± 0.01 | 14.66 ± 1.47 | 0.19 ± 0.02 | - 0.12 ± 0.05 | 32.39 ± 1.55 | 2.21 ± 0.11 | ||
| 7 | - 0.65 ± 0.02 | 14.84 ± 2.21 | 0.23 ± 0.02 | - 0.12 ± 0.01 | 33.21 ± 1.23 | 2.24 ± 0.08 | ||
| 10 | - 0.62 ± 0.05 | 18.27 ± 2.87 | 0.23 ± 0.01 | - 0.12 ± 0.02 | 34.31 ± 0.23 | 1.88 ± 0.01 | ||
| 14 | - 0.63 ± 0.01 | 15.02 ± 1.60 | 0.26 ± 0.01 | - 0.11 ± 0.01 | 33.63 ± 1.81 | 2.24 ± 0.12 | ||
| D. vulgaris | 1 | - 0.60 ± 0.04 | 0.21 ± 0.08 | 0.27 ± 0.01 | - 0.27 ± 0.01 | 52.96 ± 1.36 | 58.60 ± 0.55 | 279.42 ± 6.23 |
| 4 | - 0.58 ± 0.02 | 0.16 ± 0.06 | 0.27 ± 0.01 | - 0.28 ± 0.01 | 59.22 ± 0.95 | 370.16 ± 5.88 | ||
| 7 | - 0.56 ± 0.01 | 0.14 ± 0.01 | 0.26 ± 0.02 | - 0.27 ± 0.02 | 58.18 ± 1.87 | 420.13 ± 13.33 | ||
| 10 | - 0.58 ± 0.01 | 0.18 ± 0.02 | 0.27 ± 0.01 | - 0.27 ± 0.02 | 58.27 ± 0.21 | 323.71 ± 1.31 | ||
| 14 | - 0.55 ± 0.01 | 0.16 ± 0.07 | 0.27 ± 0.02 | - 0.27 ± 0.01 | 58.68 ± 0.64 | 366.74 ± 3.78 |
Table 5 shows the weight loss, VC and icorr of X80 coupons after incubation with P. aeruginosa, A. aceti and D.vulgaris for 7 and 14 days according to Eqs. (3) and (4). The average VC values of X80 coupons in the presence of three different bacteria underwent a gradual decrease with prolonged incubation time from 7 to 14 days, owing to the gradual reduction in nutrients and the bioactivity of the biofilms. A. aceti was more corrosive compared to P. aeruginosa. Moreover, the VC in the presence of D. vulgaris was at least four times higher than those in presence of P. aeruginosa and A. aceti. The above results indicated that the data of weight loss were in good agreement with LPR results, confirming the corrosivity rank of the studied three different bacteria.
Table 5 Weight loss of X80 pipeline steel incubating with three bacteria for 7 days and 14 days, respectively
| Bacteria | Time (day) | Weight loss (mg cm-2) | VC (μm year-1) | icorr (μA cm-2) |
|---|---|---|---|---|
| P. aeruginosa | 7 | 0.28 ± 0.02 | 18.60 ± 1.33 | 1.78 ± 0.10 |
| 14 | 0.45 ± 0.02 | 14.95 ± 0.07 | 1.43 ± 0.07 | |
| A. aceti | 7 | 0.47 ± 0.04 | 31.22 ± 2.78 | 2.99 ± 0.22 |
| 14 | 0.74 ± 0.03 | 24.58 ± 1.21 | 2.35 ± 0.10 | |
| D. vulgaris | 7 | 1.63 ± 0.16 | 108.28 ± 13.18 | 10.37 ± 0.75 |
| 14 | 2.88 ± 0.10 | 95.68 ± 4.23 | 9.16 ± 0.33 |
In general, the potentiodynamic polarization curves are applied to obtain the Tafel slopes of anode and cathode, the so-called $\beta_{\text{a}}$ and $\beta_{\text{c}}$, and their commonly used values were 0.12 mV which is equivalent to the B value of 26 mV. However, as shown in Table 4, we can see that the values of $\beta_{\text{a}}$ and $\beta_{\text{c}}$ changed significantly in the presence of different types of bacteria. The B values can be calculated by $\beta_{\text{a}}$ and $\beta_{\text{c}}$ according to Eq. (2). Thus, it is obviously wrong to use a fixed B value to calculate the MIC rate. In this work, the B values of X80 pipeline steel incubated with P. aeruginosa, A. aceti and D. vulgaris were 35.60 ± 0.50 mV, 33.00 ± 1.00 mV and 58.60 ± 0.55 mV, respectively.
The weight loss method (WL), an intuitive method to calculate the corrosion rate, was employed in this work to validate the accuracy of corrosion rate obtained by LPR. For P. aeruginosa and A. aceti, both WL and LPR methods obtained a similar corrosion rate when proper B values were collected from the potentiodynamic polarization curves. It is well known that SRB causes severe pitting corrosion attack; thus, WL and LPR methods were not suitable for accurately measuring the localized pitting corrosion rate. The reason for numerical icorr difference of SRB obtained by WL and LPR should be further investigated. The icorr calculated by LPR and WL methods showed the same trend with prolonging the immersion time in the above three bacterial media from 7 days to 14 days.
In addition, the variation of B values was also listed as Appendix B in supplementary material [43, 44, 45, 46, 47, 48, 49, 50, 51, 52, 53, 54]. As shown as Appendix B in supplementary material, the obtained B values changed significantly for different alloys in the presence of different corrosive bacteria. Therefore, it can be preliminarily inferred that the change of corrosion system will affect the B values. The B values for the abiotic control in this work were kept in the similiar range.
In this study, the B values of X80 pipeline steel incubated with P. aeruginosa, A. aceti and D. vulgaris changed greatly. Therefore, it can be concluded that the B value of the same material inoculated with different bacteria should not be a fixed value. Besides; the MIC caused by P. aeruginosa [52, 55, 56, 57, 58] and D. vulgaris [53, 59, 60, 61] have been extensively reported in literature. Similarly, the B values of different materials in the presence of P. aeruginosa and D. vulgaris significantly changed. Therefore, the B values of different materials incubated with the same corrosive bacteria were also variable, influencing by the materials and the corrosion environments. The present results further proved the claims above.
In this work, the variation of B values of X80 pipeline steel in the presence of three different corrosive bacteria was investigated. The obtained B values demonstrated that the Stern-Geary constant was not a fixed constant for MIC, which varied with different bacteria in different systems. Thus, the conventional assumption of B value being 26 mV or 52 mV in the abiotic system is not available to calculate the corrosion rate in biotic system. The Stern-Geary constant is the key factor to obtain proper MIC rate using LPR method.
This work was financially supported by the National Natural Science Foundation of China (Nos. U1660118 and 51871050), the National Environmental Corrosion Platform (NECP) of China and Shenzhen Science and Technology Research Funding (JCYJ20160608153641020).
The authors have declared that no competing interests exist.

 WeChat
/
| 〈 |
|
〉 |
