Search for articles:
Ke Zhang , Ping Liu
Corresponding authors:
Received: 2017-08-19
Revised: 2017-10-23
Online: 2018-06-10
Copyright: 2018 Editorial board of Acta Metallurgica Sinica(English Letters) Copyright reserved, Editorial board of Acta Metallurgica Sinica(English Letters)
More
Abstract
The orientation relationships (ORs) between the martensite and the retained austenite in low- and medium-carbon steels after quenching-partitioning-tempering process were studied in this work. The ORs in the studied steels are identified by selected-area electron diffraction (SAED) as either K-S or N-W ORs. Meanwhile, the ORs were also studied based on numerical fitting of electron backscatter diffraction data method suggested by Miyamoto. The simulated K-S and N-W ORs in the low-index directions generally do not well coincide with the experimental pole figure, which may be attributed to both the orientation spread from the ideal variant orientations and high symmetry of the low-index directions. However, the simulated results coincide well with experimental pole figures in the high-index directions {123}bcc. A modified method with simplicity based on Miyamoto’s work was proposed. The results indicate that the ORs determined by modified method are similar to those determined by Miyamoto’ method, that is, the OR is near K-S OR for the low-carbon Q-P-T steel, and with the increase of carbon content, the OR is closer to N-W OR in medium-carbon Q-P-T steel.
Keywords:
Recently, a novel heat treatment process termed as quenching-partitioning-tempering (Q-P-T) was proposed by Hsu [1], which was used to obtain the stable dual-phase structure consisted of martensite plus significant retained austenite in low-carbon alloyed steels. As the microstructure of Q-P-T treated steel is dual-phase type with martensite laths and film-like retained austenite located between martensite laths [2], the good strength-plasticity combination can be obtained by adjusting the martensite fraction [3, 4]. At present, the studies of Q-P-T steels mainly focus on the mechanical properties [5], the microstructure characterization [6], and the mechanism of retained austenite enhanced the ductility [7]. However, according to our knowledge, until now, there has been no systematic study on the crystallographic analysis of the lath martensite in Q-P-T steels.
Numerous studies have been conducted on the martensitic transformation and lath martensite in steels [8, 9, 10]. The crystallographic orientation relationships of lath martensite are maintained when austenite transforms into martensite [11, 12]. The present researches showed that the martensite laths within a parent austenite grain (PAG) group themselves develop several blocks and some blocks can further develop into packets with the same habit plane of the lath martensite [13, 14, 15, 16]. There are three major orientation relationships (ORs) between the lath martensite and the parent austenite in steels: i.e., Kurdjumov-Sachs (K-S) OR (\(\{ 111\}_{\gamma } //\{ 110\}_{\alpha }\), \(\left\langle {110} \right\rangle_{\gamma } //\left\langle {111} \right\rangle_{\alpha }\)), Greninger-Troiano (G-T) OR (\(\{ 111\}_{\gamma } \sim 1^{ \circ } //\{ 110\}_{\alpha }\), \(\left\langle {12,17,5} \right\rangle_{\gamma } //\left\langle {17,17,7} \right\rangle_{\alpha }\)), and Nishiyama-Wasserman (N-W) OR (\(\{ 111\}_{\gamma } //\{ 110\}_{\alpha }\), \(\left\langle {011} \right\rangle_{\gamma } //\left\langle {001} \right\rangle_{\alpha }\) or \(\left\langle {112} \right\rangle_{\gamma } //\left\langle {110} \right\rangle_{\alpha }\)) [17].
During last decade, more accurate techniques for the orientation relationship (OR) measurement, such as the convergent beam Kikuchi line diffraction patterns (CBKLP) in transmission electron microscopy (TEM) [18], and the electron backscatter diffraction (EBSD) in scanning electron microscopy (SEM), have been developed and used to study the crystallography of martensite [19]. However, the observed area in TEM is limited, and thus, it is difficult to get convincing statistical information. Comparing with TEM, the crucial advantage of EBSD is the higher statistical significance of the measurement points. Moreover, orientation determined by Kikuchi pattern in EBSD can be obtained with an accuracy within 0.01°, which is much higher than that of TEM [10]. The steels studied were almost treated by quenching directly to water or quenching and tempering. Therefore, a sufficient quantity of austenite for investigating the OR cannot be retained in practical low-carbon and low-alloyed steels. Nolze presented a convenient method to distinguish OR in EBSD analysis using a stereographic projection of high-indexed directions which does not require the presence of retained austenite [20]. However, the OR could not be determined quantitatively using this method. Miyamoto et al. [21] developed a new method to accurately determine the OR based on numerical fitting of the EBSD data, which can meet the requirements of both high resolution and the significant amount of retained austenite in steel.
In the present work, the morphology and crystallography of lath martensite in low- and medium-carbon Q-P-T martensitic steels will be determined by TEM and EBSD. The different methods mentioned above are applied for the purpose of distinguishing the ORs of martensitic transformation. Due to the large amount of retained austenite in Q-P-T martensitic steels, a new method is developed to distinguish the OR between the lath martensite and the retained austenite. In turn, the result of the new method is used to test and verify the method Miyamoto used.
Two steels were melted in a laboratory medium frequency furnace and hot-rolled to 12 mm in thickness. The chemical compositions of the experimental steels are listed in Table 1. These steels are denoted as low-carbon and medium-carbon steels hereafter. The austenite finishing temperature (Ac3) during the heating cycle, together with the martensite start temperature (Ms) and martensite finish temperature (Mf), of the cylindrical samples with a diameter of 3 mm and a length of 10 mm was determined using a Formaster FII dilatometer. The samples with thickness of 2 mm were cut from a hot-rolled plate for the Q-P-T process. The samples were austenitized at 960 °C for low-carbon steel, and 850 °C for medium-carbon steel for 300 s, followed by quenching into salt bath of 300 °C for low-carbon steel, 200 °C for medium-carbon steel for 15 s and subsequent both partitioning and tempering at 450 °C for 30 s in molten salt, and then finally quenching to room temperature.
Table 1 Chemical compositions of experimental Q-P-T steels (wt%)
| Sample | C | Mn | Si | Nb | Ac3 (°C) | Ms (°C) | Mf (°C) |
|---|---|---|---|---|---|---|---|
| Low-carbon steel | 0.19 | 1.52 | 1.57 | 0.029 | 911 ± 5 | 395 ± 5 | 171 ± 3 |
| Medium-carbon steel | 0.42 | 1.46 | 1.58 | 0.028 | 797 ± 5 | 289 ± 5 | 84 ± 3 |
The samples for EBSD were prepared by mechanically polishing and then electropolishing in 7% perchloric acid and 93% ethanol. The orientation maps were obtained with a beam step of 0.05 μm by SEM (Zeiss Super55, 20 kV) equipped with a FE-type gun and EBSD HKL system with Channel 5 software. The microstructure of the steels was further characterized by TEM (JEM-2100F, 200 kV) after electropolishing with a twin-jet polisher in 4% perchloric acid and 96% ethanol solution at - 20 °C.
Miyamoto et al. [21] proposed a new method to accurately determine the ORs of martensite and bainite with the parent austenite based on numerical fitting of EBSD data without the presence of retained austenite in samples. First, N data points for the martensite orientation are selected manually, where the \(i\)th datum point is referred to as \(M_{i}^{\text{bcc}}\), in a region transformed from a single austenite grain containing no annealing twinning. By assuming the austenite orientation matrix (\(M^{\text{fcc}}\)) and the OR matrix between martensite and austenite (\(V^{f \to b}\)), the deviation matrix (\(D_{i}\)) between the experimental and calculated data is estimated for each \(M_{i}^{\text{bcc}}\) as:
$ (D_{i} = V^{f \to b} \left( {C_{n} M^{\text{fcc}} } \right)\left( {C_{m} M_{i}^{\text{bcc}} } \right)^{ - 1} ,$ (1)
where \(C_{n}\) and \(C_{m}\) are the conversion operation matrices of the basic axes and become unit matrices when n or m is 1. Then, the misorientation angle (\(\Delta \theta_{i}\)) of \(D_{i}\) is estimated as:
$ (\Delta \theta_{i} = \arccos \{ (D_{i} [1,1] + D_{i} [2,2] + D_{i} [3,3] - 1)/2\} ,$ (2)
where \(D_{i} [1,1]\), \(D_{i} [2,2]\), and \(D_{i} [3,3]\) are diagonal components of \(D_{i}\). \(C_{n}\) and \(C_{m}\) are chosen to minimize \(\Delta \theta_{i}\) for each \(i\)th measurement point. The average misorientation (\(\Delta \theta_{\text{average}}\)) for assuming the austenite orientation and the OR in question is given by:
$ (\Delta \theta_{\text{average}} = \sum\limits_{N} {\Delta \theta_{i} /N} .$ (3)
Finally, \(M^{\text{fcc}}\) and \(V^{f \to b}\) are determined as \(\Delta \theta_{\text{average}}\) becomes minimal by numerical fitting for all the measured N data points. Miyamoto et al. [21] indicated that the calculated errors of \(M^{\text{fcc}}\)and \(V^{f \to b}\) are less than 1° for the OR obtained by fitting in the present method which agree with the mean OR of martensite laths formed from a single austenite grain.
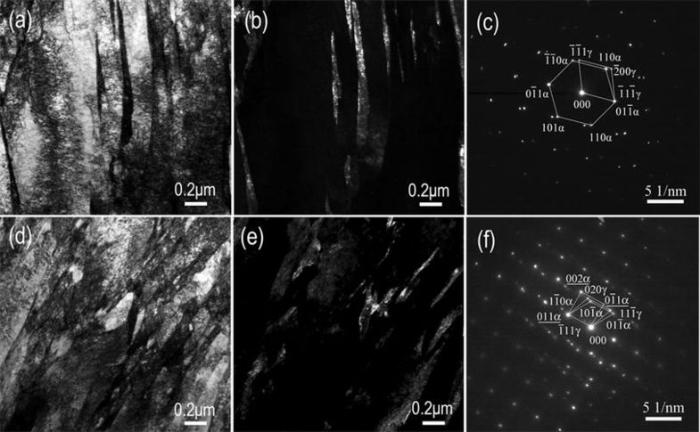
The TEM images of the low- and medium-carbon steel samples treated by Q-P-T process are illustrated in Fig. 1. It is clearly shown that the samples subjected to Q-P-T treatment have the identical microstructure: dislocation martensite laths and flake-like (or thinner film-like) retained austenite located in between martensite laths. Carbon transports from supersaturated martensite into austenite on partitioning step in the Q-P-T process, and thereby more austenite is retained down to room temperature. The dark field images show that the thickness of retained austenite is ~ 50 nm in the low-carbon sample (Fig. 1b) and ~ 120 nm in the medium-carbon sample (Fig. 1e). The morphologies of retained austenite exhibit different appearances from film-like [22], flake-like [23] to block [24] accompanying with the carbon contents increase from low, medium to high. Meanwhile, the thickness and amount of retained austenite both increase with the increase of carbon content. The orientation relationships between martensite and the retained austenite are identified by selected-area electron diffraction (SAED) as: \(\left[ {\bar{1}11} \right]_{\alpha } //\left[ {011} \right]_{\gamma }\), \(\left( {01\bar{1}} \right)_{\alpha } //\left( {\bar{1}1\bar{1}} \right)_{\gamma }\) (K-S relationship) shown in Fig. 1c, and \(\left[ {\bar{1}\bar{1}\bar{1}} \right]_{\alpha } //\left[ {0\bar{1}\bar{1}} \right]_{\gamma }\), \(\left( {1\bar{1}0} \right)_{\alpha } //\left( {11\bar{1}} \right)_{\gamma }\) (K-S relationship), and \(\left[ {00\bar{1}} \right]_{\alpha } //\left[ {0\bar{1}\bar{1}} \right]_{\gamma }\), \(\left( {\bar{1}10} \right)_{\alpha } //\left( {11\bar{1}} \right)_{\gamma }\) (N-W relationship) shown in Fig. 1f.
Fig. 1 TEM images show the martensite and retained austenite in the Q-P-T samples: a bright field image of the retained austenite in low-carbon steel; b dark field image of the retained austenite in low-carbon steel; c SAED pattern from low-carbon steel; d bright field image of the medium-carbon steel; e dark field image of the retained austenite of the medium-carbon steel; f SAED pattern from the medium-carbon steel
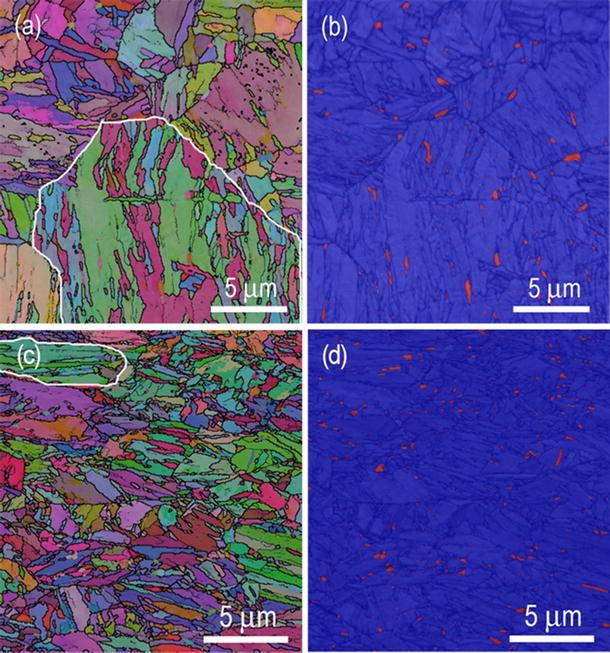
The crystallographic features presented in these steels were further studied by EBSD. Figure 2 shows the orientation imaging maps (OIMs) of low- (a, b) and medium-carbon (c, d) steels after Q-P-T process. The detailed morphology and crystallographic features for martensite and retained austenite are simultaneously shown in Fig. 2a, c, while only retained austenite is shown in Fig. 2b, d in red. The PAGs are marked by white line in Fig. 2a, c, respectively. Grain boundaries are clearly visible by dark line in Fig. 2b or d. High-angle boundaries (larger than 15°) and small-angle boundaries (2°-15°) are shown as bold black lines and fine gray lines in OIMs, respectively. It is obvious that the PAGs are divided into several packets which are further subdivided into blocks with the rough parallel direction with a small misorientation. Meanwhile, the block width and packet size decrease with the increase of carbon content in steels. For self-accommodation, the combination of martensite laths would take place more extensively during martensitic transformation [8]. The retained austenite mainly distributed between martensite laths with flake-like or film-like shape along the lath boundaries. Both Fig. 2a, c indicate that the crystallographic orientation of the retained austenite was identical in a single prior austenite grain. The volume fractions of retained austenite are 3.5% for low-carbon sample and 4.6% for medium-carbon sample determined by EBSD, respectively. However, we also noticed that the amount of retained austenite seemed to be less than the calculated by X-ray diffractometry spectra, i.e., 6.5% for low-carbon sample and 16% for medium-carbon sample [7]. This might be attributed to the following reasons: (1) flake-like (or thinner film-like) retained austenite between martensite laths cannot be resolved because the resolution of EBSD is limited to 0.1 μm, which is larger than the nanosized-width of flake-like retained austenite [24] and (2) the retained austenite would partially transform to martensite after mechanical polishing [25, 26].
Fig. 2 Orientation imaging maps of low-carbon a, b and medium-carbon c, d steels after Q-P-T process. Martensite and retained austenite are simultaneously shown in a, c, while only retained austenite is shown in b, d as red. The white line indicates the prior austenite grain boundaries
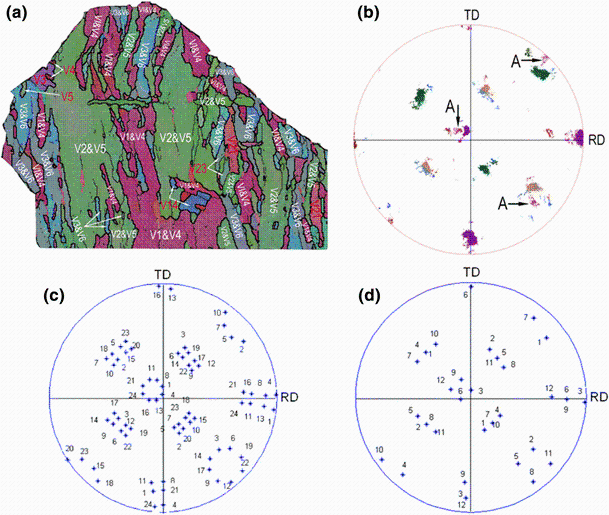
Figure 3a shows an OIM of lath martensite and retained austenite structure in a limited area enclosed by the white line in Fig. 2a. The martensite variants are accurately analyzed in each block to identify the prior austenite grain boundaries. It is clear that all 24 variants do not necessarily appear within one austenite grain [11]. Numerous blocks are composed of a specific combination of two variants with a small misorientation, i.e., V1-V4, V2-V5, and V3-V6, but some blocks with only one variant which has been marked as red (V5, V14, V16, V21, and V23). Figure 3b shows experimental {001}bcc pole figure of the lath martensite and retained austenite corresponding to Fig. 3a. Even though this PAG is probably not complete on the mapping, the pole figure inside the PAG could also be studied in detailed for determination of the OR between the martensite and austenite. It can be seen that experimental points present a large scatter, which could be attributed to the intra-block misorientation [27]. Figure 3c, d shows the K-S and N-W ORs simulated from {001}bcc pole figure, respectively. Comparing Fig. 3b with Fig. 3c, d, the simulated K-S and N-W ORs do not well coincide with the experimental pole figure. The reason may be the orientation spread from the ideal variant orientations and high symmetrical low-index directions.
Fig. 3 a OIM of low-carbon steel corresponds to the area surrounded by the white line in
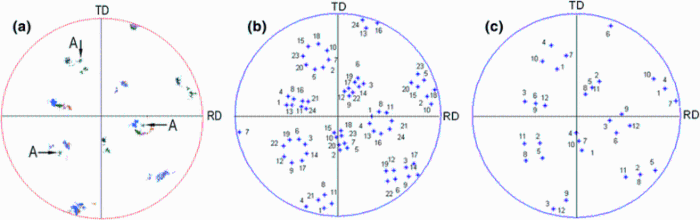
Similar OR analyses are carried out for the medium-carbon steel after Q-P-T process. Figure 4a shows experimental {001}bcc pole figure obtained experimentally for the region of a PAG enclosed by the white line in Fig. 2c. Figure 4b, c shows the K-S and N-W ORs simulated from {001}bcc pole figure, respectively. It can be seen from Fig. 4 that the simulated K-S and N-W ORs also do not well coincide with the experimental {001}bcc pole figure.
Fig. 4 a Experimental {001}bcc pole figure of lath martensite and retained austenite corresponds to the area surrounded by the white line in
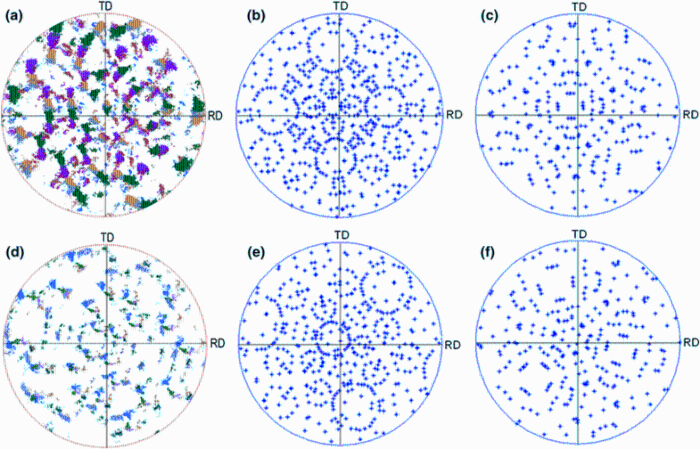
For distinguishing these ORs, high-index directions are plotted. In this study, {123}bcc pole figure was chosen as the high-index direction after trial and error because the difference in ORs between the specimens investigated becomes most distinctive. Figure 5 shows the experimental {123}bcc pole figures of lath martensite and retained austenite in low- (a-c) and medium-carbon (d-f) steels after Q-P-T process, which corresponds to the region enclosed by the white line in Fig. 2a, c, respectively. Figure 5a, d is patterns measured, while assuming the K-S (Fig. 5b, e) and N-W (Fig. 5c, f) ORs simulated from {123}bcc pole figures, respectively. A comparison of the experimental pole figures with the simulated ones reveals that the Fig. 5a, b seems to be better comparability. Therefore, the study of the high-index pole figure suggests that the K-S OR seems sufficient to describe the experimental pole figures in the low-carbon Q-P-T steel. Whereas, comparing Fig. 5d with Fig. 5e, f, the OR of the medium-carbon Q-P-T steel presents neither K-S nor N-W relationship. Morito et al. [8] reported that the OR between austenite and martensite is near K-S relationship in low-carbon alloys and some laths seem to have nearly Nishiyama relationship in high carbon alloys. The OR that they observed is identical to that in the present study described above.
Fig. 5 Experimental {123}bcc pole figures of the lath martensite and retained austenite in low-carbon a-c and medium-carbon d-f steels after Q-P-T process. a, d Are patterns measured, while b, e K-S, c, f N-W ORs simulated from {123}bccpole figures, respectively
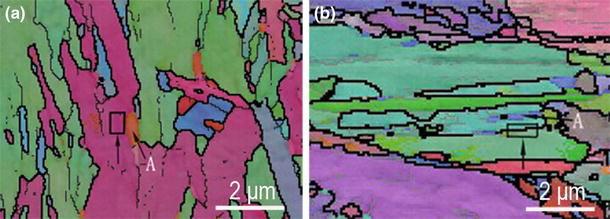
For demonstrating the method developed by Miyamoto et al., two low- and medium-carbon Q-P-T steels with significant amount of retained austenite were used for the OR measurement in this study. Figure 6 shows the partial magnification OIM of Fig. 2a, c, the area of black rectangles adjacent to the retained austenite is selected for analysis and the symbol A denotes the retained austenite.
Fig. 6 Research area (in black rectangle) of low-carbon steel a and medium-carbon steel b after Q-P-T process corresponds to the partial magnification of
The Euler angles of retained austenite obtained by numerical fitting and experimental measurement are presented in Table 2. It is clear that the Euler angles of retained austenite obtained by numerical fitting are in close agreement with those obtained experimentally. Therefore, the method for determining the OR between martensite and the parent austenite based on numerical fitting of EBSD data is valid. In addition, for low-carbon Q-P-T steel, when \(\Delta \theta_{\text{average}} = 2.6462\), the Euler angles of \(V^{f \to b}\) are \(\phi_{1} = 113.7\), \(\phi = 9.7\), and \(\phi_{2} = 203.8\), respectively; for medium-carbon Q-P-T steel, when \(\Delta \theta_{\text{average}} = 2.8315\), the Euler angles of \(V^{f \to b}\) are \(\phi_{1} = 114.4\), \(\phi = 9.6\), and \(\phi_{2} = 203.8\), respectively.
Table 2 Euler angle of retained austenite obtained by simulation and EBSD measurement
| Sample | Euler angle | ||
|---|---|---|---|
| \(\varphi_{1}\) | \(\varPhi\) | \(\varphi_{2}\) | |
| Low-carbon Q-P-T steel (simulation) | 216.55 | 12.85 | 9.40 |
| Low-carbon Q-P-T steel (measurement) | 217.39 | 12.79 | 9.42 |
| Medium-carbon Q-P-T steel (simulation) | 79.80 | 45.60 | 40.30 |
| Medium-carbon Q-P-T steel (measurement) | 79.71 | 45.59 | 40.38 |
Since it is difficult to quantitatively determine the OR during martensitic transformation by low-indexed direction, the stereographic projections of austenite on the high-indexed directions were used. The method proposed by Miyamoto et al. based on numerical fitting of EBSD data without the presence of retained austenite has been proved practicable herein. However, there are still two possible problems in the method: (1) Eq. (1) has six unknown parameters, \(C_{n}\) and \(C_{m}\)correspond to 24 variants, respectively. In order to accurately obtain OR, the decrease of procedure step and the increase of numerical fitting of EBSD data are needed, which will result in tedious calculation. (2) The calculated error of crystallographic orientation of austenite is less than 1°, and the K-S OR is misoriented by 5.26° from the N-W OR, which will lead to a larger margin of error if the OR of martensitic transformation is determined based on the calculated crystallographic orientation of austenite. Therefore, a modified method is developed to distinguish the OR of martensite and the prior austenite in Q-P-T steel contained significant amount of retained austenite based on the method of Miyamoto et al. proposed as following.
If the OR between lath martensite and the prior austenite is estimated as K-S OR or N-W OR, the OR matrices (\(V^{f \to b}\)) are expressed as Eqs. (4) and (5), respectively.
$ (V_{{{\text{K}} - {\text{S}}}}^{f \to b} = \left( {\begin{array}{*{20}l} {0.742} \hfill & { - \,0.667} \hfill & { - \,0.075} \hfill \\ {0.650} \hfill & {0.742} \hfill & { - \,0.167} \hfill \\ {0.167} \hfill & {0.075} \hfill & {0.983} \hfill \\ \end{array} } \right),$ (4)
$ (V_{{{\text{N}} - {\text{W}}}}^{f \to b} = \left( {\begin{array}{*{20}l} {0.000} \hfill & {0.707} \hfill & { - \,0.707} \hfill \\ { - \,0.169} \hfill & {0.697} \hfill & {0.697} \hfill \\ {0.986} \hfill & {0.120} \hfill & {0.120} \hfill \\ \end{array} } \right).$ (5)
In the case of K-S OR or N-W OR, there are 24 or 12 martensite variants. Therefore, the Eqs. (4) and (5) are the OR matrices correspond to K-S OR and N-W OR, respectively. In this study, a modified method for quantitatively determining the OR between martensite and the prior austenite has been developed as follows:
(1) We select the \(M^{\text{fcc}}\) as the average orientation matrices from the crystallographic orientation data points of retained austenite in a prior austenite.
(2) We select the \(M_{i}^{\text{bcc}}\) as the orientation matrix of martensite for the \(i\)th measured data point among a total of N in a prior austenite. The \(C_{n}\) and \(C_{m}\) could be calculated by solving Eq. (1) under the given \(V^{f \to b}\), \(M^{\text{fcc}}\), and \(M_{i}^{\text{bcc}}\). In the calculation, \(C_{n}\) and \(C_{m}\) are chosen for \(\Delta \theta_{i}\) being minimal for the \(i\)th measurement point correspond to K-S OR or N-W OR.
(3) The average misorientation \(\Delta \theta_{\text{average}}\) corresponding to K-S OR or N-W OR is obtained from the mean of the N data points.
The martensite data points in the region of black rectangles (Fig. 6) were used for the OR calculation in this study. The \(\Delta \theta_{\text{average}}\) of lath martensite in low-carbon Q-P-T steel is 3.52° and 4.75° correspond to K-S OR or N-W OR, respectively. As well, the \(\Delta \theta_{\text{average}}\) in medium-carbon Q-P-T steel is 2.86° and 2.87° for K-S OR or N-W OR, respectively. It is clear that the OR between martensite and the parent austenite is near K-S OR for low-carbon Q-P-T steel, while the OR is neither K-S relationship nor N-W relationship for medium-carbon Q-P-T steel due to close \(\Delta \theta_{\text{average}}\). However, the OR between martensite and the parent austenite becomes closer to N-W OR with the increase of carbon content due to the evident decrease of \(\Delta \theta_{\text{average}}\) which agrees well with the observation of Morito et al. [8].
The crystallography and the OR between martensite and the parent austenite in both low- and medium-carbon steels after Q-P-T process were determined by means of SEAD and EBSD. The main results are summarized as follows:
1.The OR between martensite and the parent austenite could be quantitatively distinguished by the high-index direction {123}bcc pole figures, which is near K-S relationship for low-carbon Q-P-T steel, while is neither K-S relationship nor N-W relationship for medium-carbon Q-P-T steel.
2.The crystallographic orientations of retained austenite obtained by experimental measurement and numerical fitting orientations using the method developed by Miyamoto et al. [21] are similar. Therefore, the method for determining the OR of martensite and the parent austenite based on numerical fitting of EBSD data is valid.
3.The OR between martensite and the parent austenite is quantitatively determined through a modified method based on the method developed by Miyamoto et al. [21] in this study. The OR is near K-S relationship in low-carbon Q-P-T steel, and with the increase of carbon content, the OR is closer to N-W relationship in medium-carbon Q-P-T steel.
The authors have declared that no competing interests exist.

 WeChat
/
| 〈 |
|
〉 |