

1 Introduction
Single-crystal Ni-based superalloys are used as turbine blade materials because of their excellent mechanical properties at high temperatures [1,2,3,4]. The Ni-based single-crystal superalloy consists of ordered Ni3Al-based γ′ (L12) precipitates and Ni-based γ (FCC) solid solution matrix, where the γ′ precipitates are embedded almost coherently with a small misfit in γ matrix [5]. The pristine γ/γ′ interfaces in superalloy are crucial to the excellent mechanical properties, one of the active research topics in the field [6,7,8,9,10,11,12,13,14,15,16]. Moreover, it was found that the defects, e.g., dislocations, have a great influence on the mechanical properties of Ni-based single-crystal superalloys, mainly leading to the lattice distortion as well as the change in toughness, brittleness and strength [17,18,19,20,21,22,23,24]. Thus, it is critical to understanding the role of defects including γ/γ′ interface and dislocation in the mechanical properties of superalloy.
The molecular dynamics (MD) simulations have often been carried out to study the interaction between misfit dislocation network and γ/γ′ interface. Wu et al. [25,26,27] investigated the effects of temperature and strain rate on the evolution of dislocation network and mechanical properties. Yashiro et al. [28] conducted the MD simulations to study dislocation behaviors at the apices and edges of cuboidal Ni3Al precipitate in the idealized γ/γ′ interface and discussed the effect of residual internal stresses on the stability of the interfaces and predicted a new mechanism of dislocation nucleation along the [001] tensile direction. Prakash et al. [29] observed dislocation-precipitate interaction mechanisms including the cutting of precipitates by a pair of superpartial dislocations, the pinning of threading dislocations and the knitting out of misfit dislocations. Zhao et al. [30] investigated the influence of spatial variation of γ′ microstructure on plastic deformation in a commercial Ni-based superalloy using a combination of phase field (PF) model and fast Fourier transform-based elasto-viscoplasticity (FFT-EVP) model. Zhang et al. [31] studied the structure and electronic properties of different edge dislocation cores in pure nickel crystals using the Cambridge sequential total energy package (CASTEP) method based on density functional theory (DFT) and MD, showing that the reconstruction of the electronic states occurs as the introduction of the dislocations and the broken bonds are very important for the electronic transfer.
The defect evolution during tension was also studied experimentally for superalloy. The transmission electron microscopy (TEM) investigations by Sajjadi et al. [32] illustrated that the temperature dependence of tensile properties of the Ni-based superalloys and found that the deformation mechanisms varied at different temperature regions. As temperature increases, the evolution of microstructures undergoes various stages: dislocation bowing and loop formation, low-temperature stacking fault and APB-coupled dislocation pair formation, dislocation tangle formation and, finally, cross-slip and dislocation climb processes. Zhang et al. [33] carried out a comprehensive TEM study on the microstructures during tension and observed that stacking fault shearing also takes places during plastic deformation at high temperatures, which partly renders superior high-temperature yield strength. On the other hand, as the deformation temperature increases, the predominant deformation mechanism transits from precipitate shearing to precipitate bypassing including Orowan bowing as well as dislocation cross-slip and climb.
Molecular dynamics is one of the effective atomistic methods to study the dynamic mechanism at spatial and temporal scales larger than quantum mechanics methods. The functional forms and their parameterization under theoretical assumptions determine the accuracy and reliability of the interatomic potential and MD simulations. The applicability of potential to describe breaking process is very important since many empirical potential can describe the equilibrium states well, but may have a problem to describe the states far from equilibrium. The most widely used potential to describe alloy is embedded atom method (EAM), e.g., Ni-Al potential proposed by Purja Pun and Mishin [34]. The reactive force field (ReaxFF) proposed by Yun et al. [35] is based on the bond order description of energetics, allowing the chemical bonds break smoothly. Besides the organic and inorganic systems, ReaxFF potential was also applied to study metal and alloy materials. Song et al. [36] studied the applicability of ReaxFF for metal systems by calculating a variety of physical properties of Al. They found that ReaxFF is quite reasonable for describing the lattice constant and cohesive energy of Al, but it is less accurate for the elastic constants. Both EAM and ReaxFF overestimated the elastic constants of Al compared with the DFT and experimental results.
Duin et al. [35, 37, 38] demonstrated the diffusion and internal oxidation of nickel and proposed a new mechanism of oxygen diffusion, in which dissolved oxygen atoms diffuse via the movement of oxygen-vacancy pairs. In addition, they [35] studied elastic constants of the binary alloys at finite temperatures, diffusivity of alloy components in Al/Ni alloy and segregation on the binary alloy surfaces and came to a conclusion that ReaxFF is capable of describing bulk phase behavior at a wide range of pressure conditions. One of the attractive features of ReaxFF potential is that it uses charge equilibration method (Qeq) to calculate atomic charges that are not only critical to oxygen diffusion behaviors, but also necessary to describe the charge transfer due to the unsaturated bonds of defect atoms in pure metals found in the DFT calculations [37].
The major motivation of this work is to carry out a comparative study of tensile process between EAM and ReaxFF potentials to investigate the influences of interatomic potential. Most of the MD simulations in the literature were carried out by using lamellar structure models. In order to study the microstructure evolution of the γ and γ′ phases during the tension process of superalloy, we used three-dimensional (3D) embedded cubic unit models more similar to experimental microstructures. We focused on the correlations between the defect evolution and the mechanical properties of superalloy. Specifically, in the present work, we employed classical molecular dynamics (MD) to study the uniaxial tensile breaking processes for Ni/Ni3Al complex systems compared with pure Ni and Ni3Al systems, respectively. In order to study the applicability of ReaxFF to metal system, surface formation energy and vacancy formation energy of Ni were calculated by ReaxFF potential and compared with DFT, EAM and experiments. To examine the effects of potentials, we carried out MD simulations using two interatomic potentials: EAM [34] and ReaxFF [35]. We showed how the introduction of γ/γ′ interface and dislocations affect the tensile breaking process, especially the tensile strength and elongation percentage. We also studied the effects of temperature and tensile rate as well as the sizes of γ′ on the tension simulations.
2 Models and Methods
2.1 Simulation Models
To study the γ/γ′ interface of superalloy in MD simulations, we constructed four atomic models: coherent Ni/Ni3Al interface model with and without a dislocation in Ni matrix, pure Ni model and pure Ni3Al model. The periodic supercell shown in Fig. 1 contains 2 × 2 × 2 Ni3Al (γ′ phase) embedded in the 10 × 10 × 10 Ni matrix (γ phase). Also, an edge dislocation within matrix along the x [100] axis was added, leading to a coherent interface model with matrix (γ phase) dislocation. The supercell has 3970 atoms in total containing 3943 Ni atoms and 27 Al atoms, respectively. Under coherent model approximation, atoms are arranged at FCC sites so that there is no lattice misfit between Ni and Ni3Al in the initial configurations. Moreover, the orientations of crystal lattices in the models were arranged along the [100], [010] and [001] directions as indicated in Fig. 1. In order to reduce the influence of interaction between interfaces, we chose a model with a small Ni3Al volume fraction. The Ni3Al models of different sizes (1 × 1 × 1, 2 × 2 × 2 and 3 × 3 × 3) were built to investigate the size effects of Ni3Al on the mechanical behavior of materials.
Fig. 1
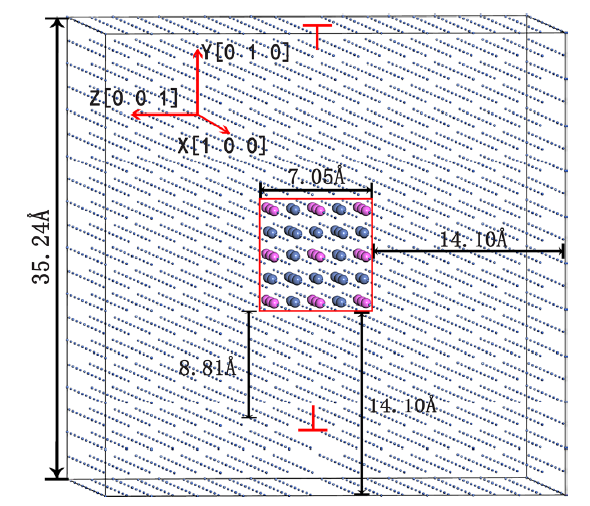
Fig. 1
Atomic structure model of the Ni/Ni3Al coherent interface with an edge dislocation in matrix (γ phase). There are 3911 Ni atoms (gray) in γ phase, 32 Ni atoms (blue) and 27 Al atoms (pink) in γ′ phase (red square)
In the DFT calculations, we used the 2 × 2 × 2 periodic supercell (7.028 Å × 7.028 Å × 7.028 Å) for the bulk models, 3 × 3 × 3 supercell (10.542 Å × 10.542 Å × 10.542 Å) for the vacancy models and 1 × 1 × 3 supercell (3.514 Å × 3.514 Å × 10.542 Å) with the 12.0 Å thickness of vacuum layer for the slab surface models.
2.2 Simulation Methods
In order to verify the applicability of the interatomic potentials, density functional method implemented in Vienna Ab initio Simulation Package (VASP) was used to calculate the vacancy formation energy (Ev), surface formation energy (Esurf) and stacking fault energy (ESCF) of pure Ni system defined as follows:
where En and Eslab(n) are the total energies of bulk and slab models with n atoms; E1 is the total energy per atom of bulk Ni; En-1 is the total energy of the bulk Ni model with a vacancy; S is the surface area of the slab model; and Ehcp and Efcc are the total energies of HCP and FCC bulk structure models with n atoms.
The electron-ion interactions were described by PAW pseudopotentials, and the exchange and correlation energies of electrons were approximated using GGA-PBE functional. The electron orbital was expanded over a plane wave basis set with a kinetic energy cutoff of 400 eV, and the K points were set in an equally spaced (0.01 Å-1) form. The spin polarization was considered in the DFT calculations.
During the MD simulations, all the systems were equilibrated for 10 ps with a time step of 1 fs under the NPT ensembles at 50, 300, 1000, 1350 and 2000 K and 1 atm pressure after energy minimization. After the NPT equilibration, tension with increasing strain was applied along [100] direction at a strain rate \(\dot{\varepsilon } = 3 \times 10^{9}\) s-1. The other strain rates 10 × 109 s-1, 0.3 × 10⁹ s-1 and 0.03 × 10⁹ s-1 were also applied to examine the effects of strain rate. The temperatures of the systems remained invariant at 50, 300, 1000, 1350 and 2000 K throughout the tension simulations. The LAMMPS code [39] with EAM and ReaxFF potentials was used for the MD simulations, and Ovito [40] software was used as a visualization tool for the microstructure analysis in this study.
3 Results and Discussion
3.1 Validation of the Interatomic Potentials
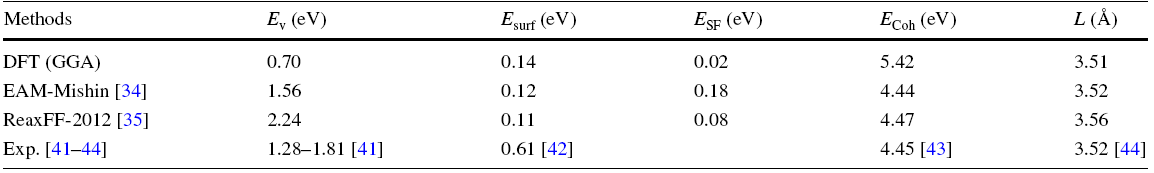
In order to compare the performance of the interatomic potentials, we calculated Ev, Esurf, ESF, cohesive energy (ECoh) and lattice constant (L) of pure Ni by DFT, EAM and ReaxFF, compared with the experiments in Table 1. It is shown that the DFT-GGA underestimated the vacancy formation energy, while both the EAM and ReaxFF predictions were closer to the experiments. Both the EAM and ReaxFF results of surface energy were close to DFT-GGA, but all were much lower than the experiment. The ReaxFF predicted stacking fault formation energy more closely to the DFT-GGA than the EAM. Moreover, both the EAM and ReaxFF results of cohesive energy were close to the experiment, but the DFT-GGA overestimated the cohesive energy. All the simulation methods could predict the lattice constant well. Comparing the EAM with the ReaxFF, the EAM predicted lower vacancy formation energy, but higher stacking fault energy than the ReaxFF.
Table 1 Formation energy of vacancy, surface (100), stacking fault as well as cohesive energy and lattice constant of pure Ni calculated by DFT-GGA, EAM and ReaxFF, compared with the experiments
 |
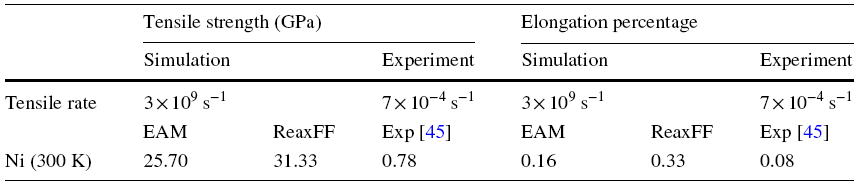
The MD simulations of uniaxial tension along [100] were carried out for pure Ni at 300 K using the EAM and the ReaxFF. The tensile strength and elongation percentage are shown in Table 2, compared with the experiments. Both the EAM and ReaxFF potentials predicted the theoretical tensile strength and elongation by about two orders of magnitudes higher than the experiments. The reasons of overestimation arise from the facts that the computation models used in the simulations were idealized without impurity or boundary defects, leading to the difficulty of defect nucleation, and the tensile rates in the simulations were much higher than the experiments. The limited size of supercell also added periodic boundary constraints into the MD simulations. Moreover, the imperfection of interatomic potentials also could be the reasons. It is also improvable for the capabilities of the potentials to reproduce quantitatively the static experimental or DFT results of defect energies. Instead of the quantitative predictions of absolute values, this work focused more on the qualitative trends with particular emphasis on how the microstructures change during the tension process, revealing the microscopic mechanisms of deformation and fracture.
Table 2 Tensile strength and elongation percentage of pure Ni at 300 K calculated by the EAM and the ReaxFF compared with the experiments
 |
3.2 Tension MD Simulations
3.2.1 Influence of Tensile Rate on Tension
To examine the effects of tensile rate, we applied four different constant tensile rates \(\dot{\varepsilon } = 10 \times 10^{9}\) s-1, 3 × 10⁹ s-1, 0.3 × 10⁹ s-1 and 0.03 × 10⁹ s-1, respectively, corresponding to strain increase of 0.01/ps, 0.003/ps, 0.0003/ps and 0.00003/ps during the uniaxial tension of pure Ni at 300 K. The tension stress-strain curves in Fig. 2 indicate that both the tensile strength and the elongation decrease as the tensile rate decreases. The ReaxFF simulations are more sensitive to the tension rate than the EAM results. This trend can be understood from the microstructures that the large tensile rate reduced the relaxation time for defect (e.g., dislocation) movement and reactions and the accumulated defects increased the tensile strength.
Fig. 2
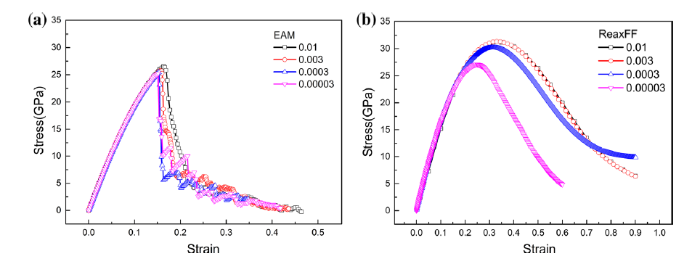
Fig. 2
Stress-strain curves of pure Ni at various tensile rates 0.01, 0.003, 0.0003 and 0.00003/ps: a EAM, b ReaxFF
3.2.2 Tension Simulations of Ni, Ni3Al and Ni/Ni3Al Systems
In this work, we applied the two interatomic potentials EAM and ReaxFF to simulate uniaxial tension processes of the Ni/Ni3Al systems with and without dislocations, compared with the pure Ni and Ni3Al systems at the various temperatures. The stress-strain relations during the tension process are shown in Fig. 3, and the corresponding critical values of tensile strength and elongation percentage are shown in Table S1 of Supplementary Materials (SM). It is found that the choice of interatomic potentials may have quantitative influences on the tensile properties. The quantitative interpretation of MD results based on the empirical potentials should be cautious. On the other hand, the qualitative trends predicted by the simulations are always more reliable. For example, the tensile strength decreases with the introduction of interface and dislocation. These defects facilitate the nucleation and movement of dislocations.
Fig. 3
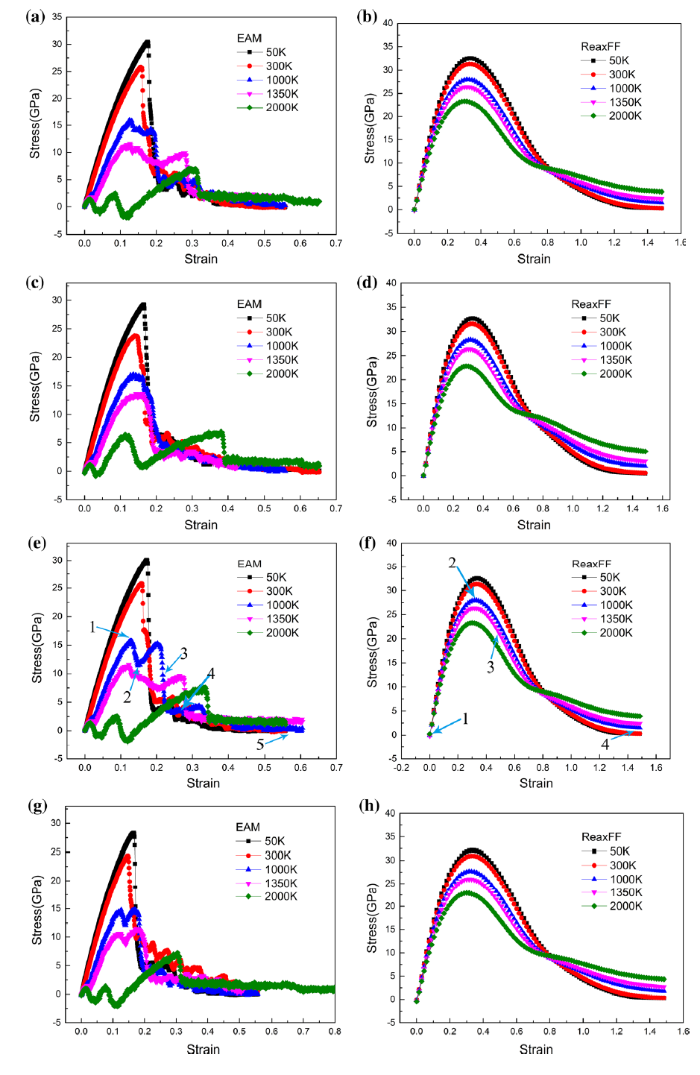
Fig. 3
Stress-strain curves of tension simulations using EAM and ReaxFF at various temperatures 50 K, 300 K, 1000 K, 1350 K and 2000 K for the four model systems: a and b pure Ni; c and d pure Ni3Al; e and f Ni/Ni3Al interface; g and h Ni/Ni3Al interface with a matrix dislocation
The stress-strain curves of the EAM simulations in Fig. 3 show that the tensile strength dropped dramatically as the temperature increased. The trend of stress-strain curves is in good agreement with the previous computational simulation [26, 46]. The tensile elongation increased with temperatures in the ductile Ni and Ni/Ni3Al systems, but changed little in the brittle Ni3Al and the Ni/Ni3Al model with the dislocation. The tension of all the four studied systems showed brittle fracture behaviors at 50 K and 300 K: a continuous increase in stress followed by the sudden drop of stress. At the higher temperatures of 1000 K and 1350 K, the stress stayed oscillation after yield points exhibiting ductile behaviors. The high temperatures facilitate not only the initiation of the dislocations, also the movement and annihilations of dislocations that recover the stress, leading to yield.
Both EAM and ReaxFF MD simulations show the yield strength and elongation percentage decreased as temperature increases, but the EAM results were more sensitive to the temperature increase than the ReaxFF results. The ReaxFF simulations showed the ductile Ni and Ni/Ni3Al systems exhibit longer yielding region than the brittle Ni3Al.
3.2.3 Effects of γ′ Size on Tension Process
In order to examine the effects of γ′ size on the tensile properties, we studied the uniaxial tension behavior of the Ni/Ni3Al models of smaller 1 × 1 × 1 and larger 3 × 3 × 3 sizes using the EAM and the ReaxFF. The stress-strain curves are shown in Fig. 4. The corresponding critical values of tensile strength and elongation percentage are listed in Table S2 of SM.
Fig. 4
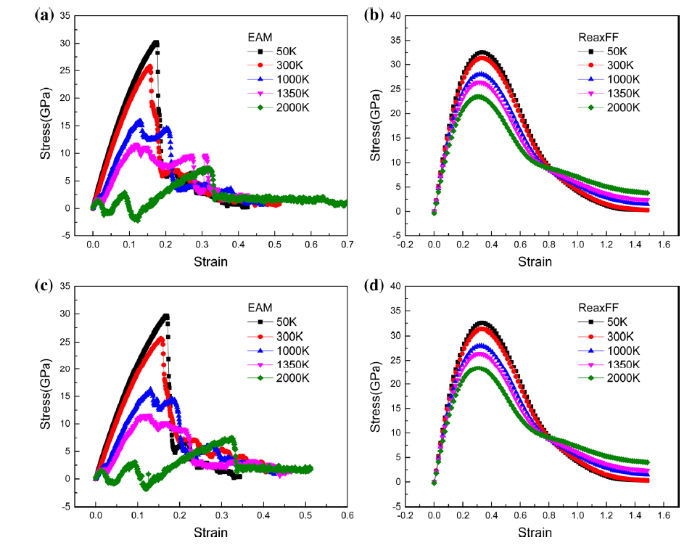
Fig. 4
Stress-strain curves of tension simulations using the EAM and the ReaxFF at various temperatures (50 K, 300 K, 1000 K, 1350 K and 2000 K) for the Ni/Ni3Al models with two different γ′ phase sizes: a and b 1 × 1 × 1 γ′ phase, c and d 3 × 3 × 3 γ′ phase
It is confirmed that the varied γ′ sizes in this study have little effects on the tensile behaviors. The simulation results are supported by the results in Ref. [46]. The tensile strength increased slightly with the sizes of γ′ phase. This suggests that the larger γ′ phase model in this study can hinder more the dislocation slip and increase the resistance of dislocation movement.
3.3 Microstructure Evolution During Tension Process
To understand the microscopic mechanisms of deformation and fracture, it is critical to examine the microstructure evolutions at an atomistic scale from the snapshots of MD simulations. Figure 5a-e shows the microstructures of Ni/Ni3Al interface at several typical stages corresponding to the critical points of the stress-strain curves during the EAM tension simulations at 1000 K.
Fig. 5
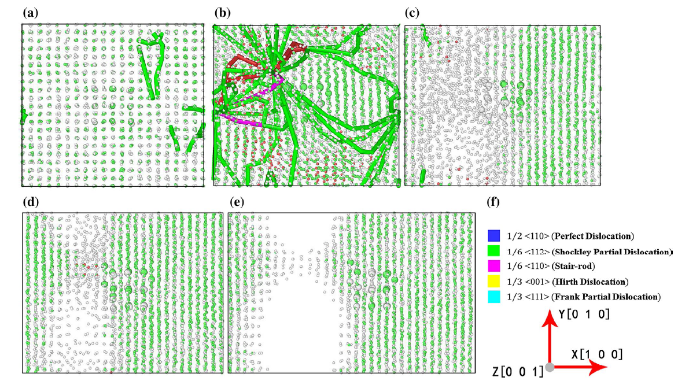
Fig. 5
Snapshots of the microstructures of Ni/Ni3Al interface at the typical stages of the MD tension simulations at 1000 K using the EAM potential. aε = 0.119 [point 1 in
Figure 5a corresponds to the first maximum stress point, indicating that the stress built up continuously until the stress is large enough so that the dislocations started to nucleate. The dislocation slip dominated the plastic deformation. The initial generation and movement of dislocations led to the drop of stress. As the tension strain increased, the dislocations formed loops and accumulated, mostly at the interface, until they got stuck as shown in Fig. 5b. The dislocations with high density could not move causing the increase in stress again. Further increased strain caused more void space for free atom movement, leading to the formation of non-localized amorphous structures at the Ni side of the Ni/Ni3Al interface that released the concentrated stress (Fig. 5c). More tension caused the formation of cavity in the amorphous structures accompanied by the formation of necked regions as shown in Fig. 5d. The cavities continued to grow, and the necked regions became narrower. The Ni atoms at the narrow-necked region rearranged to crystalize to form tiny connected ordered structures before breaking within the Ni matrix as shown in Fig. 5e. The EAM simulations revealed that the amorphous formation and vacancy/cavity formation at the Ni/Ni3Al interface play important roles at the early stage of fracture.
The evolution of microstructures of Ni/Ni3Al interface during the ReaxFF tension simulations at 1000 K is shown in Fig. 6a-d. At the initial stage of deformation, the system gradually became amorphous starting from the Ni/Ni3Al interface as shown in Fig. 6a. At maximum stress point (Fig. 6b), the snapshots of microstructure showed most of the system became amorphous. Further tension caused the system to change from the crystalline structure completely to an amorphous structure (Fig. 6c). At the later stage of deformation, the system was gradually fractured by tension, forming lamellar structure perpendicular to the tensile direction, and remained amorphous within each layer (Fig. 6d). The ReaxFF simulations generated more amorphous structures compared with the EAM results.
Fig. 6
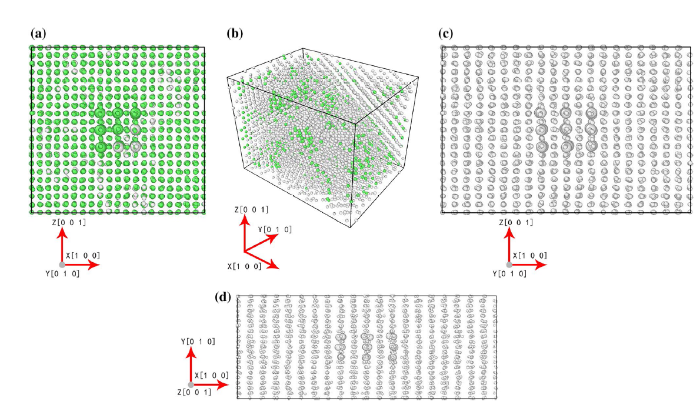
Fig. 6
Snapshots of the microstructures of Ni/Ni3Al interface at the typical stages of the MD tension simulations at 1000 K using the ReaxFF potential. aε = 0.045 (point 1 in
During the tensile simulation of Ni/Ni3Al interface system at 50 K, we found a slip band at 45 degree direction of z [001] axis as shown in Fig. S2 of SM. The similar microstructures were found at 300 K. These deformation characteristics were observed in experiments [47] and were simulated by Hu et al. [46]. The dislocations were first generated along the directions of the maximum shear stress. We also observed that the stacking faults were generated on the corresponding slip plane. The similar results were found for the models with larger or smaller γ′ phase sizes, as shown in Figs. S3 and S4 of SM, showing that the microstructure evolution discussed here is independent of the size of γ′ phase.
Fig. 7
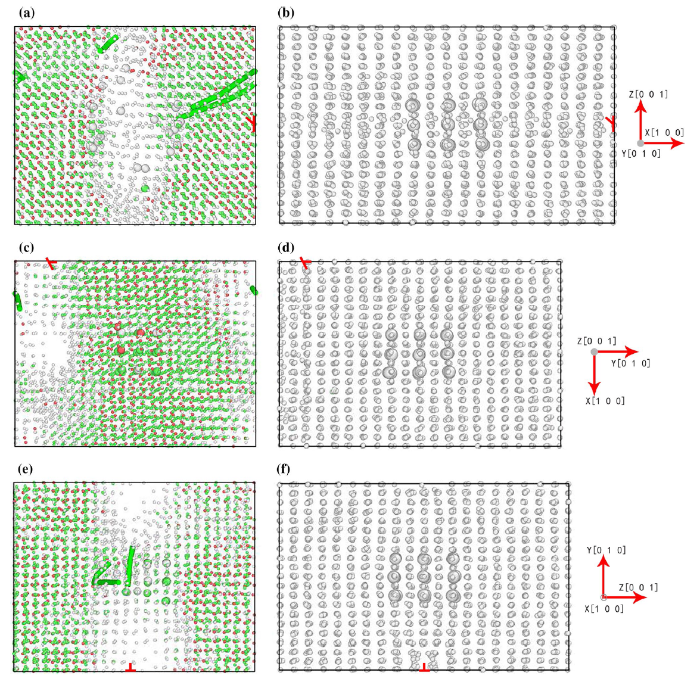
We found that the tension along the different directions led to the varied fracture positions via EAM. The dislocation was initially set along x [100] direction. If the stretching direction is x [100], same as the dislocation direction, the dislocation had little influence on the fracture position, as shown in Fig. 7a. The cracks were still generated in the γ phase near the interface and propagated into the γ′ phase. If the tensile directions were y [010] and z [001], perpendicular to the dislocation, the fracture occurred in γ phase, as shown in Fig. 7c, f. The ReaxFF simulations always showed amorphous lamellar structures for various tension directions.
For the Ni/Ni3Al interface with a matrix dislocation, we observed that the microstructures of the tensile deformation obtained at 300 K are similar to those at 1000 K, and the fracture position and manner are also similar shown in Figs. S5-S7 of SM.
In this work, for comparison, we also studied the system of pure Ni and pure Ni3Al, as shown in Figs. S8 and S9 of SM. We observed that the pure Ni system showed ductile necking at fracture process, while the pure Ni3Al system has brittle cleavage fracture mechanism. Similar to the interface and dislocation models, there are stacking faults on the slip planes of the pure Ni and Ni3Al systems.
4 Conclusion
In this work, the microscopic tension processes of Ni/Ni3Al complex systems, including the stress-strain relations and the evolution of microstructures, were investigated using molecular dynamics simulations with the EAM and the ReaxFF interatomic potentials. The cracks formed and propagated within Ni region near the Ni/Ni3Al interface through the EAM simulations. The EAM simulations showed that the generation and accumulation of dislocations increased tensile stress, leading to hardening, but the annihilation of dislocations, facilitated by high temperature, reduced tensile stress, leading to softening. The interplay between the generation and annihilation of dislocations led to the oscillating stress at yielding region. On the other hand, the ReaxFF simulations formed amorphous lamellar structure perpendicular to the tensile direction. Both the EAM and ReaxFF potentials predicted the formation of amorphous structures, while the more amorphous found in ReaxFF simulations might contribute to the larger tensile strength. Understanding the failure mechanism at an atomistic level helps to develop strategy to increase mechanical strength of superalloy.
Acknowledgements
This work was financially supported by the National Key Research and Development Program of China (Grant Nos. 2017YFB0701502 and 2017YFB0702901) and the National Nature Science Foundation of China (Grant No. 91641128).
Reference
- About AMSE
- Authors and reviewers
- Contact
E-mail: ams@imr.ac.cn
Address: 72 Wenhua Road, Shenyang, Liaoning, 110016, China
 WeChat
- Copyright © Editorial Office of Acta Metallurgica Sinica (English Letters), All Rights Reserved.
