Search for articles:
He Li , Yansong Liu
Corresponding authors:
Received: 2019-06-3
Revised: 2019-07-1
Online: 2020-02-10
Copyright: 2019 Editorial board of Acta Metallurgica Sinica(English Letters) Copyright reserved, Editorial board of Acta Metallurgica Sinica(English Letters)
More
Abstract
In this work, aluminum oxide (Al2O3) ceramic samples were fabricated by 3D stereolithography printing. Printing process was followed by debinding and sintering. In addition, the effect of sintering temperature on microstructure and properties was investigated. Flexure strength was observed to increase with increasing sintering temperature due to fewer pores, fewer defects and stronger grain boundary bonding of samples at higher sintering temperatures. Maximum flexure strength of 138.5 MPa was obtained when sintering temperature was 150 °C. Furthermore, the shrinkage along length direction decreased with the decreasing sintering temperature until reaching minimum value of 1.02% after sintering at 1200 °C. After sintering at 1280 °C, flexure strength was 24.0 MPa and the shrinkage along length direction was 2.1%, which meets demands of ceramic core.
Keywords:
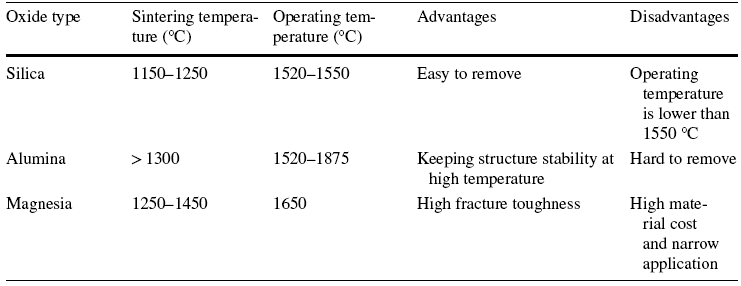
Ceramic cores are widely used in hollow shape casting of alloy blades, which need to satisfy certain requirements like dimensional conformity, moderate mechanical strength, good thermal stability and gas permeability [1, 2]. A hard and wear resistant surface is required to retain the high-strength behavior of the ceramic core [3, 4]. To satisfy these properties, ceramic cores are usually composed of silica, alumina or magnesia [5]. The detailed data are listed in Table 1 [6]. Among these materials, alumina has been widely used due to its high melting point, high hardness, and excellent wear and corrosion resistance [7]. For silica-based ceramic cores, the sintering shrinkage needs to be as low as 1% and the flexural strength should be 10-40 MPa in order endure the high thermal load [8]. The ceramic cores are usually a compromise in order to produce hollow, precise cooling structures with complex shapes inside the casting [9]. The open porosity of the ceramics should be higher than 20% to allow chemical dissolution by NaOH or HF solutions after casting [10]. It should also be easily removed by a process that is not harmful to the metal [11]. The ceramic core used for forming internal cooling structure plays an essential role during the casting of hollow turbine blades [12].
Heat-press molding, gel casting and injection molding are widely used for manufacturing ceramic cores [13]. To address the problems of cost and efficiency during these forming processes, 3D printing techniques have been applied for fabricating ceramic cores [14]. The selective laser sintering (SLS) has been reported to fabricate ceramic parts. Deckers et al. [15] developed a new powder metallurgy process to make alumina parts though indirect selective laser sintering and obtained the alumina parts with a density up to 94.1%. Shahzad et al. [16] investigated the SLS parameters on the density and strength of the composite SLS parts and obtained a relative density of 36%. Chen et al. [17, 18] developed a novel method to prepare high-porosity mullite ceramic foams by SLS using fly ash hollow spheres as raw materials. Stereolithography (SL) is one of the 3D printing techniques which was first demonstrated in 1980s and develops rapidly due to its ability to fabricate complex products with fine structures [19]. Today, this technique is regarded as the most prominent and popular 3D printing technology [20]. The printing materials of the ceramic slurry are typically composed of inorganic powders and photosensitive resin. The main ingredients of the photosensitive resin are photoinitiator, oligomer, active diluent monomer and other additives [21]. When the photosensitive resign is exposed to ultraviolet (UV) light, the liquid slurry turns to solid state. Although inorganic powder is inert to the ultraviolet light, it has been dispersed uniformly in the photosensitive resin. A ceramic green body is obtained during the photosensitive resin curing process which is produced though point-to-line, line-to-layer, and then layer-by-layer procedures.
To obtain high-quality ceramic parts, the UV curable ceramic slurry should have a good physical stability and fluidity. Although several reports have focused on improving the content of inorganic powders of the UV curable ceramic slurry, it is generally difficult to achieve a concentration of 65 vol% [22,23,24]. Very recently, Chen et al. [25, 26] had successfully developed high solid loading low viscosity oxide-based ceramic slurries for SL printing of porous honeycomb cordierite parts with complex structures. During the debinding and sintering process, the limited content of inorganic powders leads to large shrinkage, low relative density and smaller flexure strength, and also may bring about some cracks on the surface of the ceramic parts. The ceramic core should have moderate flexure strength, which will allow it to withstand mechanical shock in the process of core preparation. Ceramic core should be dimensionally stable with a good surface finish. Furthermore, the sintering shrinkage needs to be as small as possible, so as not to cause core cracking or deformation. Due to several requirements imposed on the ceramic core, adjusting and controlling its flexure strength, porosity and shrinkage are challenging during the sintering process. Zhou et al. [27] developed a novel direct fabrication of an integral ceramic mold by stereolithography with lower costs and shorter lead time. According to Chen et al. [28], the influences of stereolithography parameters including laser scanning speed, sliced layer thickness and laser spot compensation had been investigated and a bending strength of at least 10 MPa and open porosity of 35% were reached, making the ceramics adequate to produce investment casting molds. Bae et al. [29] fabricated the ceramic core though SL with the shrinkage of 10.7%. There are still many problems in the application of the SL-printed ceramic cores.
In this present work, we investigated the effect of the sintering temperature on the microstructure and mechanical properties of the Al2O3 ceramic fabricated though SL 3D printing. Firstly, physical properties such as shrinkage, open porosity, relative density and water absorption were measured. Then, the microstructure and composition were characterized through X-ray diffraction (XRD) and X-ray photoelectron spectroscopy (XPS). Finally, the flexure strength was measured to compare mechanical properties after sintering at different sintered temperatures.
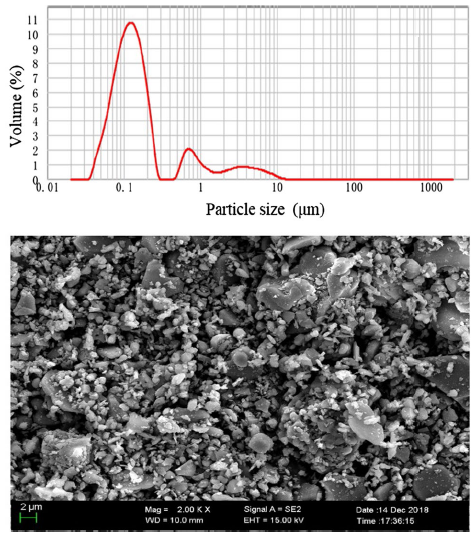
The ceramic slurry was a mixture which was obtained by adding the alumina powder (AW-SF, Henan Hecheng Inorganic New Material Co., Ltd.) to photosensitive resin (Al100-1, Beijing Ten Dimensions Technology Co., Ltd.). The particle size distribution of the alumina powder is shown in Fig. 1. The alumina powder was dried at 200 °C for 5 h in a blast air oven and subsequently used for the ceramic slurry preparation. (The process is to remove moisture from the alumina powder.) The viscosity of the used photosensitive resin was 35 mPa s. The Al2O3 powders (495 g) were added to 100 g photosensitive resin slowly and stirred the mixture vigorously. After the mixture was stirred evenly, it was ball-milled for 2 h with a planet-type grinding mill at 400 rpm. Then mixture was vacuum deformed for 10 min to obtain the final slurry.
Fig. 1 Particle size distribution of Al2O3 powders and the SEM image of Al2O3 powders
A cuboid model (50 mm × 5 mm × 4 mm) was drawn by UG software and imported into STL format. The model file was transferred to the 3D printer. The ceramic slurry was then transported to the 3D printer (AutoceraM, Beijing Ten Dimensions Technology Co., Ltd.). The exposure energy was 10 mW/cm2 and the single layer exposure time was 10 s. The layer thickness was 0.1 mm. Then the model was printed. The excessive slurry left in the printed bodies was cleansed with ethanol, and the green samples were obtained.
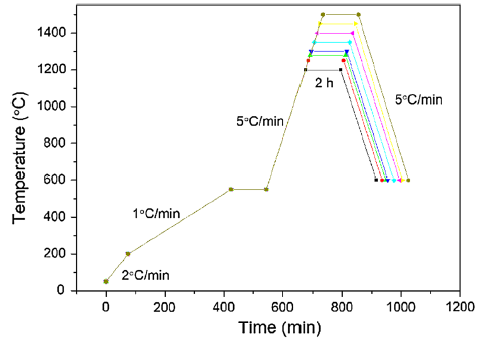
The green bodies were debinded in a muffle furnace (HEFEI KE JING MATERIALS TECHNOLOGY CO., LTD. China). Firstly, the green bodies were heated to 200 °C with a heating rate of 2 °C/min. Secondly, the samples were heated to 550 °C with a heating rate of 1 °C/min and then maintained for 2 h. Thirdly, the samples were heated to the target temperatures (T) with a heating rate of 5 °C/min (T = 1200, 1250, 1280, 1300, 1350, 1400, 1450, 1500 °C). The heating was sustained for 2 h. The debinding and sintering atmosphere was air. The debinding and sintering profiles are illustrated in Fig. 2. The samples were denoted as S(T).
Fig. 2 Debinding and sintering process of the green bodies
Powder X-ray diffraction (XRD) patterns were recorded on a Bruker D8 FOCUS (Bruker Corporation, Germany) X-ray diffractometer with Cu Kα radiation. The diffraction angle of 2θ was scanned in the range from 10° to 90°. The voltage was 40 kV, and the generator current was 30 mA. The scan rate was 0.02°s-1 per step. The crystallite size of Al2O3 was calculated using the following Scherrer’s equation from the peak at 2θ = 35.3°.
$d = \frac{K\lambda }{B\cos \theta } .$(1)
where d is the average crystallite size of Al2O3 (nm), K is the Scherrer constant (0.89 in the present case), λ is the wavelength of X-ray (0.154056 nm), and B is the peak width at half height of Al2O3. The Raman test of the samples was measured on a Confocal Raman Microscope Systems (Alpha300R, WITec) with a laser source of 532 nm, power of 50 mW, and slit width of 50 μm. X-ray photoelectron spectroscopy (XPS) was performed using an Axis Supra (Shimadzu) photoelectron spectrometer. Scanning electron microscope (SEM) image was obtained from Helios G4 CX (FEI Corporation). Energy-dispersive spectroscopy (EDS) was also conducted. Transmission electron microscopy (TEM) image was obtained from Tecnai G2 F20 (FEI Corporation).
The bulk density of the samples after sintering process was measured with the Archimedes method. The accuracy of the balance was 0.0001 g (METTLER TOLEDO, Switzerland). The theoretical density of the Al2O3 was calculated as 3.95 g/cm3 [30]. The shrinkage of the sintered samples was measured with the following formula:
$\delta = \frac{{L - L_{1} }}{L} \times 100\% .$(2)
where \(\delta\) is the shrinkage of the sintered samples (%), L is the length of the samples before the sintering process (mm), and \(L_{1}\) is the length of the samples after the sintering process (mm).
The open porosity, water absorption and bulk density were calculated using the following formulas:
$B = \frac{{G_{2} - G_{1} }}{{G_{2} - G_{3} }} \times 100\%.$(3)
$W = \frac{{G_{2} - G_{1} }}{{G_{1} }} \times 100\%.$(4)
$d = \frac{{G_{1} \times d_{\text{water}} }}{{G_{2} - G_{3} }} \times 100\%.$(5)
where \(B\) is the open porosity of the sintered samples (%), \(W\) is the water absorption of the sintered samples (%), \(d\) is the bulk density of the sintered samples (g/cm3), \(G_{1}\) is the mass of the dry samples (g), \(G_{2}\) is the mass of the wet weight of the samples (g), \(G_{3}\) is the mass of the buoyant weight of the samples (g), and \(d_{\text{water}}\) is the density of the water (g/cm3).
The flexure strength of the sintered samples was tested with an electronic universal testing machine (CMT4304, SUNS, China) using the three-point flexure method [31]. The loading speed was 0.5 mm/min, and the span was 30 mm. The specific calculation formula is as follows:
$\sigma_{f} = \frac{3FL}{{2bd^{2} }}.$(6)
where \(\sigma_{f}\) is the bending strength (MPa), F is the maximum load (N), L is the span of lower fixture (mm), b is the width of the sample (mm), and d is the thickness of the sample (mm).
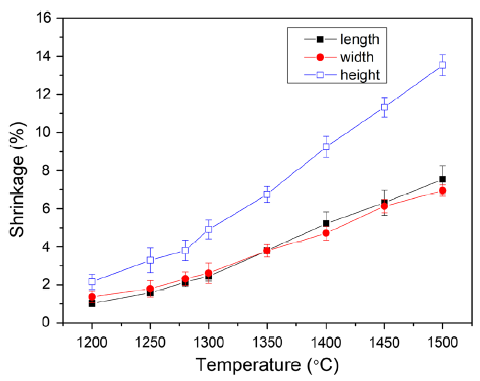
The shrinkage of the sintered samples is shown in Fig. 3, where it is observed to increase in all the three directions as the sintering temperature is increased. Along the length direction, width and height directions, the shrinkage is in the range of 1.0-7.5%, 1.4-6.9% and 2.2-13.5%, respectively. It is also observed that the shrinkage along length direction is approximately equal to the shrinkage of the width direction. However, the shrinkage along the height direction is nearly two times compared to the length and width directions. The different magnitudes of shrinkage in the three directions can be explained as follows: on the one hand, the bottom of the crucible which was in contact with the height side of the sintered samples hindered the free crystal growth of the samples in that direction. On the other hand, the green samples were fabricated using a layer-by-layer mode. The different curing depth conditions of height direction compare with length and width direction may lead to the different shrinkage [32]. The heterogeneous green parts can lead to different shrinkage in the three directions.
Fig. 3 Shrinkage of the sintered samples in different directions
Shrinkage is a key characterization parameter of sintering density. The shrinkage rate increases with increase in sintering temperature in all directions. After the debinding process, there are voids between the alumina particles. These voids disappear during the sintering process, which generally leads to shrinkage. With increase in sintering temperature, the alumina particles are bonded with each other, the crystal grows, the porosity and crystal boundary decrease gradually, all of which lead to the greater shrinkage rate.
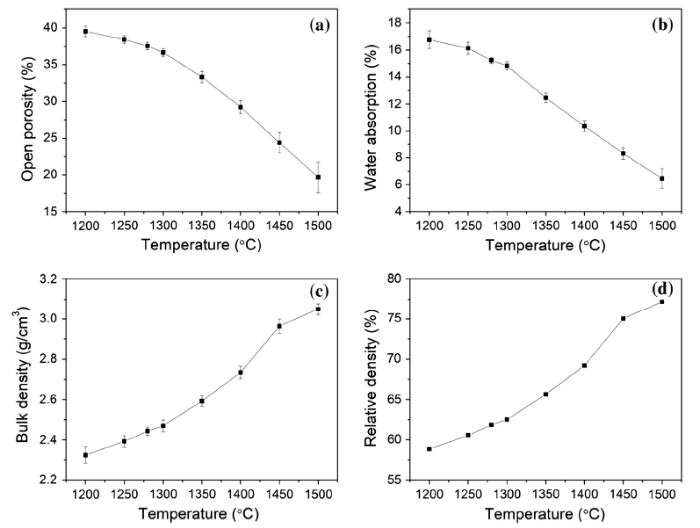
The variations of the open porosity, water absorption, bulk density and relative density of the sintered samples with temperature are shown in Fig. 4. The open porosity decreased from 39.5 to 19.7% as the sintered temperature increases from 1200 to 1500 °C. Compared with the research of Lee et al. [33], the porosity was much lower than the calcium phosphate scaffolds prepared by acid-etching method of 65-85% (Fig. 4a). The water absorption also decreased from 16.8 to 6.5% as the sintered temperature increased (Fig. 4b). However, the bulk density increased from 2.3 to 3.0 g/cm3 as the sintered temperature increased (Fig. 4c). Similar trend of the bulk density, the relative density also increased from 58.9 to 77.2% as the sintered temperature raised [34]. Porosity is one of the major structural defects in most ceramics, as it significantly reduces the load-bearing area, in addition to causing stress concentration. According to the Ryskewitsch empirical formula [35], when the composition of ceramic materials is identical, the porosity will cause significant strength difference according to the following:
$\sigma = \sigma_{ 0} \exp ( - \alpha p).$(7)
where \(\sigma\) is the strength (MPa), \(\sigma_{ 0}\) is the strength of porosity at 0 (MPa), \(p\) is the porosity (%), and \(\alpha\) is a constant. The relationship between the porosity and strength will be described in detail in Sect. 3.3.
Fig. 4 Variation of the open porosity, water absorption, bulk density and relative density of the sintered samples: a open porosity; b water absorption; c bulk density; d relative density with temperature
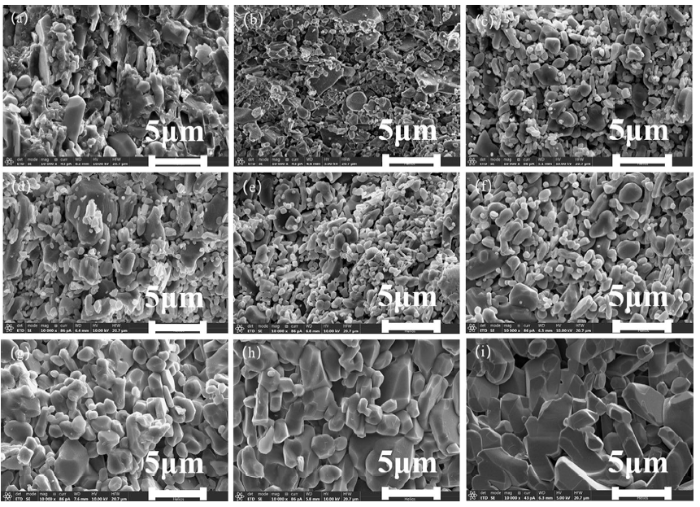
The SEM images of the green body and of the samples sintered at different temperatures are shown in Fig. 5. Different morphologies were obtained at various sintered temperatures. Generally, several pores were observed in the bulk material of the green body (Fig. 5a). After sintering at 1200 °C, a large number of pores disappeared and many small spherical particles were formed (Fig. 5b). The particles grew with increasing sintering temperature, especially for the sintered samples at 1500 °C which was composed of relatively large particles as compared with other samples (Fig. 5i). The grain boundary diffusion increased when the sintering temperature was higher than 900 °C. The diffusion path was shorter which facilitated the disappearance of the pores [36].
Fig. 5 SEM images of the green body and of the samples sintered at different temperatures: a green body; b 1200 °C; c 1250 °C; d 1280 °C; e 1300 °C; f 1350 °C; g 1400 °C; h 1450 °C; i 1500 °C
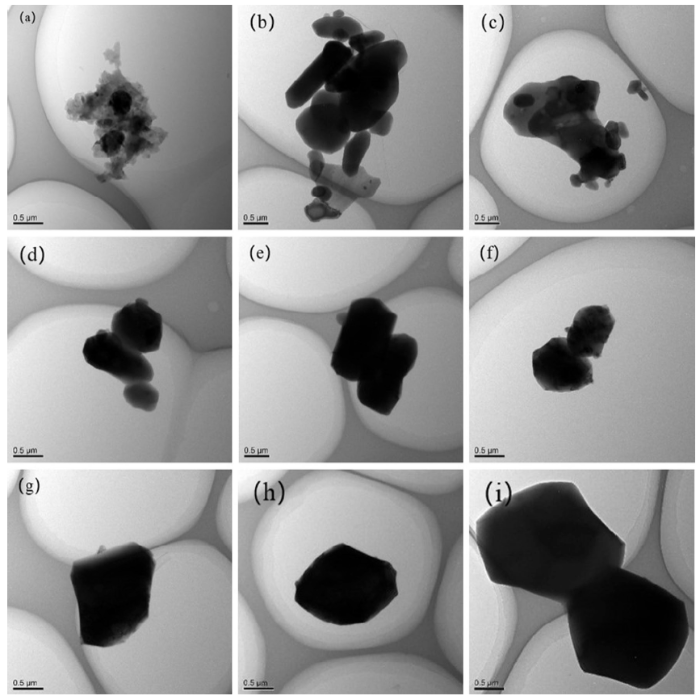
The TEM images of the green body and of the samples sintered at different temperatures are shown in Fig. 6. The particles were observed to transform into regular shapes and become larger as the sintering temperature increased. This could be explained by the fact that the particle transfer motion may occur at the grain boundaries and is rearranged under high temperature. As a result, small particles grow and form large particles. In the sintering process, the surface diffusion took place on the particle surface and the coarsening and densification occurred along with it, which facilitated the borders of the particles to become smooth [37].
Fig. 6 TEM images of the green body and of the samples sintered at different temperatures: a green body; b 1200 °C; c 1250 °C; d 1280 °C; e 1300 °C; f 1350 °C; g 1400 °C; h 1450 °C; i 1500
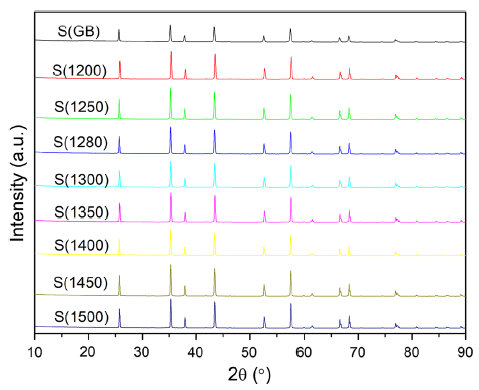
The phase composition acquired from XRD of the green body and of the samples sintered at different temperatures is shown in Fig. 7. The XRD patterns indicate that the sintering temperature did not affect the phase composition and all the samples had the same phase of the α-alumina. The peaks were located at 25.6°, 35.1°, 37.8°, 41.7°, 43.4°, 46.2°, 52.6°, 57.5°, 59.8°, 61.2°, 66.5°, 68.2°, 70.4°, 74.3°, 77.2°, 80.7°, 84.4° and 86.4°, representing the (012), (104), (110), (006), (113), (202), (024), (116), (211), (122), (214), (300), (125), (208), (119), (220), (223), and (312) crystallographic planes of the α-alumina, respectively (PDF#65-3103) [38]. The entire crystal can be viewed as an infinite number of octahedrons [AlO6] formed by coplanar combination of large molecules, which adds stability to α-alumina [39]. These results are consistent with Azarmi et al. [40], who showed the existence of the α-Al2O3 detected in initial printed samples without any change during debinding and sintering processes.
Fig. 7 XRD patterns of the green body and of the samples sintered at different temperatures
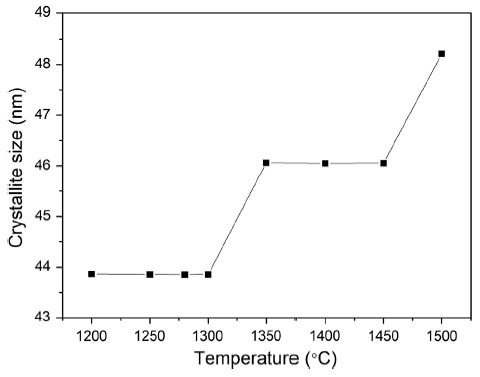
The Al2O3 crystallite size calculated by Scherrer equation from XRD results is shown in Fig. 8. The crystallite size increased from 43.9 to 48.2 nm as the sintering temperature increased from 1200 to 1500 °C. According to the following empirical formula, it is known that the crystallite size increases with the increase in temperature,
$d^{n} - d_{0}^{n} = kt\exp \left( { - \frac{Q}{RT}} \right).$(8)
where \(d\) is the crystallite size after growth (nm), \(d_{0}\) is the initial crystallite size (nm), \(k\) and \(t\) are physical constants related to specific materials. \(R\) is the universal gas constant. \(T\) is the temperature, and \(Q\) is the activation energy.
Fig. 8 Crystallite size of the samples sintered at different sintered temperatures
The increasing trend of the crystallite size is consistent with SEM and TEM characterization results [41].
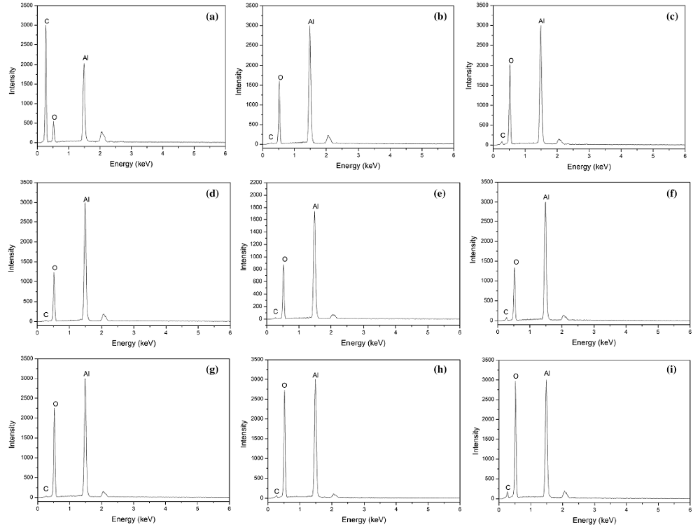
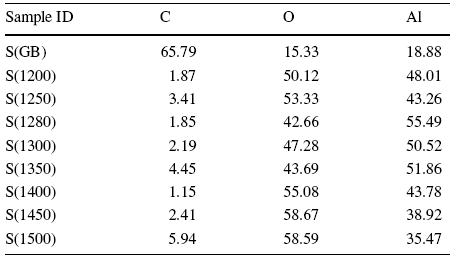
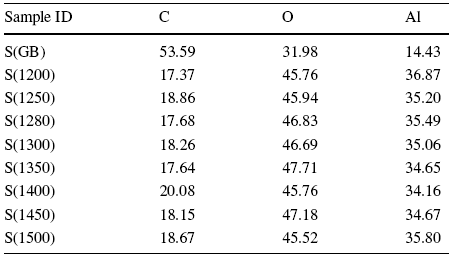
The elemental analysis acquired from EDS shows that all the samples all contained of C, O and Al, as shown in Fig. 9. These results are consistent with the phase composition acquired from XRD. The element contents are shown in Table 2. In the sample of green body, there is much higher C content than those of others because of the photosensitive resin remnants in the sample. After sintering, the C, Al and O contents in different samples do not exhibit large changes. This demonstrates that the sintering temperature only has a minor influence on the elemental composition.
Fig. 9 EDS patterns of the green body and samples sintered at different temperatures: a green body; b 1200 °C; c 1250 °C; d 1280 °C; e 1300 °C; f 1350 °C; g 1400 °C; h 1450 °C; i 1500 °C
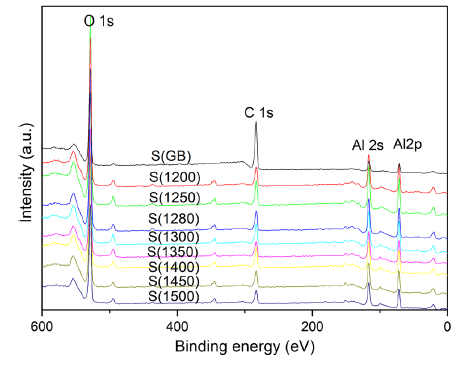
The XPS spectra are shown in Fig. 10, where the binding energies at 527.9 eV, 281.0 eV, 115.7 eV and 71.1 eV represent the O 1s, C 1s, Al 2s and Al 2p, respectively. The element analysis acquired from XPS is shown in Table 3. For the green body, a much higher C content was detected because there was some polymer residue in the sample. This phenomenon was consistent with EDS results. The C, H and Al contents in different samples were almost the same. The O/Al ratio was very close to 1.5 of the theoretical values of Al2O3 [42]. EDS is used to measure the bulk content, while XPS is used to measure the content within 10 nm of the sample surface. Hence, the carbon content of the sample is greatly affected due to the surface pollutants. However, it is observed that the carbon content of the unsintered green sample is significantly higher than that of the sintered sample.
Fig. 10 XPS spectra of the green body and samples sintered at different temperatures
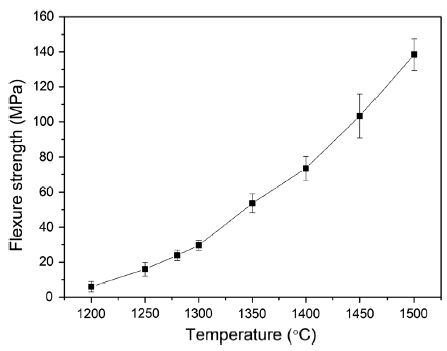
The flexure strength of the samples sintered at different temperatures is shown in Fig. 11. The sample achieved the minimum flexure strength of 6.0 MPa after sintering at 1200 °C. The flexure strength gradually increased with the increase in sintering temperature until it reached a value of 138.5 MPa after sintering at 1500 °C. After sintering at 1280 °C, the flexure strength was 24.0 MPa. Compared with results of Jiang et al. [43], the strength of alumina core sintered at 1300 °C and 1400 °C is 20 MPa and 24.8 MPa, which is slightly lower than our results. Generally, measures such as eliminating large cracks and voids, increasing the relative density, reducing impurities in ceramics, making the crystallite size small and uniform and increasing grain boundary bonding strength serve to improve the flexure strength of the alumina ceramics [44]. The decrease in open porosity and the increase in bulk density with the increasing sintering temperature generate the stronger adhesion among particles which lead to greater flexure strength.
Fig. 11 Flexure strength of the samples sintered at different temperatures
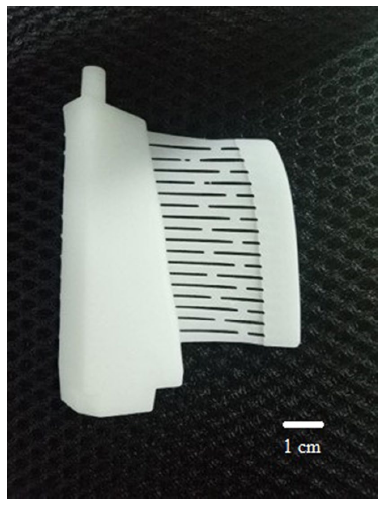
After sintering at 1280 °C, the shrinkage along length, wide and height directions is 2.1%, 2.3% and 3.8%, respectively. The open porosity, water absorption, bulk density, relative density and crystallite size are 37.6%, 15.2%, 2.44 g/cm3, 61.9% and 43.8 nm, respectively. These properties satisfy the material requirements of the ceramic core [45]. Excessive shrinkage and high density are not desirable for directional solidification or single crystal casting of superalloys and eutectic alloys [46]. This is because the shrinkage inhibits the control of the shape and position tolerance of the core. The coefficient of thermal expansion of alumina is lower than that of metal. When molten metal solidifies, the aluminum core with high density and high elastic modulus has strong ability to resist compression deformation. This facilitates the formation of mechanical cracks or thermal tearing of alloy castings. In addition, a higher density leads to lower dissolubility, which makes the core removal more challenging. Therefore, considering that the samples sintered at 1280 °C have appropriate flexure strength (24.0 MPa), sufficient porosity (37.6%) and small shrinkage (2.1% in length, 2.3% in width, 3.8% in height), 1280 °C is the best sintering temperature. The printed alumina ceramic core is shown in Fig. 12.
Fig. 12 Printed alumina ceramic core
The 3D stereolithography printing ceramics technology was developed rapidly in recent years because of its high forming speed, ability to produce complex parts and suitability for small batch production. Since the entire process involves several sophisticated steps such as printing, debinding and sintering, many problems need to be addressed to obtain ceramic parts with complete structure and good surface quality. The effects of sintering temperature on the physical properties, microstructure, composition and mechanical properties of 3D stereolithography printing ceramics were investigated to arrive at a better understanding on the 3D stereolithography printing process.
Physical properties such as shrinkage, open porosity, water absorption, bulk density and relative density indicated that the sintering temperature significantly affected the structural characteristics of alumina ceramics. The shrinkage, bulk density and relative density increased with the increase in sintering temperature, whereas the open porosity and water absorption decreased with the increase in sintering temperature. The shrinkage along the height direction was about twice that of the shrinkage along the length and width. SEM and TEM images showed that with the increase in sintering temperature, the alumina particles underwent gradient changes, and the particles coalesced. XRD curves showed that all samples were composed of α-alumina, and the crystallite size increased with the increase in sintering temperature. The flexure strength increased with the increase in sintering temperature.
Considering the use condition of the core, 1280 °C was found to be the best sintering temperature with the appropriate flexure strength of 24.0 MPa, sufficient porosity of 37.6% and small shrinkage (2.1% in length, 2.3% in width, 3.8% in height).
Acknowledgements This work was financially supported by the National Key Research and Development Program of China (No. 2018YFB1106600), the Chinese National Foundation for Natural Sciences under Contracts (No. 51672217), and the Research Fund of the State Key Laboratory of Solidification Processing (Grant No. 120-TZ-2015).

 WeChat
/
| 〈 |
|
〉 |