

1 Introduction
As engine components' service temperature continuously rises, intermetallic-based superalloys owning better performance have been chosen as prime alternate high-temperature structural materials [1, 2]. Due to their low density, excellent oxidation resistance and favorable thermal conductivity at high temperatures [3], Ni3Al phase becomes the fundamental strengthening phase in Ni-Al series intermetallic-based superalloys [4], which have been successfully developed as cast polycrystalline superalloys [5], single-crystal superalloys [6] and powder metallurgy superalloys [7]. Cast polycrystalline Ni3Al-based superalloys with equiaxed grains or columnar grains have been usually used as blades in different cooling stages of turbine with consideration for its lower costs of replacement and repair [8].
Because of those highlights of application and unique properties mentioned above, Ni3Al-based superalloys have been extensively studied in a number of critical technological areas. Strengthening phase in Ni3Al-based superalloys is designated γ′ with L12-ordered crystal structure. The morphology evolution of primary γ′ is fundamental for its engineering applications of Ni3Al-based alloy [9, 10]. Work-hardening rate [11] and micro-hardness [12] of Ni3Al alloys were found to be significantly influenced by the distribution of γ′ phase. Moreover, the morphology evolution and distribution of primary γ′ were related to the nucleation and growth process. Porter elucidated that distribution of primary γ′ had a close relationship with its nucleation rate in γ matrix [13]. Regarding the growth of primary γ′, it was suggested that morphology evolution mainly changed by elastic strain energy due to rise of lattice misfit [14, 15]. However, the difference in nucleation rate of primary γ′ is not considered in most researches when they investigated the influence of lattice misfit to morphology [13, 16] and few researchers have studied the effect of nucleation rate on γ′ phase distribution during subsequent cooling process [17, 18].
Moreover, solution and aging treatments can also effectively enhance its mechanical properties [19]. Transition of precipitated phases (e.g., γ′ and carbides) is accomplished by nucleation and growth processes. Dimension and morphology of primary γ′ are more complicated for multiple precipitated phases (e.g., directional mushroom-like γ′ [20], carbon-rich intermetallics [21] and β phase with L10 structure [22]). Some of the mentioned phases are sensitive to temperature and conducting diverse transformation during heat treatment, especially under different solution cooling rates [23, 24]. Wu et al. [24] investigated the effect of cooling rate on the unstable phase (β) in polycrystalline Ni3Al-based superalloy; they found that the precipitation behavior was significantly impacted by cooling rate, leading to the configuration of nanotwins with interior stacking faults in β and the evolution of primary γ′ morphology. However, the mentioned phenomena are not fully investigated. Subsequently, clarifying the nucleation mechanism of primary γ′ and morphology evolution is critical to regulate its thermal stability and mechanical properties of the superalloy.
In the present study, a newly designed Ni3Al-based superalloy that belongs to IC396 series was used to explain the evolution of primary γ′ during high-temperature solid solution and subsequent cooling process. Besides, three different cooling conditions (furnace cooling (FC), air cooling (AC) and water cooling (WC)) were employed. Morphology of primary γ′, lattice misfit between primary γ′ and γ, shape parameter ratio and deconvolution of diffraction peaks were adopted to evaluate the evolution behavior of primary γ′. Moreover, morphology evolution and phase transformation mechanism corresponding to elastic strain energy and shape instability were also explained.
2 Experimental
Vacuum induction melting and electroslag remelting were conducted to prepare the Ni3Al-based alloy ingot with the chemical composition of 70.82Ni-0.08C-8.9Al-7.6Cr-11.7Fe-0.9Hf (wt%). The diameter and height of the as-cast ingot were 150 mm and 68 mm, respectively. To ensure the chemical composition uniformity, nine specimens were cut into cylinders with the dimensions of φ8 mm×10 mm with an electric spark cutting machine at the identical one-half radius of the ingot. All of the specimens were subjected to a solid solution heat treatment at 1270±1 °C for 9 h in a SX-G0413 electric furnace followed by water cooling (WC, 230-250 °C/s), air cooling (AC, 60-70 °C/s) and furnace cooling (FC, 0.05-0.06 °C/s), separately. Specimens for WC were placed in ice water. The temperature for AC was 20±1 °C. FC process began with turning off the furnace, and specimens were cooled in the furnace until 20±1 °C.
Typical metallographic preparation method was used for optical microscopy (OM) and scanning electron microscopy (SEM) observation. OM equipped with OLYCIA M3 analysis system was used to investigate the microstructure of the specimens etched with Nimonic solution. Hitachi S-4800 scanning electron microscope equipped with energy-dispersive spectroscopy (EDS) was used to analyze the element distribution. An area of 5 μm×5 μm was selected to determine the number, volume fraction and particle length of primary γ′. X-ray diffraction (XRD) was conducted with CuKα radiation using D8 Advance diffractometer under an operating voltage of 40 kV. Diffraction peaks of γ′ and γ were determined by deconvolution with Pseudo-VoigtA fitting function in Fityk peak analysis program that owned the best R2 value. JEM-2100F with an accelerating voltage of 200 kV was used for transmission electron microscopy (TEM) tests. Specimens for TEM were prepared by electrolytic double spray using MTP-1A twin-jet electropolisher with etchant (95% C2H5OH+5% HClO4) at -30±1 °C. The observation direction of TEM test was parallel to the [11-2] and [-110] zone axis.
3 Results
3.1 Microstructure of γ′ in FC, AC and WC
The microstructure of the as-cast alloy has been elucidated in our previous study [20]. For FC specimen, it is mainly composed of the dual-phase zone (γ′+γ) and the eutectic zone (γ′-γ) (Fig. 1a). The eutectic zone is slender and mostly has sharp edges. The dual-phase zone exhibits larger volume fraction compared with eutectic zone. In (γ′+γ) zone, concave cuboidal primary γ′ exhibits large volume fraction and secondary spherical γ′ (Fig. 1b, c) presents at the center of γ channel away from the interface of γ and primary γ′. Most primary γ′ presents concave cube and a handful of splitting primary γ′ appears, and splitting exists at the center of γ′ edge (Fig. 1b). Besides, it can be found that the average size of primary γ′ is significantly larger than secondary γ′ through the inserted magnitude image in Fig. 1c. Inserted selected area electron diffraction (SAED) image clearly shows the diffraction spots of γ′. Moreover, it can be observed that the NR of secondary γ′ is much higher than that of primary γ′. Under higher magnification (Fig. 1d), dislocations were observed around the split concave γ′. HRTEM image of γ channel (Fig. 1e) was observed along [-110] zone axis (as shown in the inserted image). IFFT was performed to obtain the atomic arrangement around the dislocation in the red outline region (Fig. 1e) and two extra planes of atoms present, as marked by yellow dashed frame in Fig. 1f.
Fig. 1

Fig. 1
Microstructures of FC specimens: a OM image; b primary γ′ and secondary γ′ in dual-phase zone observed by SEM; c primary γ′ and secondary γ′ observed by TEM, the inserted images show magnitude image of primary γ′ and secondary γ′ of red outline region and the SAED image of primary γ′ along [11-2] zone axis; d split primary γ′ and dislocations around split primary γ′ (TEM); e HRTEM image of the red outline region in d along [-110] zone axis; the inserted image shows the FFT image of red outline region; f IFFT image (extra atomic planes marked by yellow dashed frame) of the red outline region in e
For AC specimens, eutectic zone is smooth, and almost no sharp corners appear. The dual-phase zone dominates the alloy (Fig. 2a) and primary γ′ presents as cuboidal shape in the dual-phase zone (Fig. 2b). Moreover, dimension of cuboidal primary γ′ is smaller than that of the primary γ′ under FC conditions (Fig. 1b), and split concave primary γ′ and dislocations were barely observed (Fig. 2c). Besides, almost no secondary γ′ could be identified in the γ channels (Fig. 2b-d).
Fig. 2

Fig. 2
Microstructures of AC specimens: a OM image; b primary γ′ in dual-phase zone observed by SEM; c primary γ′ observed by TEM; d γ channel of red outline region in c
For the WC specimens, the eutectic zone owns smooth shape with no sharp corners (Fig. 3a). In the dual-phase zone, primary γ′ presents as near-spherical morphology (Fig. 3b, c) with its dimension smaller than that of FC and AC specimens. Concave γ′ and splitting primary γ′ were also not found. Moreover, almost no secondary γ′ could be found in γ channels (Fig. 3d) though vacancies appear under higher magnification (Fig. 3e), which were not observed in the FC and AC specimens.
Fig. 3

Fig. 3
Microstructures of WC specimens: a OM image; b primary γ′ in dual-phase zone observed by SEM; c primary γ′ observed by TEM; d magnitude image of γ channel between primary γ′ in c; e vacancies observed by HRTEM
As described above, the difference in primary γ′ number is obvious under different cooling conditions (Figs. 1b, 2b, 3b). To elucidate the difference, nucleation rate (NR) of primary γ′ was proposed. Overall, NR is characterized by the number of precipitates within unit area [25]. Figure 4 shows the number and average particle length of primary γ′ within an area of 5 μm×5 μm. The number of the WC, AC and FC specimens is 5504.5, 663 and 59.25, respectively, suggesting that NR gradually increases with the increase in the cooling rate. Moreover, volume fraction of primary γ′ is 76.39%, 73.07% and 65.43% for the WC, AC and FC specimens, respectively. However, the average particle length presents an opposite trend of 59.4 nm, 169.94 nm and 552.26 nm for WC, AC and FC specimens, respectively.
Fig. 4

Fig. 4
Primary γ′ number and particle length (within an area of 5 μm×5 μm) under different cooling conditions
3.2 Shape Evolution of Primary γ′
Shape evolution can be analyzed with different methods (e.g., software simulation [14], element distribution by EDS [26], depiction by equations [27, 28] and visual description [29, 30]). To explain the shape evolution more precisely, the shape parameter ratio was used [31]. As described above, primary γ′ with different shapes under FC, AC and WC conditions was observed, and primary γ′ shape should be quantitatively described. The shape parameter ratio [28] can be described as
where a represents edge length of a square from the intersection of dotted lines and b represents the actual length of γ′ measured horizontally and vertically as shown in Fig. 5c. However, Eq. (1) is limited for η1≤1 and not suitable for primary γ′ morphology. For FC and AC specimens, almost all primary γ′ corners protrude into γ matrix (Figs. 1b, 2c), and the value of a in Eq. (1) could not be obtained. Thus, Eq. (1) cannot determine the primary γ′ features in FC and AC specimens. A new equation is proposed to further characterize the evolution and explain the protruding degree of the corners, as expressed below:
Fig. 5

Fig. 5
a Shape parameter ratio of a spherical primary γ′ in WC; b shape parameter ratio of a concave cuboidal primary γ′ in FC; c shape parameter ratio η1 increase with the shape transformation; d shape parameter ratio η2 increases with the shape transformation
As depicted by dotted lines in Fig. 5d, c represents the length parallel to the edge line between adjacent vertices horizontally and vertically. d represents the edge length of a square, as achieved by line tangent to the boundary measured horizontally and vertically.
Equation (2) fits shape characterization since it can clearly determine the shapes of variety primary γ′ in FC and AC specimens. Moreover, in Eq. (1), when a increases to be equal to b, the shape of primary γ′ is cube, which is the same as described for c=d in Eq. (2). Besides, Eq. (2) can be used together with Eq. (1) to interpret the shape evolution among three cooling processes. When η1<1, it can be considered that γ′ has only a cuboidal shape with round corners; when η2>1, it can be considered that the cuboidal shape already exhibits a concave shape. Thus, as depicted in Fig. 5b, η2 increases with the distance between primary γ′ corners protruding into γ matrix. η1 of WC is 0.23 (average value of 100-150 primary γ′). Subsequently, Eq. (1) can be used for primary γ′ under WC condition, and Eq. (2) can be applied for primary γ′ under FC and AC conditions. η2 of FC and AC is 1.31 and 1.12, respectively (Table 1). Moreover, η1 was calculated to characterize the development of primary γ′, and all the results were lower than 0.8, suggesting that primary γ′ is close to a cube with round corners.
Table 1 Shape parameter, lattice parameter (γ′ and γ) and lattice misfit of different cooling rates
| Cooling mode | Furnace cooling | Air cooling | Water cooling |
|---|---|---|---|
| Shape parameter ratio | η2=1.31 | η2=1.12 | η1=0.23 |
| Volume fraction of primary γ′ | 0.6543 | 0.7307 | 0.7639 |
| $\alpha_{{\gamma^{\prime } }}$ (nm) | 0.3624554 | 0.3605634 | 0.3610417 |
| αγ (nm) | 0.3686276 | 0.3634221 | 0.359983 |
| Lattice misfit (δ) | -0.016744 | -0.007866 | 0.002941 |
3.3 Lattice Misfit of FC, AC and WC
3.3.1 XRD Results Analysis
Figure 6 shows the XRD diffraction results of the specimens with different cooling rates. Since the volume fraction of primary γ′ is higher, and γ′ is coherent with γ, diffraction peaks of primary γ′ and γ will be very close [30, 32, 33]. As shown in Fig. 6a, the diffraction peak of primary γ′ and γ is overlapping. It is necessary to deconvolute to work out the lattice misfit difference, and the deconvolution peak profiles of primary γ′ and γ under different conditions in (200) direction are shown in Fig. 6b-d, respectively. Interplanar spacing (σ) can be calculated by diffraction angle in deconvolution peak profile, and peak intensities represent the volume fraction of primary γ′ and γ phases [34]. As described in Sect. 3.1, volume fraction of primary γ′ is much higher than that of γ under the three conditions. Under WC condition, low-angle peak intensity is larger than that of high-angle peak, suggesting that lower angle peak represents primary γ′, and higher angle peak represents γ (Fig. 6b). Under FC and AC conditions, the intensity of higher angle peak is larger than that of lower angle peak, suggesting that higher angle peak represents primary γ′ and lower angle peak represents γ (Fig. 6c, d). The interplanar spacing can be calculated by θ and λ. The result is derived from Eq. (3)
Fig. 6
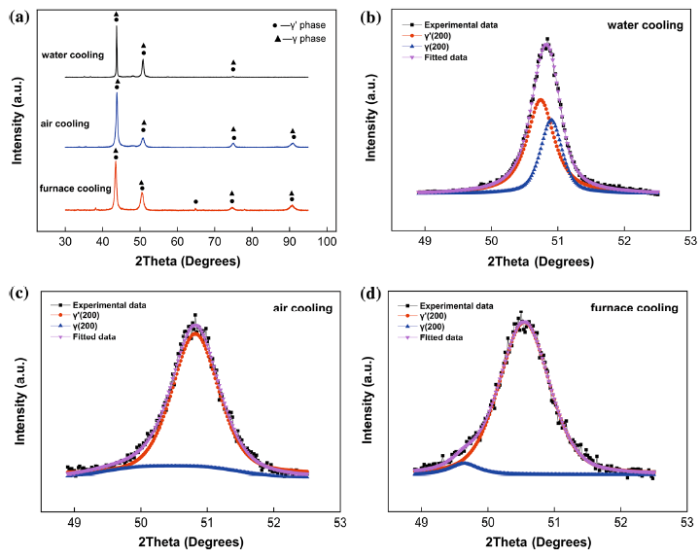
Fig. 6
XRD results of WC, AC and FC specimens: a identification of γ′ and γ; γ/γ′ (200) deconvolution diffraction peak of WC b, AC c and FC d using Pseudo-VoigtA as fitting function
where θ is diffraction angle; λ is wave length of X-ray equipped with CuKα radiation (λ=0.154718 nm). Because $\sigma_{200} = 0.5\sigma_{100}$, the interplanar spacing related to (100) (i.e., lattice parameter) and lattice misfit (δ) are listed in Table 1. Lattice misfit (δ) is critical to measure coherent distortion, which can be depicted by Eq. (4)
where $\alpha_{{\gamma^{{\prime }} }}$ and αγ are lattice parameter of γ′ and γ, respectively [13]. Obviously, positive misfit reflects the result of $\alpha_{{\gamma^{\prime } }} > \alpha_{\gamma }$, and negative misfit is obtained in a situation of larger αγ. As calculated by Eq. (4), the lattice parameter of γ (αγ) is lower than $\alpha_{{\gamma^{\prime } }}$ under WC condition, and lattice misfit is positive. Under AC and FC conditions, lattice parameter of γ (αγ) becomes larger than $\alpha_{{\gamma^{\prime } }}$, indicating that the lattice misfits are negative. Absolute value of γ′/γ misfit under FC condition is the largest, and with the increase in the cooling rate, misfit drops (Table 1), indicating that the interplanar spacing of the precipitation and the matrix became closer with the increase in the cooling rate.
3.3.2 HRTEM Results Analysis
Overall, it is desirable to obtain cuboidal γ′ which exhibits the highest creep resistance [35]. It has been proved that the hot compression deformation behavior of Ni3Al-based superalloy depends on the coarsening rate of cuboidal γ′ [19, 36] and the different γ′ shapes lead to stress redistribution at the corners and edges [27, 37]. As described above, high volume fraction of cuboidal γ′ formed in the dual-phase zone of AC specimens and the stress around the corners and edges may vary. Typical edges and corners of primary γ′ in AC specimens are magnified (Fig. 7a). Figure 7b and c illustrates the edge regions and corner regions of primary γ′, respectively.
Fig. 7
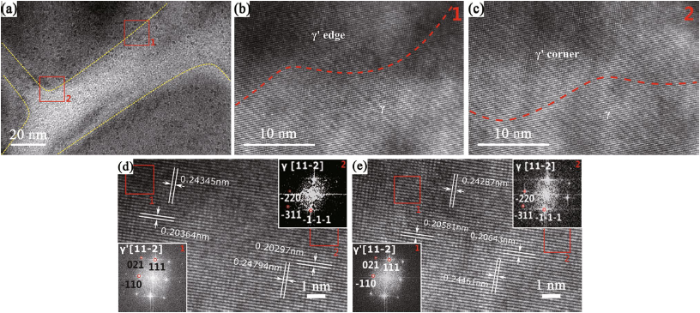
Fig. 7
a Primary γ′ observed by TEM under AC condition; b area between γ′ edge and γ of HRTEM image; c area between γ′ corner and γ of HRTEM image; d area between primary γ′ and γ in corner area in AC, the inserted images show the FFT image γ′ and γ; e area between primary γ′ and γ in edge area in AC; the inserted images show the FFT image γ′ and γ
From HRTEM images (Fig. 7d, e), interplanar spacings of γ matrix related to primary γ′ under AC condition were calculated by FFT. Ten different locations (as represented by the red box in Fig. 7d, e) were taken to calculate the interplanar spacings of (110) and (111) planes along [11-2] zone axis. According to the L12 lattice structure of γ′ and γ ($\sigma = \frac{\alpha }{{\sqrt {h^{2} + k^{2} + l^{2} } }},$, (hkl—Miller indices)) [38], the relation among (100), (110) and (111) interplanar spacings can be expressed as
Then σ(100) (i.e., lattice parameter) of corner and edge area in primary γ′ could be reckoned. According to the results of lattice parameter and Eq. (3), lattice misfit between primary γ′ and γ in corner area and edge area is -0.02597 and -0.00799, respectively, suggesting that the absolute value of misfit in primary γ′ corner area is larger than that of the edge area.
As shown in Fig. 8a, EDS analysis of line profile under FC condition is presented along the diagonal path of primary γ′ and adjacent γ matrix (AB). The inserted image shows the concentration of Ni, Al, Cr and Fe along AB. Under the shape parameter (η2) of primary γ′ of 1.31 (Table 1), the part outside the yellow dotted square box with η2=1 can be considered the corner of concave primary γ′. As revealed from the concentration results, the middle part owns higher Al content. As the distance gets closer to the corner, the concentration of Cr and Fe is higher than that of Al element. The distribution of Ni element is uniform. In the concave primary γ′ (Fig. 8b), concentrations of Al, Cr and Fe elements along diagonal path of the yellow dotted square (CD) are uniform. The concentration of Al element decreases with the distance getting closer to the corner. Furthermore, the concentration of Cr and Fe elements increased, suggesting that Cr and Fe elements tend to concentrate in primary γ′ corners with a concave shape.
Fig. 8

Fig. 8
a EDS along the diagonal path of primary γ′ and adjacent γ matrix in FC; the inserted image is the concentration of Ni, Al, Cr, and Fe along AB; b concentration of Ni, Al, Cr, and Fe (EDS line profile) corresponding to diagonal path in a
4 Discussion
4.1 Effect of Cooling Rate on Nucleation of Primary γ′
As shown in our previous work, in Ni3Al-based superalloy γ matrix with γ′ particles first segregates from melt, forming the dendrites and eutectic zone (γ′-γ) [39]. However, solidification of Ni-based superalloy shows that only γ solid solution exists in dendrites [40], and transformation in the remaining liquid is complicated [41]. The increase in the solidification cooling rate can increase the nucleation of γ-phase solid solution [40]. Furthermore, the cooling rate after solid solution treatment is also important for γ′ phase. Under WC, AC and FC conditions, γ′ nucleus forms as a tiny particle. Total free energy change during nucleation is described as Eq. (6)
where ΔGT is total free energy change; V is the volume of precipitation; ΔGV is the reduction in volume free energy per unit volume; A is the area of precipitation surface; μ is the increase in surface energy per unit area; and ΔGE is the increase in elastic strain energy per unit volume [13]. To form a stable nucleation, ΔGT should be negative. Since volumetric contribution $\left[ {V\left( { - \Delta G_{\text{V}} + \Delta G_{\text{E}} } \right)} \right]$ tends to decrease the total free energy and surface contribution (Aμ) is positive, leading to the increase in total free energy, the system will seek to minimize the amount of surface area per unit volume (i.e., A/V) [42]. Thus, during nucleation process, A/V (surface area/volume ratio) of the nucleus should be small to get a negative ΔGT. As spherical particles have the minimum A/V, nucleated morphology presents as a sphere.
Undercooling (ΔT) and supersaturation (ΔC) are two dominated factors which affect the driving force of nucleation [13]. Undercooling can be described as Eq. (7):
where Ts is solid solution temperature and Tp is the precipitation temperature of γ′. Supersaturation can be defined as Eq. (8)
where Cγ is the solute concentration in γ region away from γ′ and Ci is the solute concentration in the interface region of γ adjacent to γ′. On the whole, Ci is constant [43]. According to the effect of ∆C upon the nucleation of γ′ [43, 44], NR [nucleation rate, Eq. (9)] was used to determine bimodal particle distribution:
where ρ1 and ρ2 are constants for transformation kinetics. Equation (9) expresses NR∝ΔC. Based on the free energy function, concentration profile and phase-field model during nucleation, NR will influence the subsequent morphology evolution by changing ΔC in matrix [45]. It is proved that primary γ′ nucleation increases with the rise in ΔC, and morphology evolution tends to be in apparent with lower ΔC during subsequent growth.
To elucidate the effect of ΔT and ΔC on NR under different cooling rates, FC (Fig. 9a, b), AC (Fig. 9c, d) and WC (Fig. 9e, f) specimens are schematically exhibited. For concise explanation, cooling rate is assumed constant and undercooling for nucleation of primary γ′ and secondary γ′ is equable. Figure 9a, c, e shows the temperature of FC, AC and WC as a function of time (t) and concentration (C), respectively. The X-axis at the top of these figures shows the concentration of the solute in γ matrix, and unit scale increases with decreasing solute concentration. The X-axis at the bottom of these figures shows the cooling time. Figure 9b, d and f shows the temperature of FC, AC and WC as a function of NR, respectively. The X-axis of these figures shows the nucleation rate. The Y-axis of the above six figures shows the temperature (T).
Fig. 9

Fig. 9
a, c, e Temperature as a function of time (t) and concentration (C); b, d, f temperature as a function of nucleation rate (NR)
Based on our previous work [46], γ′ dissolved and the alloy reached a homogenization state after solid solution at 1270 °C for 9 h. For FC, specimens were solution treated at T1 (1270 °C) with concentration C1 (Fig. 9a) and then cooled with a slow cooling rate to T2 (i.e., undercooling raises ΔT1). ΔT1 corresponds to the minimum nucleation driving force, and primary γ′ starts to precipitate from γ matrix. It is suggested that undercooling decreases with the dropping of cooling rate [47]. Thus, the minimum undercooling for primary γ′ nucleation occurs during FC treatment, resulting in minimum NR, revealing that NR∝ΔT. Since NR first rises with the increase in undercooling (i.e., NR∝ΔT) and decreases in subsequent temperature reduction by soft impingement [13], NR of primary γ′ reaches maximum at intermediate undercooling as shown in Fig. 9b.
After the nucleation process, primary γ′ starts to grow. As the subsequent nucleation of primary γ′ and growth of primary γ′ prior nucleated were performed simultaneously, subsequent nucleation of primary γ′ is strongly influenced by growth rate of primary γ′ prior nucleated [44] and the growth rate can be defined as Eq. (10)
where $L_{{\gamma^{\prime } }}$ is γ′ average length, ΔC is supersaturation, De is diffusion coefficient and tg is the growth time of γ′. As the nucleus forms as a sphere, growth rate of the sphere in different locations is the same [44]. Nucleation of primary γ′ stops and growth of primary γ′ slows down as a result of the appearance of overlapping of two adjacent γ′ diffusion fields [13] (i.e., soft impingement [48]). Growth time of primary γ′ during FC treatment is the longest because of the lowest cooling rate, which causes a sufficient growth of primary γ′. As the concentration of Al solute (($C_{1}^{\gamma } ) \downarrow$) is consumed continuously, supersaturation ($\left( {C_{1}^{\gamma } - C^{i} } \right) \downarrow$) of γ matrix near interface region decreases according to Eq. (8). When the temperature continues to decrease, diffusion coefficient of atoms becomes smaller [49, 50]. According to Eq. (10), the growth rate drops, and the growth of primary γ′ stops finally due to the formation of soft impingement.
As discussed above, nucleation of primary γ′ and reduction in supersaturation stop at T3. Subsequently, the supersaturation between the two adjacent γ′ starts rising as the temperature decreases [51] and eventually surpasses the critical supersaturation ΔC2 for nucleation of secondary γ′. Moreover, the concentration of Al solute in the interface region of γ adjacent to γ′ (Ci) is constant. Though the supersaturation ($(C_{1}^{\gamma } - C^{i} ) \downarrow$) of γ matrix near interface region decreases, the supersaturation of γ matrix away from the interface $\left( {C_{2}^{\gamma } - C^{i} } \right)$ is still unchanged because the concentration of Al solute at the center of γ channel ($C_{2}^{\gamma } )$ remains stable. Subsequently, secondary γ′ nucleates in γ channel away from the interface (Fig. 1c) at T4 when undercooling reaches ΔT2. Since $\Delta T_{2} = \Delta T_{1} ,{\text{NR}} \propto \Delta C$ and the density of secondary γ′ is higher than that of primary γ′ (Fig. 1d), demonstrating that $\Delta C_{2} > \Delta C_{1}$ (Fig. 9a). At lower temperature, atomic diffusion is slower [52], which consequently takes a longer time to reach soft impingement state, i.e., nucleation period of secondary γ′ is wider than primary γ′ (Fig. 9b). NR of secondary γ′ gradually increases as the ΔT increases just like the rise of primary γ′ NR.
For AC specimens, with intermediate cooling rate, the maximum NR is higher than that in FC specimens for higher ΔT related to higher cooling rate. Besides, with NR increasing, more γ′ will form which will consume more Al atoms and reduce ΔC. The nucleation temperature of AC is lower than that of FC, which will cause the decrease in diffusion coefficient of Al element. According to Eq. (10), the growth rate of primary γ′ under AC condition is lower than that of FC, leading to a lower increase of primary γ′ composition. Soft impingement appears at lower temperature, and nucleation and growth of primary γ′ stop (Fig. 9d). However, slow migration of atoms at low temperature does not allow secondary γ′ to desolate from the γ matrix [52, 53] and even ΔT and ΔC for secondary γ′ have reached, so the secondary γ′ was not observed (Fig. 2d).
Under WC condition, ΔT and ΔC are extraordinarily sufficient for burst of primary γ′ nucleation due to higher cooling rate. The growth rate of primary γ′ is the lowest as a result of largest NR and lowest nucleation temperature, suggesting that the increase in primary γ′ composition is the lowest under WC condition. Though ΔT and ΔC for secondary γ′ nucleation are enough after the appearance of soft impingement, migration of atoms is too slow for secondary γ′ desolating from the matrix (Fig. 3d).
4.2 Effect of Cooling Rate on Growth
4.2.1 Effect of Cooling Rate on Lattice Misfit
The lattice misfit of γ′ and γ in (200) direction obtained by deconvolution of XRD refers to the sum of unconstrained lattice misfit and elastic coherency strain misfit [54, 55]. The definition and relationship between lattice misfit and unconstrained lattice misfit can be defined as follows Eq. (11):
where εe is the elastic coherency strain misfit and ε is the unconstrained lattice misfit [54]. On the whole, γ′ and γ will be stressed by opposite forces after formation of γ′ (Fig. 10b, j). However, under stress-free state, γ′ lattice parameter is termed as unconstrained lattice parameter of γ′ ($\alpha_{{{\text{unconstrained}} - \gamma^{{\prime }} }}$), which is higher than actual γ′ parameter ($\alpha_{{\gamma^{\prime } }}$) (Fig. 10k). As described in the literature [13], unconstrained lattice misfit can be defined as Eq. (12):
where $\alpha_{{{\text{unconstrained}} - \gamma^{\prime}}}$ is lattice parameter of γ′ under stress-free state and αγ is lattice parameter of γ.
Fig. 10
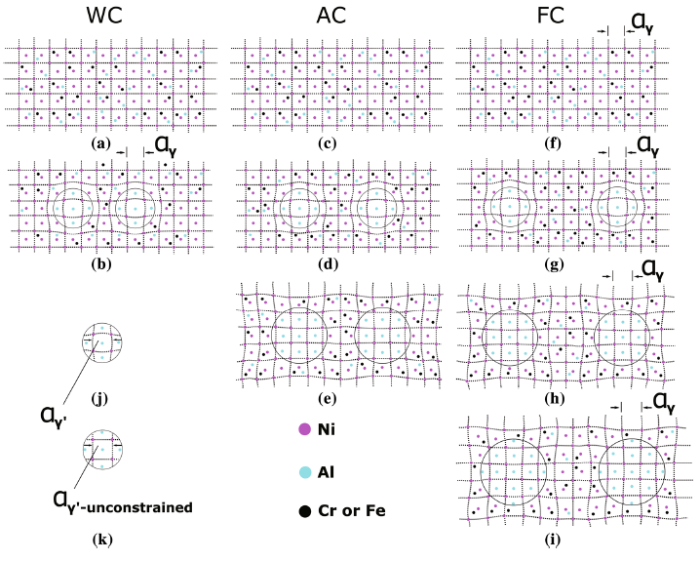
Fig. 10
Schematic diagrams of lattice parameter evolution of primary γ′ and γ under three different cooling conditions: a, c, f lattice parameter of γ under solid solution state; b lattice parameter of primary γ′ and γ during growth under WC condition; d, e lattice parameter of primary γ′ and γ during growth under AC condition; g-i lattice parameter of primary γ′ and γ during growth under FC condition; j lattice parameter of primary γ′; k unconstrained lattice parameter of primary γ′
Moreover, unconstrained lattice misfit (ε) can be calculated by lattice misfit (δ). Since stress forces make the lattice parameters of γ′ and γ closer, absolute lattice misfit should be lower than unconstrained lattice misfit (i.e., $\left| \delta \right| < \left| \varepsilon \right|$). By investigating the effect of lattice misfit on unconstrained coherent strain in different cooling processes [55], ε can be deprived by δ and defined as Eq. (13):
where GR is shear modulus of γ and κ is the bulk modulus of γ′. For an anisotropic material system, GR can be expressed as Eq. (14):
where c11, c12 and c44 are cubic elastic constants [55]. Using anisotropy elastic constant of Ni3Al [56], it can be calculated that $\left| \varepsilon \right| < \left| {2\delta } \right|$. Therefore, $\left| \delta \right| < \left| \varepsilon \right| < \left| {2\delta } \right|$. According to the lattice misfits of three cooling conditions calculated by XRD (Table 1), lattice misfit between spherical primary γ′ and γ under WC condition is positive, and the absolute value reaches the smallest. However, the misfit of AC and FC specimens is negative, and the absolute value of FC specimens is higher than that of AC specimens. As the cooling rate decreases, lattice parameter of γ is smaller than that of primary γ′. Hence, for WC and AC specimens, $\left| {\delta_{\text{WC}} } \right| < \left| {\varepsilon_{\text{WC}} } \right| < \left| {2\delta_{\text{WC}} } \right|$ and $\left| {\delta_{\text{AC}} } \right| < \left| {\varepsilon_{\text{AC}} } \right| < \left| {2\delta_{\text{AC}} } \right|$. As suggested from the statistics results (Table 1), $\left| {2\delta_{\text{WC}} } \right| < \left| {\delta_{\text{AC}} } \right|$ and $\left| {\varepsilon_{\text{WC}} } \right| < \left| {\varepsilon_{\text{AC}} } \right|$ because the absolute value of δ and ε decreases with the increase in the cooling rate (Table 1).
For a certain alloy, ε only depends on composition and thermal expansion coefficient of γ′ and γ [57]. Thermal expansion coefficient of γ′ and γ at different temperatures can change ε by influencing the difference between $\alpha_{{{\text{unconstrained}} - \gamma^{\prime}}}$ and $\alpha_{{\gamma }}$ [58, 59]. Under WC, AC and FC conditions, compositions of γ′ and γ can be changed by NR and nucleation temperature. As can be seen in schematic diagrams of evolution of $\alpha_{{{\text{unconstrained}} - \gamma^{\prime}}} ,\alpha_{{\gamma }}$ and ε, under solid solution state (Fig. 10a, c, f), Al, Cr and Fe dissolve into γ matrix. The distance between the two nucleuses (Fig. 10b, d, g) is used to describe NR, and the distance is closest under WC condition (Fig. 10b) due to the highest NR. Because of stronger connection force due to long-range order structure, primary γ′ owns smaller thermal expansion coefficient than γ [60]. Thus, $\alpha_{{{\text{unconstrained}} - \gamma^{\prime}}}$ maintains a stable value with primary γ′ growing and γ lattice parameter increasing. Due to fast cooling rate of WC, primary γ′ grows slightly. Lattice parameter of γ increases little, which makes $\left| {\varepsilon_{\text{WC}} } \right|$ less than that of initial nucleated state. Subsequently, as $\left| \delta \right| < \left| \varepsilon \right|$ and $\delta_{\text{WC}} > 0$, ε at nucleation state is positive which shows that $\alpha_{{{\text{unconstrained}} - \gamma^{\prime}}}$ is higher than $\alpha_{{\gamma }}$ when γ′ nucleated from γ (Fig. 10b, d, g, k). Moreover, primary γ′ is stressed in tension (Fig. 10b) because of a positive ε. Under AC condition, nucleation temperature of primary γ′ would increase as cooling rate decreases, leading to the increase in Al, Cr and Fe elements diffusion coefficient [61], which makes more Cr and Fe atoms diffuse into γ to expand their lattice parameter during primary γ′ growth, so that $\alpha_{{\gamma }}$ continuously increases and becomes larger than $\alpha_{{{\text{unconstrained}} - \gamma^{\prime}}}$ (Fig. 10e, h, k). Thus, ε changes from positive to negative and $\left| {\varepsilon_{\text{WC}} } \right| < \left| {\varepsilon_{\text{AC}} } \right|$. For FC specimens, $\left| {\varepsilon_{\text{FC}} } \right|$ is higher than $\left| {\varepsilon_{\text{AC}} } \right|$ due to larger expansion of γ lattice parameter caused by higher thermal expansion coefficient of γ′. Moreover, nucleation temperature related to the largest element diffusion coefficient is the highest, resulting in the maximum of γ lattice parameter in FC specimens. Under AC and FC conditions, primary γ′ is stressed from tension to compression as $\alpha_{{\gamma }}$ becomes larger than $\alpha_{{{\text{unconstrained}} - \gamma^{\prime}}}$ (Fig. 10i, k). However, because the large number of fine γ′ phases contains a significant amount of γ′-forming elements, higher NR can increase |ε| [56], revealing that specimens under WC condition tend to own the highest |ε|. As calculated and discussed above, the results of $\left| {\varepsilon_{\text{WC}} } \right| < \left| {\varepsilon_{\text{AC}} } \right| < \left| {\varepsilon_{\text{FC}} } \right|$ were obtained, indicating that thermal expansion coefficient and diffusion coefficient dominate the evolution of ε during cooling process.
4.2.2 Spherical γ′→Cuboidal γ′ Evolution Under AC and FC Conditions
Spherical, cuboidal and concave primary γ′ present in WC, AC and FC specimens, respectively (Figs. 1b, 2b, 3b), indicating that the morphology of primary γ′ will change according to the cooling rate. During heat treatment process [26, 27], morphology of γ′ depends not only on NR but also on lattice misfit related to elastic strain energy [62,63,64,65]. Elastic strain energy is strongly dominated by unconstrained lattice misfit along the interfaces between γ′ and γ [13, 66]. By considering the influence of both unconstrained lattice misfits on the shape of γ′ [66], $\Delta G_{\text{E}}$ can be described by Eq. (15)
where ε is unconstrained lattice misfit, I1 and I2 are parameters depending on shape evolution and Δ is anisotropy factor which can be expressed as $\Delta = c_{11} - c_{12} - 2c_{44}$.
where r is the radius of spherical primary γ′ and the total free energy change of a cuboidal primary γ′ with the same volume becomes
It is suggested that shape evolution progress is stable during growth and volume free energy per unit volume (ΔGV) during the transition of spherical γ′ to cuboidal γ′ can reasonably remain constant [69]. Besides, based on the I1 and I2 of sphere and cube [13] and anisotropy elastic constant of Ni3Al (γ′) and Ni (γ) [60], the absolute value of shape contribution $\left( {\left| { - I_{1} \Delta - \frac{{4.5I_{2} \Delta }}{{c_{11} + 2c_{12} + 4c_{44} }}} \right|} \right)$ of a sphere (SCsph) is higher than that of a cube (SCcub) with the same volume. The difference between them increases with increasing primary γ′ radius [70]. From Eqs. (16) and (17), as surface contribution of cube $\left( {4\sqrt[3]{{6\pi^{2} }}r^{2} \mu } \right)$ is higher than sphere $\left( {4\pi r^{2} \mu } \right)$, it is concluded that spherical primary γ′ owns lower total free energy at the initial stage. As the radius (r) becomes larger, the difference in volumetric contribution between cube and sphere $\frac{4}{3}\pi r^{3} \left[ {6\varepsilon^{2} \left( {c_{11} + 2c_{12} } \right)\frac{{c_{11} + 2c_{12} }}{{c_{11} \left( {c_{11} + c_{12} + 2c_{44} } \right)}}(SC_{\text{cub}} - SC_{\text{sph}} } \right)]\}$ is higher than the difference in surface contribution $\left[ {\left| {\left( {4\sqrt[3]{{6\pi^{2} }}r^{2} \mu } \right) - \left( {4\pi r^{2} \mu } \right)} \right|} \right]$; then, the total free energy of sphere becomes higher than cube. As shown in Fig. 3b, c, and according to the shape parameter (η1) of primary γ′ (Table 1), primary γ′ presents as a near sphere with the smallest volume in WC. Under lower cooling rate, (e.g., AC), γ′ has sufficient time to grow to a larger volume, and η1 is 1.12, revealing that the morphology gradually evolves to cube. With the decrease in the cooling rate, lattice misfit and volume continue to rise, demonstrating that for the sake of total free energy decreasing with primary γ′ growing, γ′ morphology changes from spherical to cuboidal.
4.2.3 Cuboidal γ′→Concave Cuboidal γ′ Evolution Under FC Condition
Under FC condition, concave cuboidal primary γ′ was observed and the total free energy change can be expressed as
where Aconcave is surface area of concave primary γ′ with the same volume to a cube. According to I1 and I2 of the concave cube [21], $\left| { - I_{1} \Delta - \frac{{4.5I_{2} \Delta }}{{c_{11} + 2c_{12} + 4c_{44} }}} \right|$ of the concave shape is lower than that of cube. Since Aconcave is higher than the surface area of a cube with the same volume [46], the total free energy of concave γ′ is always higher than cube when its radius (r) increases. However, as primary γ′ grows to a larger volume, it displays a more concave shape with four corners invading γ matrix (Fig. 5). Hence, the shape of primary γ′ in FC specimens cannot remain cube, suggesting that the evolution of cuboidal γ′ to concave cuboidal γ′ cannot reduce total free energy.
In Sect. 3.2, cuboidal γ′ corners in FC specimens protrude into the matrix and then turn sharper with longer growing time than AC. Besides, as calculated in Sect. 3.3.2 and presented in Fig. 10, lattice misfit of corner region in concave primary γ′ is negative, and the absolute value is higher than that of edge region. Thus, misfit stress around corners of cuboidal primary γ′ is higher than the stress that is present in the edge region. From the study on equilibrium shape during interface migration, shape instability is induced by increasing stress [71, 72], revealing that corners exhibit higher shape instability than edges. The higher instability makes atoms more likely to migrate and the primary γ′ corners own the maximum exposure area per unit volume to solute atoms, leading to the corners to grow faster.
As explained in Sect. 4.1, growth of primary γ′ stops because of the appearance of soft impingement and reduction in supersaturation. Hence, though diffusion fields of adjacent primary γ′ probably have overlapped with each other which could slow down the growth, high shape instability leads to high diffusion of solute atoms which can overcome the restriction of soft impingement. Therefore, increase in misfit absolute value in corners can transform the morphology of γ′ from a cube to a concave cube.
As discussed above, Al, Cr and Fe elements in core area of the concave cube distribute uniformly and the concentration of Al is higher than Cr and Fe, which is consistent with the other researchers [73, 74]. Besides, with the distance getting closer to the corner, concentration of Al decreases and concentrations of Cr and Fe increase, which is probably due to lower Al and higher Cr and Fe in γ matrix after long duration time [75]. It is shown that the concentration of Al, Cr and Fe in γ′ remains stable in the early stage and with the aging time increasing, Cr and Fe increase and Al decreases [76].
4.2.4 Splitting of Concave γ′ Under FC Condition
It is known that in Ni-based alloy, γ′ developed from sphere to cube with an increase in aging time and subsequently split γ′ formed [77,78,79,80]. Besides, concave morphology is the former state of split γ′ [81]. Few studies investigated how splitting process is conducted after cuboidal γ′ evolves to concave morphology in Ni3Al-based superalloy. As shown in Fig. 1e, split γ′ forms in FC specimens and γ channels are observed in the center of concave γ′ edge, which is consistent with the splitting of γ′ during coarsening [82, 83]. As derived from Eqs. (5) and (12), changes in total free energy for splitting can be described as
where Asplit is the surface area of split primary γ′ with the same volume of cube. Obviously, splitting related to γ channel formation can increase surface area. Besides, splitting γ′ tends to be octet split, and $\left| { - I_{1} \Delta - \frac{{4.5I_{2} \Delta }}{{c_{11} + 2c_{12} + 4c_{44} }}} \right|$ of octet split is higher than concave cube [13]. It is therefore concluded that the splitting reduces the total free energy as concave primary γ′ grows to a higher volume.
4.2.5 Generation of Dislocations Around the Concave γ′ Under FC Condition
Dislocations interacting in γ matrix and piling up around concave γ′ (Fig. 1f) are exhibited in FC condition with the largest misfit. However, these phenomena are not found under AC and WC conditions. It has been proved that after long-time aging treatment, misfit dislocations form around γ′, which are caused by the reduction in elastic strain energy [84, 85], and dislocation networks present in γ channel due to the interaction of misfit dislocations with different orientations [70, 86].
To identify the Burgers vector of dislocations in Fig. 1f along [-110] zone axis, arrangement of atoms around the dislocations is depicted (Fig. 11a). These two extra atomic planes marked by yellow dashed frames form core structure of the dislocations. According to FFT image shown in the inserted image of Fig. 11e, they are parallel to $\left( { - 1 - 11} \right)$ and (111) planes, respectively. Because γ matrix owns FCC structure and the slip system is $\left\{ {111} \right\}\left\langle {110} \right\rangle$, {111} planes are predominant slip planes with a slip direction of $\left\langle {110} \right\rangle$ for γ. In perfect FCC structure, atoms arrangement is ABAB along [-110] zone axis. As the two extra planes appear caused by slip, atoms will be arranged as AA or BB, which is shown by crooked black dash line. Then, Burgers vector circuit of each extra plane can be drawn. In order to confirm the plane of the Burgers vector in, three-dimensional lattice structure of γ is shown in Fig. 11b. The different layers of atoms are marked by solid balls and hollow balls. Then, the Burgers vectors are $b_{1} = \alpha_{{\gamma }} /2\left[ { - 101} \right]$ and $b_{2} = \alpha_{{\gamma }} /2\left[ { - 10 - 1} \right]$. From the overall circuit contained both extra planes, the Burgers vector can be identified as $b = \alpha_{{\gamma }} \left[ { - 100} \right]$. As shown in Fig. 11b, according to interaction between b1 and b2, dislocations with $b = \alpha_{{\gamma }} \left[ { - 100} \right]$ generate. The dislocation reaction is derived by equation
where $\alpha_{{\gamma }}$ is the lattice parameter of γ matrix.
Fig. 11

Fig. 11
a Arrangement of extra atomic planes from
Since larger lattice misfit results in larger dislocation movement and stronger interaction between dislocations [87], dislocations with $b_{1} = {{\alpha }}_{{\gamma }} /2\left[ { - 101} \right]$ and $b_{2} = \alpha_{{\gamma }} /2\left[ { - 10 - 1} \right]$ slip in $\left( { - 1 - 11} \right)$ and (111), respectively, which meet the requirement to form a $b = \alpha_{{\gamma }} \left[ { - 100} \right]$ dislocation in FC specimens.
4.3 Morphology Evolution of Primary γ′ in Ni3Al-Based Superalloy with High Volume Fraction
The schematic diagrams of the shape evolution of WC, AC and FC with high volume fraction (>70%) are shown in Fig. 12a-c, respectively. For WC specimens, primary γ′ grows into small sphere (Fig. 12a) which is caused by insufficient time of atoms migration and redistribution. Thus, primary γ′ presents as sphere with a minimum surface energy, which can lead to an overall decrease in total free energy. Since the shape contribution $\left( {\left| { - I_{1} \Delta - \frac{{4.5I_{2} \Delta }}{{c_{11} + 2c_{12} + 4c_{44} }}} \right|} \right)$ of cube is lower than sphere, spherical γ′ transformed to cuboidal γ′ under AC condition. For a lower cooling rate of FC (Fig. 12c), primary γ′ has more time to grow. When transition of spherical γ′ to cuboidal γ′ finishes, γ′ corners own higher stress and higher exposure area per unit volume to solute atoms, resulting in faster growth in the corners. When the volume of concave primary γ′ reaches a critical value, to lower its elastic strain energy, splitting occurs.
Fig. 12

Fig. 12
Schematic diagrams of primary γ′ evolution under different cooling rates of a 1270 °C×9 h+WC; b 1270 °C×9 h+AC; c 1270 °C×9 h+FC
It is worth noting that γ′ precipitation can be suppressed with high cooling rate related to low volume fraction γ′ (<30%) [88,89,90,91]. This suppression tends to form a precipitates-free region, which can significantly reduce the hardness and uniformity. This study analyzes the nucleation, morphology and misfit evolution of primary γ′ with different cooling rates after solid solution of Ni3Al-based superalloy. It is therefore found that even under high cooling rate, there is still a high volume fraction of primary γ′, which facilitates the improvement in microstructure uniformity.
5 Conclusions
Polycrystalline Ni3Al-based superalloy was investigated under different cooling rates (WC, AC and FC). The morphology characteristics and evolution mechanism of primary γ′ were discussed and clarified. The following conclusions can be drawn:
1. Primary γ′ with high volume fraction presents as sphere and cuboidal shape in the dual-phase zone under WC and AC conditions, respectively. Concave primary γ′ and splitting primary γ′ are formed under FC condition, and secondary spherical γ′ precipitates in γ channel. The size of primary γ′ decreases, and NR increases with the increase in the cooling rate, and the lattice misfit transforms from positive to negative with the increase in its absolute value. For FC specimens, converse distribution of Cr, Fe and Al elements in the corner of primary γ′ appears, since the solid solution of Cr and Fe elements in protrusion of corners increases and Al element decreases.
2. NR is mainly controlled by ΔT and ΔC, and appearance of soft impingement suppresses NR. As cooling rate decreases, ΔT reduces, leading to the decrease in NR. As temperature further decreases after the growth of primary γ′ stops, for FC specimens with enough growth time, secondary γ′ precipitates in the center of γ channel own bigger ΔC. ΔC near the interface of primary γ′ and γ decreases as Al diffuses into primary γ′. However, regions away from the interface maintain supersaturation and first reach the state of secondary γ′ nucleation. With the increase in γ lattice parameter caused by higher nucleation temperature and lower thermal expansion of γ′, |ε| and |δ| decrease with the increase in the cooling rate.
3. Evolution of primary γ′ morphology has three stages: spherical γ′ (WC, AC and FC)→cuboidal γ′ (AC, FC)→concave cube (FC)→split concave cube (FC). For the fast cooling rate of WC, primary γ′ has no time to grow, resulting in near sphere just as it precipitates from γ at initial stage. For AC specimens, $\left( {\left| { - I_{1} \Delta - \frac{{4.5I_{2} \Delta }}{{c_{11} + 2c_{12} + 4c_{44} }}} \right|} \right)$ of cube is lower than that of sphere. Primary γ′ grows from sphere to cube due to the reduction in total free energy. Since primary γ′ has a longer time to grow in FC, corners of cuboidal primary γ′ exhibiting higher lattice misfit absolute value break the initial elemental balance and lead to a shape instability which causes solute atoms to continuously diffuse into corners. The formation of splitting γ′ can reduce the total free energy as primary γ′ continuously grows, and dislocations, owing to the largest misfit, are observed around concave γ′, which can be interacted as $\alpha_{{\gamma }} /2\left[ { - 101} \right] + \alpha_{{\gamma }} /2\left[ { - 10 - 1} \right] \to \alpha_{{\gamma }} \left[ { - 100} \right]$.
Acknowledgements
This work was financially supported by the Natural Science Foundation of Hebei Province (No. E2019202161), the High-level Talent Funding Project of Hebei Province (No. A201902008), the Key R&D Program of Hebei Province (No. 19251013D), the College Student Innovation and Entrepreneurship Training Program of Hebei University of Technology (No. S201910080035) and the National Key R&D Program of China (No. 2018YFB2001805).
Reference

Precipitate shapes in nickel-base superalloys vary substantially with alloy composition, partitioning of elements to the disordered gamma matrix and the ordered gamma prime precipitates and the degree of coarsening during elevated temperature exposures. These shapes, which vary from spherical to cuboidal to rod-like, have typically not been quantified in Ni-base alloys containing relatively high gamma' volume fractions, in spite of their importance to mechanical properties. Precipitate shapes in a series of new platinum group metal (PGM)-containing Ni-base alloys have been quantified by their two-dimensional moment invariants. Precipitate morphologies were characterized in a total of 17 PGM-containing alloys in the solution treated and aged condition. The average gamma' volume fraction was measured as 0.60, typical of highly creep resistant Ni-base alloys. PGM additions resulted in an unusually large range of precipitate shapes. Precipitate morphologies were quantitatively analyzed using a shape parameter derived from the absolute moment invariant. For the compositions examined, the shape parameter reaches a maximum value at a precipitate matrix misfit magnitude of 0.4%. A large set of commercial single crystals exhibits the same range in shape parameter values around this misfit magnitude, suggesting that favorable high temperature properties are correlated with an optimum precipitate shape. (C) 2011 Acta Materialia Inc. Published by Elsevier Ltd.
AbstractThis work presents the assessment of the diffusion mobilities in both the γ′ (Ni3Al-L12) and B2 (NiAl) phases in the Ni–Al–Cr system utilizing the phenomenological model developed by Helander and Ågren. Available experimental tracer diffusivity, interdiffusion coefficients and activation energies were evaluated and then used to optimize the composition- and temperature-dependent diffusion mobilities. For both the B2 and γ′ phases, the assessed diffusion mobility descriptions reproduce the Arrhenius temperature dependence for the Ni, Al and Cr tracer diffusivities and interdiffusion coefficients. The assessment reproduces the strong composition dependence of the diffusivities in the B2 phase observed experimentally. The measured composition dependences of the diffusivities in the γ′ phase are also replicated by the present mobility descriptions. The assessed mobility descriptions are validated by comparing calculated and measured composition profiles for a variety of Ni–Al and Ni–Al–Cr diffusion couples, including B2/B2, γ (fcc)/γ′ and γ/B2 couples.]]>
- About journal
- Authors and reviewers
- Contact
E-mail: ma@imr.ac.cn
Address: 72 Wenhua Road, Shenyang, Liaoning, 110016, China
 WeChat
- Copyright © Editorial Office of Metals Advances, All Rights Reserved.
