Search for articles:
Yu-Fen Zhang , Tie-Gui Lin
Corresponding authors:
Received: 2019-01-11
Revised: 2019-02-24
Online: 2019-09-10
Copyright: 2019 Editorial board of Acta Metallurgica Sinica(English Letters) Copyright reserved, Editorial board of Acta Metallurgica Sinica(English Letters)
More
Abstract
A calcium stearate-based hydrophobic coating was formed on an anodized magnesium alloy by the electrodeposition method. The influences of the working voltages on the characteristics of the coatings were researched. The results indicate that the working voltages have significant effects on the morphology, thickness, roughness, and wettability of the hydrophobic coatings, but little influence on the phase composition. Higher working voltages promote the nucleation of the coatings during the deposition process. The thickness, roughness, and water contact angle of the coatings increase with the increase in working voltage. In addition, the influences of the working voltages on the corrosion properties and corrosion mechanisms of the coated magnesium alloys are discussed in detail. When the working voltage is 50 V, the best corrosion resistance is obtained, but when the working voltages are 20 V and 100 V, respectively, a low corrosion resistance is obtained because of the presence of the thinner and cracked coating on the substrate surfaces.
Keywords:
Recently, there has been much attention paid to magnesium alloys in the biomedical field due to their low density, high specific strength, good biocompatibility, and similar mechanical properties to natural bone [1, 2, 3]. Magnesium is an essential element in the human body, and magnesium alloys can induce the formation of new bone when they are used as bio-absorbable implants [4, 5]. However, the rapid degradation of magnesium alloys limits their applications because of their high corrosion rates [6].
Various coating systems including calcium phosphate coating [7, 8, 9], hydroxyapatite coating [10, 11, 12], plasma electrolytic oxidation coating [13, 14, 15], polymer bioactive coating [16, 17, 18], chemical conversion coating [19, 20], and composite coating [21, 22, 23, 24] have been applied to slow down the corrosion rate of magnesium alloys. Recently, a hydrophobic coating with the water repellant property has been used to provide corrosion protection for magnesium alloys [25, 26, 27, 28, 29, 30]. The high hydrophobicity of the coatings confers an excellent corrosion resistance for the magnesium alloys due to the decrease in the contact area of the solid surface with the corrosive medium, and therefore the corrosion of the magnesium alloys can be delayed or controlled. Furthermore, good hemocompatibility was reported for AZ31 coated with the hydrophobic coating by chemical etching which is followed by the surface modification using stearic acid [31]. Low bacteria adhesion was reported for hydrophobic coating prepared on AZ91D magnesium alloy by the hydrothermal method followed by the modification with stearic acid [32].
Traditionally, two steps are involved in the preparation for a hydrophobic coating on magnesium alloy: construction of a rough surface and reduction in the surface energy [30, 33, 34]. A rough surface can be obtained by using the in situ hydrothermal crystallization method [33], electrodeposition [34], or the electrochemical machining process [30]. Subsequently, silane coupling agent [33], lauric acid [34], or FAS (fluoroalkylsilane) [30] is employed to reduce the surface energy. Compared to traditional approaches, electrodeposition as an effective one-step method has been used to prepare hydrophobic coatings on copper and zinc, which were based on zinc-laurylamine or Cu(II)-laurylamine [35, 36]. Stearic acid is a saturated fatty acid in the human body and has no physical toxicity, and therefore has been widely used in medicine preparation research [37]. In addition, calcium is an essential element in the human body. Therefore, the calcium stearate-based hydrophobic coating on the AZ21 surface has been created with the electrodeposition method. It is noted that this coating can be deposited on AZ21 directly using the electrodeposition method, without any pre-treatment. However, in order to improve the adhesion of the hydrophobic coating and stabilize the interface between the hydrophobic coating and the alloy, an anodizing pre-treatment is used beforehand.
In previous researches, we found that the deposition time greatly affected the corrosion behaviors of the calcium stearate-based hydrophobic coating [38]. The working voltage is also an important factor affecting the morphology and corrosion properties of the coating. Wang et al. [39] prepared hydrophobic film on copper with capsaicin/ethanol solution via the electrodeposition method and studied the influences of working voltages on the morphology and wettability of the film. The results show that no obvious deposits can be found on the copper under a working voltage of 5 V. However, at a working voltage of 15 V, some deposits can be observed and the coated copper presents a water contact angle of 93°. The copper surface is coated with a porous structure film at a working voltage of 30 V, and the film shows a water contact angle of 154°. However, the corrosion resistance and corrosion mechanism of the coated copper prepared with different working voltages have not been studied yet. The influences of working voltages on the morphology and wettability of the hydrophobic coating on magnesium alloy surface have not been reported. Thus, our research focuses on the influences of working voltages on the deposition and corrosion behaviors of the calcium stearate-based hydrophobic coating fabricated on a magnesium alloy and the effects of working voltages on the coating morphology, thickness, roughness, and the corrosion behavior as well.
The chemical composition of the received magnesium alloy is shown in Table 1. Mg alloy samples with the size of 60 mm × 40 mm × 0.6 mm were prepared. The specimens were ground using SiC emery papers of up to 1500 grit, cleaned with ethanol, and dried in cool air in turn.
Table 1 Chemical composition of the received material (wt%)
| Al | Cu | Mn | Fe | Ni |
|---|---|---|---|---|
| 1.92000 | 0.01330 | 0.37700 | 0.01200 | 0.00108 |
| Zn | Be | Si | Ag | Ca |
| 1.18000 | 0.00004 | 0.05190 | < 0.00010 | 0.00444 |
| Sn | Zr | Ce | La | Mg |
| < 0.00050 | < 0.00060 | 0.00535 | 0.01410 | 96.42000 |
The anodic oxidation process was carried out by using an electrochemical workstation (Potentiostat/Galvanostat Model 273A, America) as a power supply under a constant voltage of 100 V for 10 min at the ambient temperature. During the anodic oxidation, the prepared magnesium alloy sheet and the other magnesium alloy sheet served as the anode and cathode, respectively. The electrolyte for the anodic oxidation process was composed of calcium nitrate (0.045 mol/L) and magnesium nitrate (0.005 mol/L), and ethanol (≥ 99.5%) was used as the solvent. The prepared anodized layer on the magnesium alloy was the substrate.
The coating was cathodically electrodeposited on the anodized magnesium alloy using an electrochemical workstation (Potentiostat/Galvanostat Model 273A, America). The electrolyte was composed of calcium nitrate (0.05 mol/L) and stearic acid (0.05 mol/L), and the solvent was ethanol (≥ 99.5%). The electrodeposition was conducted in a two-electrode cell at room temperature. The anodized magnesium alloy and a graphite sheet served as the cathode and anode, respectively. The specimen had an exposed area of 16 cm2 in the electrolyte. The working voltage between the two electrodes was controlled at 20 V, 50 V, and 100 V, respectively, and the deposition time was fixed at 60 min. After electrodeposition, the specimens were cleaned in ethanol and dried at room temperature. During the electrodeposition process, the current density versus time curve was recorded. The coated samples obtained at 20 V, 50 V, and 100 V were named HC-20, HC-50, and HC-100, respectively.
Scanning electron microscopy (SEM Quanta 200, FEI Co., America) with an acceleration voltage of 20 keV was used to examine the coating surface and cross-sectional morphologies. All of the samples used for the SEM observation were splattered with gold for conducting. The phase compositions of the hydrophobic coatings and the anodized magnesium alloy were determined by X-ray diffraction measurement (X’Pert, Philips, Holland) using Cu-Kα radiation at 40 kV and 40 mA with a 3° incident angle. The data were collected from 15° to 50° at a scan speed of 0.1° min-1. A water contact angle meter (Dataphysics OCA20, Germany) was utilized to evaluate the static water contact angles of the coatings at room temperature. A 3 μL droplet was used for the measurement, and the average values of three measurements for each specimen were recorded. Surface roughness of the coatings formed at 20 V, 50 V, and 100 V was evaluated by a 3D laser scanning confocal microscope (LSCM) LEXT OLS3000 (Olympus, Japan) with a magnification of 480 times. A high-range phase compensation filter (λc) that excludes the wavelength portion above 12.3 μm was used.
Electrochemical tests were performed in Kokubo’s simulated body fluid (SBF) at 37 ± 0.5 °C with a Gamry (Reference 3000) potentiostat. The SBF was composed of 8.035 g/L NaCl, 0.355 g/L NaHCO3, 0.225 g/L KCl, 0.231 g/L K2HPO4·4H2O, 0.311 g/L MgCl2·6H2O, 0.292 g/L CaCl2, and 0.072 g/L Na2SO4 [40]. HCl (1.0 mol/L) and tris(hydroxymethyl)aminomethane ((CH2OH)3CNH2) were used to adjust the pH of the SBF to 7.4. Electrochemical corrosion behavior was investigated by potentiodynamic polarization curves and electrochemical impedance spectroscopy (EIS) tests in a standard three-electrode cell configuration. A saturated calomel electrode (SCE) was used as the reference electrode, a graphite electrode as the counter electrode, and the as-prepared specimen as the working electrode with an exposed surface area of 1 cm2. The open-circuit potential (OCP) was fixed to 30 min to stabilize the specimen prior to potentiodynamic polarization tests, and the scanning rate was set to 0.5 mV/s. The electrochemical impedance spectroscopy (EIS) tests were carried out from 100 kHz to 0.01 Hz with an AC amplitude of 10 mV. The EIS experimental data were further analyzed by ZSimpWin software. To ensure the reproducibility, all the tests including potentiodynamic polarization curves and EIS measurements were carried out three times.
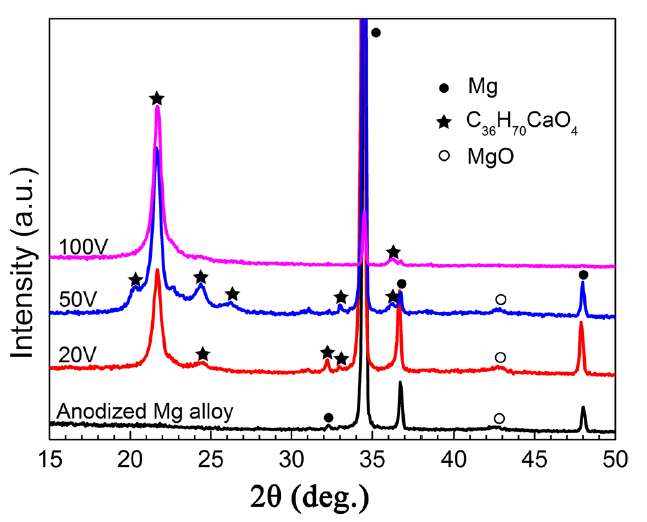
The XRD patterns of the anodized magnesium alloy and hydrophobic coatings with different working voltages are depicted in Fig. 1. It is easy to find that the main phase compositions of the anodized magnesium alloy substrate and the as-prepared coatings are MgO and calcium stearate, respectively. Moreover, the peaks of magnesium and magnesium oxide are also detected from the as-prepared coatings due to penetration of the X-ray. The phase compositions of the coatings formed at different working voltages show little change; however, the intensities of the calcium stearate diffraction peaks increase and the intensities of the magnesium peaks decrease with the increase in working voltage, suggesting that the coating thickens with the increase.
Fig. 1 XRD patterns of the anodized magnesium alloy and hydrophobic coatings obtained at the different working voltages
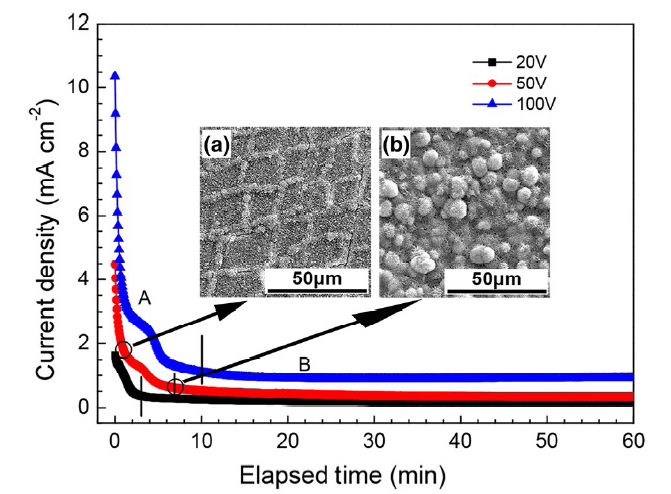
Figure 2 shows the current density evolution with time at different working voltages. The current densities versus time curves show the same trend within the whole deposition process. Under the working voltage of 50 V, the coating has been formed on the substrate after 1 min of deposition. The inset (a) in Fig. 2 shows the presence of coating on the substrate surface, demonstrating the nucleation of the coating. With the deposition proceeding, the coating covers the entire surface of the substrate completely by 7 min, which is revealed by the inset (b) in Fig. 2.
Fig. 2 Current density as a function of time recorded during the electrodeposition process. The insets are the SEM images of the coatings formed under 50 V at 1 min a, 7 min b
The formation mechanism of the coating on the anodized magnesium alloy can be proposed as follows: Calcium nitrate is dissociated into calcium ions (Ca2+) and nitrate ions (NO3-) in the electrolyte. When the solution is electrolyzed by the applied voltage, the dissociation of stearic acid (CH3(CH2)16COOH) [Eq. (1)] will be accelerated, resulting in the appearance of a great deal of stearic acid ions (CH3(CH2)16COO-) and hydrogen ions (H+) in the electrolyte. The hydrogen ions (H+) are reduced and a large number of hydrogen bubbles spill from the electrolyte [Eq. (2)], which have been observed by the experimental phenomena. Whereafter, calcium ions (Ca2+) in the electrolyte capture stearic acid ions (CH3(CH2)16COO-) leading to the formation of calcium stearate (Ca[CH3(CH2)16COO]2) on the cathode surface [Eq. (3)]:
${\text{CH}}_{3} \left( {{\text{CH}}_{2} } \right)_{16} {\text{COOH}} \to {\text{CH}}_{3} \left( {{\text{CH}}_{2} } \right)_{16} {\text{COO}}^{ - } + {\text{H}}^{ + }.$ (1)
$2{\text{H}}^{ + } + 2{\text{e}}^{ - } \to {\text{H}}_{2} \uparrow.$ (2)
$2\left[ {{\text{CH}}_{3 } \left( {{\text{CH}}_{2} } \right)_{16} {\text{COO}}} \right]^{ - } + {\text{Ca}}^{2 + } \to {\text{Ca}}\left[ {{\text{CH}}_{3 } \left( {{\text{CH}}_{2} } \right)_{16} {\text{COO}}} \right]_{2}.$ (3)
Two stages (A and B) are obviously seen in Fig. 2, which indicate the nucleation and growth phases of the coating, respectively. During stage A, the current densities decrease obviously within the first minute. This is caused by the increase in resistance on the substrate surface, resulting from the fast nucleation rate of the coating at the very beginning of the deposition. When the working voltage is 20 V, 50 V, and 100 V, the time of the current densities decreases rapidly at 3 min, 7 min, and 10 min, respectively. The higher the working voltage is, the longer the time the current density takes to reach a steady value. Equation (2) proceeds rapidly with the increase in the working voltage, and hydrogen bubbles escape from the cathode as a result of the accelerated reaction of Eq. (2). In this case, the formation of the coating is restricted, resulting in a steady film being deposited after a long time.
During stage B, the current densities do not change evidently, which maintain a relatively lower value during the succedent deposition process. On the one hand, it indicates a lower nucleation rate of the coating on the substrate surface. On the other hand, it shows that the substrate is completely covered by the deposited coating [36]. In this case, the surface resistance of the cathode (substrate) stops changing, and an almost constant current density is present in stage B due to the constant working voltage applied. The steady current densities are around 0.18 mA cm-2, 0.34 mA cm-2, and 0.92 mA cm-2 when the voltage changes from 20 V, 50 V to 100 V, respectively.
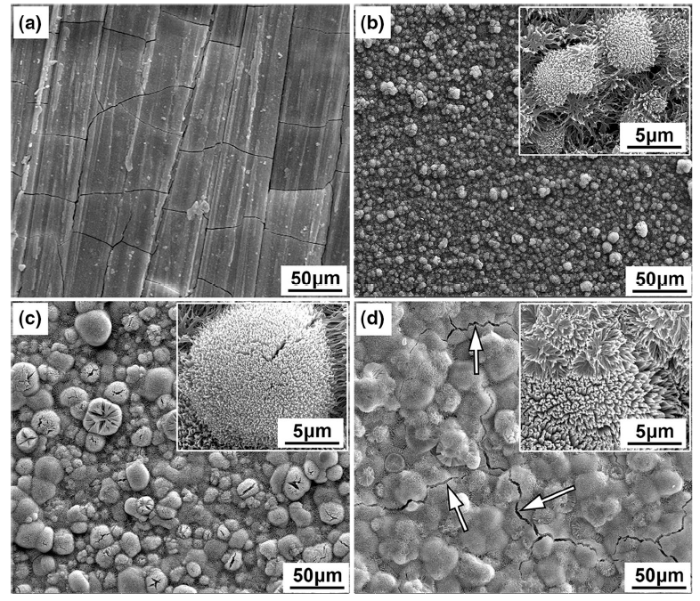
Figure 3 illustrates the surface morphologies of the anodized magnesium alloy and hydrophobic coatings formed at the different working voltages. Figure 3a reveals many cracks caused by internal stress on the surface of the anodized magnesium alloy. The surface morphologies of the hydrophobic coatings formed at the different voltages (Fig. 3b-d) are significantly different. Though all the coating surfaces are covered by large numbers of microscale protrusions and the surfaces of them are full of villiform character nanostructures, the size and shape of the protrusions are different. The average diameter of the protrusions formed at 20 V is 9 μm (Fig. 3b). They are 23 μm (Fig. 3c) and 31 μm (Fig. 3d) when the coatings are formed at 50 V and 100 V, respectively. It is easy to find that the average diameter of the protrusions gradually increases with the working voltage. Since the higher working voltages applied on the substrate enhance the nucleation rate and growth rate of the coating, it results in the formation of a bigger coating particle on the substrate surface. The protrusions are composed of villiform ball nanostructures when the coatings formed at 20 V and 50 V (Fig. 3b, c). When the voltage gets to 100 V, the surface of the protrusions is composed of villiform petal nanostructures (Fig. 3d). Moreover, significant cracks are observed on the coating surface (as shown with arrows in Fig. 3d). This may be induced by the increasing inner stress from the fastest nucleation rate and growth rate of the coating along with the volatilization of ethanol in the drying process of the coating after electrodeposition [41]. In addition, vacuuming during SEM can enlarge the micro-cracks [41]. The presence of the cracks might decrease the corrosion resistance of the coated substrate [41].
Fig. 3 Surface morphologies of the anodized magnesium alloy a and coatings formed at the different voltages (b 20 V, c 50 V, d 100 V). The insets in b, c, d show images at high magnification, respectively
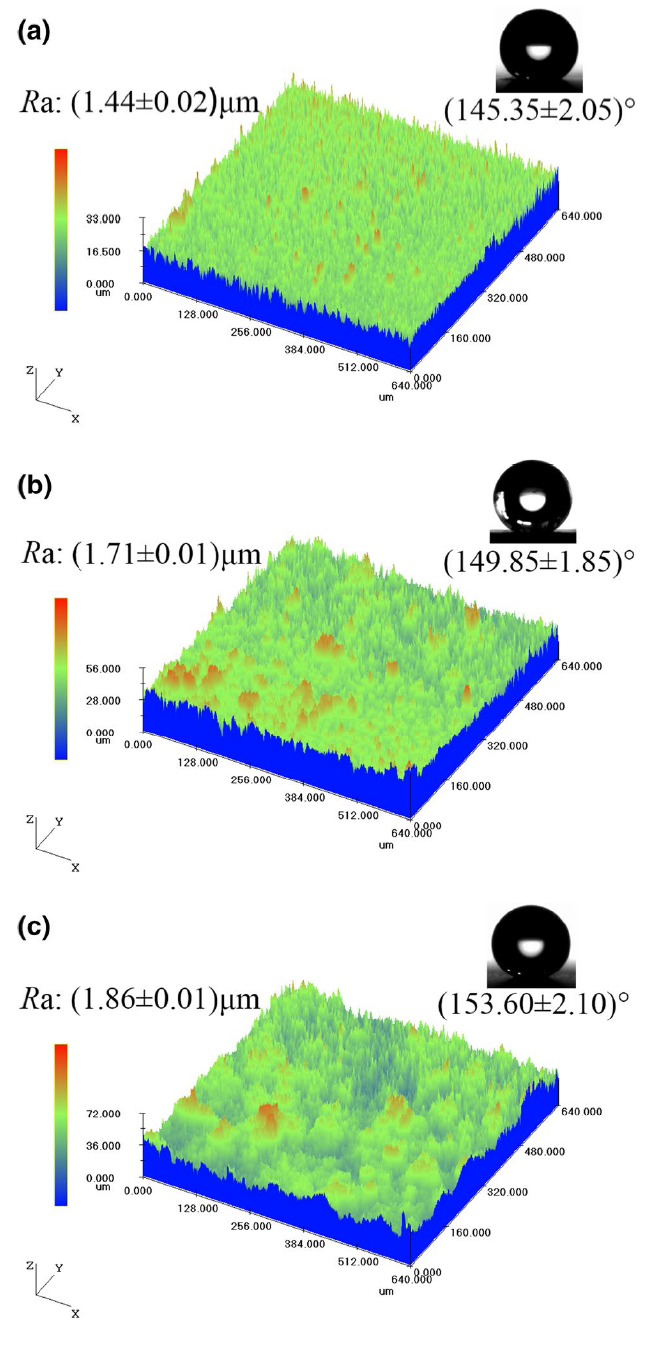
A qualitative 3D characterization of the roughness of the coatings obtained at different working voltages was performed with LSCM, and the results are shown in Fig. 4. Compared to the coating formed at 20 V (Fig. 4a), the coatings formed at 50 V and 100 V are rather rough with large fluctuations (Fig. 4b, c). For a quantitative evaluation of the surface roughness, a 2D analysis was performed along the coating section using LSCM and Ra values were obtained. R corresponds to the height characteristics of the surface microcosmic geometry. The Ra parameter is defined as the profile arithmetic average deviation. The larger the Ra value, the rougher the coating surface is. The Ra values are (1.44 ± 0.02) μm (Fig. 4a), (1.71 ± 0.01) μm (Fig. 4b), and (1.86 ± 0.01) μm (Fig. 4c) when the working voltages are 20 V, 50 V, and 100 V, respectively. As the working voltage increases, the coating becomes rougher and rougher.
Fig. 4 3D observations and 2D roughness parameters of the coatings obtained at the different working voltages: a 20 V, b 50 V, c 100 V. The insets are static contact angle of water droplet on the surface of the coatings, respectively
Figure 4 also shows the corresponding water contact angles on these coating surfaces as well. As the voltage increases from 20 V to 50 V to 100 V, the corresponding static water contact angle values increase from (145.35 ± 2.05)° to (149.85 ± 1.85)° to (153.60 ± 2.10)°, respectively. This indicates that the hydrophobicity of the coating surface can be controlled by adjusting the deposition parameters. It is obvious that the increase in the coating roughness is beneficial to the improvement in the coating hydrophobicity. From Fig. 3b-d, it can be found that the surface wettability of the coating is relevant to the surface morphology. The coating surface is covered with a hierarchical micro-/nanostructure, and the rough surface is prone to trapping air. The wettability of the hydrophobic coating can be explained by Cassie-Baxter equation [42, 43]:
${ \cos }\theta_{r} = f_{1} \left( {{ \cos }\theta + 1} \right) - 1 = f_{1} { \cos }\theta - \left( {1 - f_{1} } \right).$ (4)
where θ is the water contact angle on the surface of the substrate; θr represents the water contact angle on the surface of the hydrophobic coating; and f1 and (1-f1) refer to the fraction of solid and air at the solid/water interface. Thus, the value of θr will increase if the fraction of air at the interface increases. The more the air trapped by the micro-/nanostructure, the larger the water contact angle would be. Apparently, the micro-/nanostructure on the surface of HC-100 can trap more air, followed by the HC-50 and HC-20. The wettability of the HC-50 after immersion in SBF at 37 °C for different time was evaluated in our previous study [38]. The water contact angles are around 126° and 91° after immersion for 24 h and 96 h, respectively, suggesting that the coating can keep a good hydrophobicity during SBF immersion.
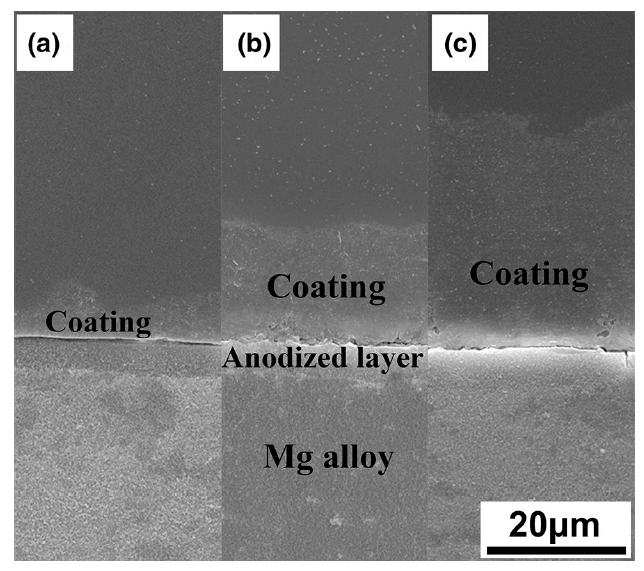
The cross sections of the coatings obtained at the different working voltages are shown in Fig. 5. The average thickness of the anodized magnesium alloy layer is around 6 μm. The deposited coating’s average thickness increases from about 6 μm (Fig. 5a), 16 μm (Fig. 5b) to 33 μm (Fig. 5c) when the working voltage changes from 20 V, 50 V to 100 V, respectively, meaning that the coating thickens significantly with the working voltage increase. The higher the working voltage is, the quicker the nucleation and growth rates are and the thicker the coating would be.
Fig. 5 Cross-sectional images of coatings formed at the different working voltages: a 20 V, b 50 V, c 100 V
3.4.1 Potentiodynamic Polarization Curves
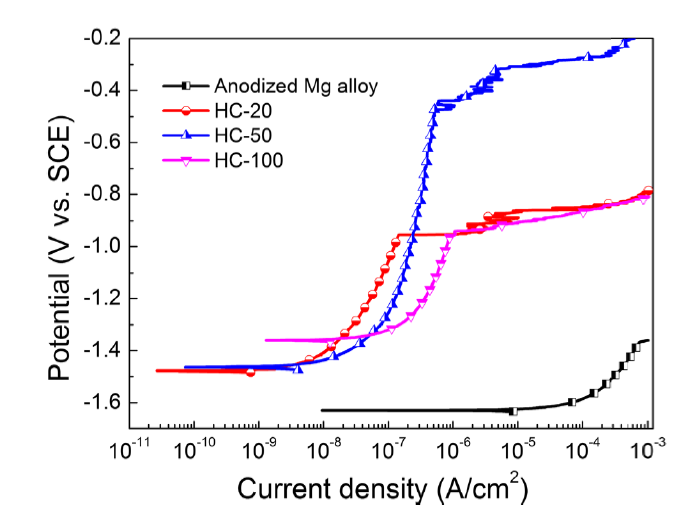
Electrochemical methods were used to determine the corrosion property of the anodized magnesium alloy substrate and the hydrophobic coatings. Figure 6 shows the potentiodynamic polarization curves of the anodized magnesium alloy and the coated substrates. The pitting potentials (Epit) derived from the potentiodynamic polarization curves are listed in Table 2. It is obvious that the Epit values of the coated samples are higher than that of the anodized magnesium alloy, which is due to the appearance of a passivation region on the anodic polarization curves of the coated samples. Compared to the polarization curves of the hydrophobic coatings, it is easy to see that the shapes of the curves are similar, implying that the corrosion behaviors of the hydrophobic coatings are similar. The anodic current densities increase slowly with the potential, which causes a passivation region shown on the potentiodynamic polarization curves shown in Fig. 6. The largest passivation region appears on the anodic polarization curve of the HC-50, which provides protection for the HC-50. In this case, the HC-50 exhibits the best resistance to localized corrosion.
Fig. 6 Polarization curves of the anodized magnesium alloy and hydrophobic coatings formed at the different working voltages in SBF at 37 ± 0.5 °C
Table 2 Pitting potential of the samples as read from
| Samples | Epit (V vs. SCE) |
|---|---|
| Anodized Mg alloy | - 1.62 ± 0.02 |
| HC-20 | - 0.95 ± 0.03 |
| HC-50 | - 0.47 ± 0.06 |
| HC-100 | - 0.95 ± 0.01 |
3.4.2 Electrochemical Impedance Spectroscopy
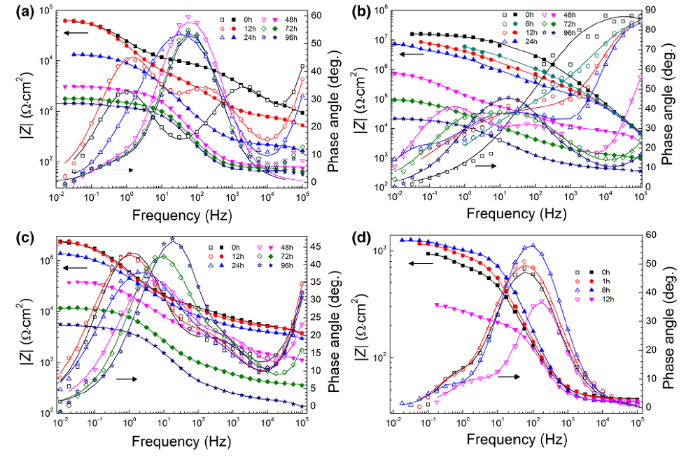
The corrosion behaviors of the anodized magnesium alloy substrate and the hydrophobic coatings formed at the different voltages were researched by electrochemical impedance spectra. Figure 7 depicts the electrochemical impedance spectra of all the specimens immersed into SBF at 37 ± 0.5 °C at different periods. It can be seen that the impedance plots illustrate the degradation process of the hydrophobic coating.
Fig. 7 Bode plot evolution of the coated substrates (a HC-20, b HC-50, c HC-100) and the anodized magnesium alloy d in SBF at 37 ± 0.5 °C. Symbols are experimental data and solid lines are fitting data
As shown in Bode plots, the HC-20 from 0 to 24 h (Fig. 7a), there are three time constants, distributed at high-frequency (104-105 Hz), medium-frequency (10-104 Hz), and low-frequency (10-1-10 Hz) zones, respectively. They are corresponding to the outer hydrophobic coating, the inner anodized layer, and the electrochemical double layer, respectively. The time constant for the HC-20 at high frequency disappears after 48 h, indicating a deterioration of barrier properties of the hydrophobic coating and the penetration of water and aggressive ions into the coating. The Bode plots of HC-50 (Fig. 7b) change from two time constants to three time constants during the immersion process. Two time constants appear at high and middle frequencies at 0 h, 6 h, and 12 h corresponding to the hydrophobic coating and the anodized layer, respectively. The electrochemical double layer, which is attributed to the time constant at the frequency range of 10-2-10-1 Hz, appears after 24 h of immersion. Three time constants are observed during the whole immersion period for HC-100 (Fig. 7c). From high frequency to low frequency, they are due to the outer hydrophobic coating, the inner anodized layer, and the electrochemical double layer. The impedance modulus of HC-50 shows the highest value (around 107 Ω cm2) at 0 h compared to HC-20 and HC-100. This indicates the strongest corrosion resistance of HC-50 at the initial immersion stage, which is consistent with the results of the polarization curves.
Figure 7d presents Bode plot evolution of the anodized magnesium alloy. The values of impedance modulus are lower (around 939 Ω cm2 at 0.1 Hz for 0 h), compared to the coated samples (Fig. 7a-c). Subsequently, it rises slightly with the immersion time, meaning that the anodized layer is continuously corroded during the immersion process. However, it drops dramatically after 12 h, suggesting the failure of the anodized layer. During the immersion in SBF, two well-defined time constants can be seen. The time constant at medium frequency (around 101-103 Hz) is due to the response of the anodized layer, and the other one at low frequency (around 10-1-101 Hz) is related to the electrochemical process on the magnesium alloy surface.
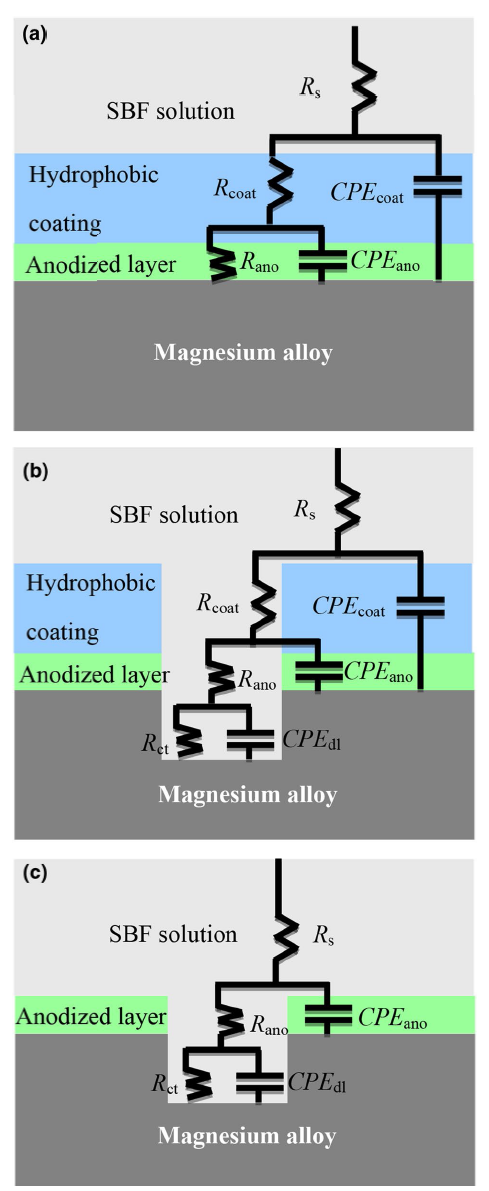
Figure 8 shows models of the equivalent circuit for EIS analysis. CPEs (constant phase elements) are used to fit the capacitance behavior in the circuits. Rs represents the solution resistance, Rcoat and CPEcoat indicate the resistance and capacitance of the outer hydrophobic coating, and CPEano and Rano describe the same for the inner anodized layer. CPEdlrepresents the double electric layer capacitance. Rct means the charge transfer resistance. The CPEdl||Rct expresses the electrochemical process between the Mg alloy and the SBF solution. The circuit in Fig. 8a is employed to simulate the Bode plots of HC-50 at 0 h, 6 h, and 12 h of immersion. The model in Fig. 8b is used to simulate the EIS of HC-20 from 0 to 24 h, HC-50 from 24 to 96 h, and HC-100 from 0 to 96 h. The model in Fig. 8c is utilized to fit the EIS of the HC-20 from 48 to 96 h and the anodized magnesium alloy from 0 to 12 h.
Fig. 8 Equivalent circuit models for the impedance spectra of the coated samples and anodized magnesium alloy substrate immersion in SBF at 37 ± 0.5 °C during the different periods: a 0 h, 6 h, and 12 h for HC-50; b 0-24 h for HC-20, 24-96 h for HC-50, and 0-96 h for HC-100; c 48-96 h for HC-20 and 0-12 h for the anodized magnesium alloy
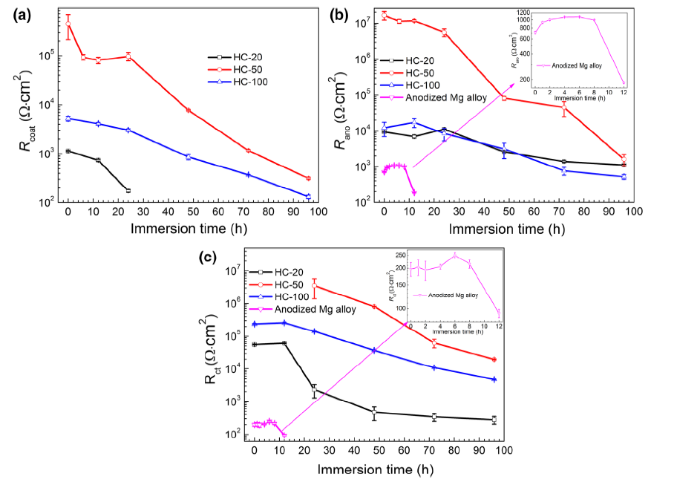
Figure 9 shows the impedance fitting parameters derived from the results. The Rcoat and Rano values show the contributions of the hydrophobic coating and the anodized layer to the overall corrosion resistance of the coated samples. The Rcoat shows a continuous decrease during immersion, illustrating the degradation of the outer hydrophobic coating.
Fig. 9 EIS fitting parameters for the coated samples and anodized magnesium alloy in SBF at 37 ± 0.5 °C: aRcoat, bRano, cRct
The Rcoat, Rano, and Rct values gradually decrease with the increase in immersion time. The Rano and Rct values of the anodized magnesium alloy are much lower than those of the coated specimens, indicating that either the hydrophobic coating or the anodized layer cannot provide continuous protection for the magnesium alloy. In case the coating and the anodized layer are penetrated by water and aggressive ions, the underlying magnesium alloy will then corrode.
HC-50 presents the highest resistance parameters (Rcoat, Rano, and Rct) during the entire immersion process, suggesting that it can provide the best protection for the substrate. The substrates should have the same corrosion performance in the SBF because the anodized layer is the same for the different coated samples. However, since the highest Rano is present in HC-50, this suggests that the hydrophobic coating provides the best protection for the anodized magnesium alloy.
3.4.3 Corrosion Protection Mechanism
The hydrophobic samples show superior corrosion resistance compared to the anodized magnesium alloy substrate. It is because the hierarchical structures of the hydrophobic coating surfaces are filled with air when they are immersed in the SBF solution, which can reduce the amount of contact of the SBF with the substrate [44]. Thus, the corrosion rate of the hydrophobic samples is much lower than that of the anodized substrate in the SBF solution. However, the working voltage affects the morphology, roughness, thickness, and wettability of the hydrophobic coatings. These characteristics have combined influences on the corrosion property of the coated substrates in SBF. The hydrophobic coatings fabricated at different working voltages show different corrosion resistance due to the different coating features being obtained at the different working voltages.
HC-20 has the lowest resistance values (Fig. 9), indicating the lowest corrosion resistance during the continuous immersion process in SBF. The hydrophobic coating on HC-20 can offer protection for the substrate within the first 12 h of immersion, which is confirmed by the relatively higher Rcoat and Rct values before 12 h (Fig. 9). The coating tends to dissolve when the sample is soaked in SBF due to the low water contact angle of the coating surface (Fig. 4). Subsequently, the solution penetrates the coating because of the thin coating on the surface (Fig. 5). The protection property of the coating drops fast, as indicated by the significant drop in the Rcoat and Rct values from 12 to 24 h (Fig. 9).
For HC-50, the best corrosion resistance is obtained, which is indicated by the highest Rcoat, Rano, and Rct values (Fig. 9). There is a higher water contact angle on the sample’s surface (Fig. 4), meaning that the coating has the correspondingly high water repellency for the SBF solution. Even though the coating surface turns to hydrophilicity with the increasing immersion time, the thicker and crack-free coating can still protect the substrate. Therefore, the best corrosion resistance is due to the combination of the higher water contact angle and thicker and crack-free coating.
HC-100 has the thickest outer hydrophobic coating (Fig. 5) and the highest water contact angle (Fig. 4). In this case, HC-100 should have the highest corrosion resistance. However, micro-cracks exist on the surface of HC-100 (as indicated with the arrow in Fig. 3d); the aggressive ions and water will penetrate the coating via these cracks and reach the substrate, causing the corrosion resistance of HC-100 to decrease. Thus, the resistance values of HC-100 (Fig. 9) are far lower than those of HC-50.
The influence of the working voltages on the electrodeposition, morphology, roughness, and wettability of the hydrophobic coatings for the anodized magnesium alloy was researched. The effects of the working voltages on the corrosion behaviors of the hydrophobic coatings have been investigated as well. The main conclusions can be drawn as follows:
1. The working voltages affect the morphologies, thickness, roughness, and hydrophobicity of the coatings but do not change the phase compositions of the coatings. The thickness, roughness, and water contact angle of the coating increase with the working voltage.
2. At the very beginning of the deposition, the higher the working voltage is, the longer the time the current density takes to reach a steady status, and the quicker the nucleation rate of the coating is. For HC-100, the current density is always the highest during the deposition of the coating compared to other samples, leading to the thickest and micro-cracked coating to exist.
3. The working voltage shows significant influence on the corrosion resistance of the hydrophobic coatings. HC-20 owns the lowest corrosion resistance due to the lowest water contact angle and the thinnest coating on the coating surface. HC-100 has a lower corrosion resistance due to the presence of micro-cracks on the coating surface. HC-50 has the highest corrosion resistance, and the combination of higher water contact angles and thicker and crack-free coating is responsible for the highest Rcoat, Rano, and Rct values.
Acknowledgements The project was supported by the National Natural Science Foundation of China (Nos. 51272055 and 51501050) and the Science and Technology Innovation Fund of Shanxi Agricultural University (No. 2017YJ14).

 WeChat
/
| 〈 |
|
〉 |