Search for articles:
Yong-Peng Liang, Shu-Hong Liu , Kai Xu, Yong Du
Corresponding authors:
Received: 2018-03-7
Revised: 2018-05-4
Online: 2019-04-10
Copyright: 2019 Editorial board of Acta Metallurgica Sinica(English Letters) Copyright reserved, Editorial board of Acta Metallurgica Sinica(English Letters)
More
Abstract
Mg-Zn-Zr series Mg alloys (ZK) are one of the most important commercial Mg alloys due to their good comprehensive mechanical properties. The phase equilibria of the Mg-Zn-Zr system at 400 °C covering the overall composition range were investigated by X-ray diffraction and electron probe microanalyses on thirteen ternary alloys. Three ternary compounds, τ1, τ2 and τ3, were detected to be thermodynamically stable at 400 °C, and their homogeneity range was determined to be Mg(7-17)Zn(80-88)Zr(4-6), Mg(15-22)Zn(66-68)Zr(9-16) and Mg9Zn68Zr23 (in at.%), respectively. Eight three-phase regions and four two-phase regions were observed. The maximum solubility of Mg in Zn22Zr, Zn39Zr5 and Zn3Zr phases was measured to be 0.52, 0.37 and 0.99 at.%, respectively, while the solubility of Zr in MgZn2 and Mg2Zn3 phases is negligible. The isothermal section of the Mg-Zn-Zr system at 400 °C was then constructed based on the present experimental data.
Keywords:
During the past decades, Mg alloys have been paid much attention due to their superior properties, such as low density, high specific strength, high specific stiffness and recyclability [1, 2, 3, 4, 5, 6, 7, 8]. Mg-Zn-Zr series are one of the main commercial Mg alloys [8, 9, 10]. Zinc is a widely used alloying element for commercial Mg alloys to improve the strength properties of the alloys. It is well known that the grain size can be refined by the addition of Zr in Mg alloys [11, 12, 13, 14]. Besides, it is reported that the addition of Zn (up to 4 wt%) can increase the solubility of Zr, which can enhance the grain refinement effects of Zr in the Mg-Zn-Zr system [15, 16]. Therefore, it is essential to study the phase equilibria in the Mg-Zn-Zr system for the design and development of the advanced Mg alloys.
However, the experimental data on the phase equilibria of the Mg-Zn-Zr system are very limited. Lashko et al. [17] reported the MgZn, Zn2Zr3, ZnZr, (Zn,Mg)2Zr and Zn2(Mg,Zr) (with the structural type of Cu2Mg) phases in cast Mg-Zn-Zr alloys for the first time. Subsequently, Morozova et al. [18] confirmed the Zn2Zr3, ZnZr and Zn2Zr phases in the as-cast Mg-Zn-Zr alloys by means of X-ray and chemical analysis. Loehberg and Schmidt [19] determined the liquidus and the path of the peritectic fusion curve in the Mg-rich corner of the Mg-Zn-Zr system by spectroscopic analysis. Until in recent years, a more detailed phase equilibrium of the Mg-Zn-Zr ternary system was investigated by Ren et al. [20] and Zhang et al. [21]. Ren et al. [20] determined the partial isothermal section of Mg-Zn-Zr ternary system at 345 °C by means of equilibrated alloy method. Their results show that there exist three binary compounds ZnZr, Zn2Zr3 and (Mg, Zn)2Zr in the Zn-Zr side and a liquid phase in equilibrium with (Mg). But it should be noted that the Zn2Zr3 phase only exists within a very limited temperature range (1000-1015 °C) [22]. Most recently, the isothermal section of the Mg-Zn-Zr ternary system at 450 °C was established by Zhang et al. [21] using six diffusion couples and sixteen key alloys. Four new ternary compounds, IM1, IM2, IM3 and IM4 and their homogeneity ranges were reported. The crystal structure and prototype of IM1 were determined to be a MgZn2 structure type with the hexagonal structure and P63/mmc space group. However, the crystal structure and prototype of the IM2, IM3 and IM4 have not been determined. Besides, they reported that no ternary solid solubility was found for the binary compounds, which contradicts the work of Ren et al. [20], who reported the solubility of Zr in the MgZn2 intermetallic compound reaches about 15.35 at.%. Considering the conflicting points in the literature, further experimental work is still needed for the phase equilibria of this system.
In this case, the present work carried out an experimental investigation on the phase equilibria of the Mg-Zn-Zr system at 400 °C to clarify the contradictions in the literature and provided more accurate experimental data for the future thermodynamic modeling of the ternary system.
High-purity Mg (99.99 wt%, block, Alfa Aesar), Zn (99.99 wt%, block, Alfa Aesar) and Zr (99.99 wt%, rod, Alfa Aesar) were used as starting materials. Thirteen ternary Mg-Zn-Zr alloys with nominal compositions listed in Table 1 were prepared. Due to the high evaporability of Mg and Zn and the significant difference in melting points of Zr (1852 °C) and the two other pure elements, the Mg-Zn-Zr alloys were prepared with the help of Ta crucibles and glove box. Prior to alloy preparation, the Zr rods were cut into pieces, cleaned sequentially with acetone. The oxide layers on the surfaces of the Mg and Zn blocks were mechanically removed and cleaned with ethanol and acetone. The Zr pieces and Mg and Zn blocks were accurately weighed in glove box and were sealed in a small Ta crucible under the Ar atmosphere and then separately encapsulated in vacuum quartz tubes for avoiding the Ta crucible from oxidation. Subsequently, the quartz tubes were kept in a L4514-type diffusion furnace (Qingdao Instrument & Equipment Co. Ltd., China) at 850 °C for 24 h and finally quenched in cold water. The obtained alloys after the above process were then taken out from the crucibles and checked and then wrapped with Ta foils and sealed in quartz tubes again with a protective Ar atmosphere. They were annealed at 400 °C for 15-40 days, followed by quenching in cold water.
Table 1 Summary of the experimental information of Mg-Zn-Zr alloys annealed at 400 °C
| No. | Nominal composition (at.%) | Phase | Phase composition (at.%) | ||||
|---|---|---|---|---|---|---|---|
| Mg | Zn | Zr | Mg | Zn | Zr | ||
| 1# | 1.0 | 97.0 | 2.0 | (Zn) | 0.23 | 99.71 | 0.06 |
| Zn22Zr | 0.52 | 95.08 | 4.40 | ||||
| Liquida | - | - | - | ||||
| 2# | 6.0 | 90.0 | 4.0 | τ1 | 7.55 | 85.87 | 6.58 |
| Liquid | 8.27 | 91.72 | 0.01 | ||||
| 3# | 16.0 | 82.0 | 2.0 | MgZn2 | 31.01 | 68.96 | 0.03 |
| τ1 | 7.95 | 87.84 | 4.21 | ||||
| Liquida | - | - | - | ||||
| 4# | 17.0 | 80.0 | 3.0 | MgZn2 | 30.30 | 69.61 | 0.09 |
| τ1 | 8.88 | 87.16 | 3.96 | ||||
| 5# | 15.0 | 75.0 | 10.0 | MgZn2 | 31.35 | 68.29 | 0.36 |
| τ1 | 16.74 | 78.34 | 4.92 | ||||
| Zn3Zr | 0.22 | 76.64 | 23.14 | ||||
| 6# | 5.0 | 80.0 | 15.0 | Zn3Zr | 0.18 | 77.26 | 22.56 |
| Zn39Zr5 | 0.28 | 89.10 | 10.62 | ||||
| τ1 | 15.14 | 80.27 | 4.59 | ||||
| 7# | 11.0 | 83.0 | 6.0 | τ1 | 8.97 | 85.91 | 5.12 |
| Zn39Zr5 | 0.37 | 89.10 | 10.52 | ||||
| 8# | 35.0 | 63.0 | 2.0 | MgZn2 | 35.04 | 64.93 | 0.03 |
| Mg2Zn3 | 38.12 | 61.87 | 0.01 | ||||
| τ2 | 15.60 | 68.21 | 16.19 | ||||
| 9# | 42.0 | 55.0 | 3.0 | Liquid | 67.1 | 32.8 | 0.01 |
| Mg2Zn3 | 39.10 | 60.90 | 0 | ||||
| τ2 | 19.30 | 67.45 | 13.15 | ||||
| 10# | 15.0 | 68.0 | 17.0 | τ2 | 22.58 | 67.99 | 9.43 |
| Zn3Zr | 0.70 | 75.92 | 23.38 | ||||
| 11# | 10.0 | 70.0 | 20.0 | τ2 | 16.39 | 68.25 | 15.36 |
| Zn3Zr | 0.78 | 75.91 | 23.31 | ||||
| 12# | 80.0 | 8.0 | 2.0 | (Mg) | 96.41 | 3.59 | 0 |
| τ2 | 22.20 | 65.03 | 12.77 | ||||
| Liquida | - | - | - | ||||
| 13# | 12.0 | 68.0 | 20.0 | Zn3Zr | 0.99 | 74.96 | 4.05 |
| τ2 | 17.52 | 67.06 | 15.42 | ||||
| τ3 | 9.14 | 68.05 | 22.81 | ||||
The phase constituents of the annealed alloys were examined by X-ray diffraction (XRD, Bruker D8 Advance, Germany) using a monochromatic CuKα (λ = 1.54056 Å) at 40 kV and 40 mA. The metallographic samples were first observed by optical microscopy (Leica DMLP, Germany) and then analyzed by electron probe microanalysis (EPMA, JXA-8230, JEOL, Japan) employing pure Mg (99.9 wt%), Zn (99.9 wt%) and Zr (99.9 wt%) as standard for microstructure observation and phase composition measurement.
All the annealed alloys were studied by XRD and EPMA to clarify the phase identification and the compositions. The nominal compositions and phase compositions are listed in Table 1.
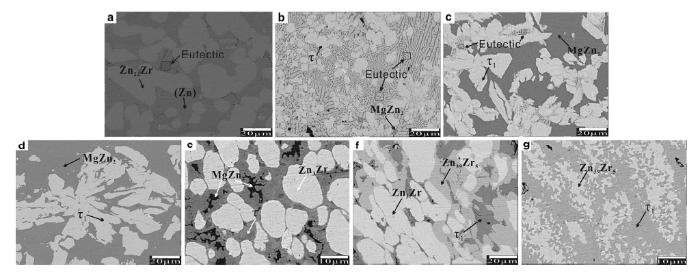
The phase equilibria in the Zn-rich corner of the alloys #1-7 were investigated. Depending on the composition, the alloys #1-3 were annealed for 15 days while the alloys #4-7 were annealed for 30 days. Backscattering electron (BSE) images and XRD patterns of the Mg-Zn-Zr alloys are shown in Figs. 1 and 2, respectively. A ternary phase named as τ1 with homogeneity range Mg(7-17)Zn(80-88)Zr(4-6) was detected in the alloys #2-7. Based on the results from EPMA and XRD, the τ1 phase in this work is confirmed corresponding to the reported IM4 phase by Zhang et al. [21].
Fig. 1 BSE micrographs of the Mg-Zn-Zr representative alloys annealed at 400 °C: a #1; b #2; c #3; d #4; e #5; f #6; g #7
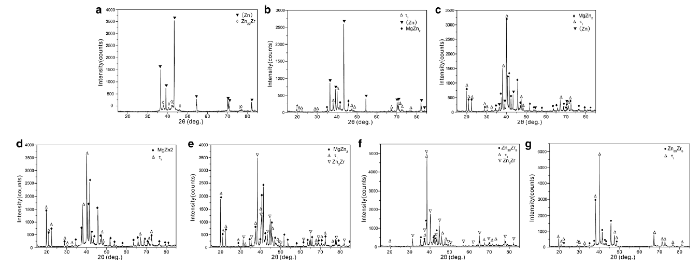
Fig. 2 XRD patterns of the Mg-Zn-Zr typical alloys annealed at 400 °C: a #1; b #2; c #3; d #4; e #5; f #6; g #7
From the micrograph of the annealed alloy #1 presented in Fig. 1a, we can see that Zn22Zr, (Zn) and some eutectic microstructure were observed in the alloy. The eutectic microstructure is corresponding to the liquid phase at the annealing temperature, which solidified into eutectic microstructure during quenching in cold water. The eutectic microstructure should be constituted by two phases of Mg2Zn11 and (Zn) based on the Mg-Zn binary phase diagram. However, due to the limited amount and the tiny size of the Mg2Zn11 phase in the alloy, only Zn22Zr and (Zn) were detected in the XRD pattern of the annealed alloy #1, as shown in Fig. 2a. Thus, a three-phase equilibrium Zn22Zr + (Zn) + liquid was obtained in the annealed alloy #1 at 400 °C.
As shown in Fig. 1b, a light phase with the average composition of Mg7.5Zn86Zr6.5, named as τ1, and some eutectic microstructures as well as a small amount of MgZn2 were observed in the annealed alloy #2. MgZn2 and the eutectic microstructure were formed from the liquid phase during quenching after annealing based on Mg-Zn binary phase diagram. The eutectic microstructure should be constituted by two phases of Mg2Zn11 and (Zn), as that in the annealed alloy #1. The average composition of the liquid was determined as Mg8Zn92by EPMA. The solubility of Zr in liquid phase is negligibly little. (Zn), τ1 and MgZn2 were detected in the XRD pattern of the alloy, while Mg2Zn11 was not detected due to the limited amount and the tiny size, as shown in Fig. 2b. Thus, a two-phase equilibrium of τ1 + liquid was observed in the alloy #2.
As shown in Fig. 1c, three phases were observed in the annealed alloy #3. The light phase is τ1, while the gray phase is MgZn2. The composition of τ1 was detected to be Mg8Zn88Zr4. Figure 1d shows that the annealed alloy #4 is located in a two-phase region of MgZn2 + τ1. The composition of τ1 in the alloy #4 was identified as Mg9Zn87Zr4. The XRD patterns of the annealed alloys #3 and #4 are presented Fig. 2c, d, respectively. Based on the results of the alloys #3 and #4, a three-phase region of MgZn2 + τ1 + liquid and a two-phase region of MgZn2 + τ1 were determined, respectively.
According to the XRD and EPMA results of the annealed alloy #5, a three-phase region consists of MgZn2 + Zn3Zr + τ1 was detected. As shown in Fig. 1e, the light phase is Zn3Zr, the gray phase is τ1, and the dark phase is MgZn2. The XRD pattern is consistent with the EMPA results, as presented in Fig. 2e. However, the present result is different from that by Zhang et al. [21], who reported a three-phase equilibrium of MgZn2 + IM4 + IM1.
Based on the XRD and EPMA results of the alloy #6 annealed at 400 °C for 30 days, as shown in Figs. 1f and 2f, a three-phase region of Zn3Zr + Zn39Zr5 + τ1 was determined. The composition of τ1 was detected to be Mg15Zn80Zr5. Similarly, a two-phase equilibrium of τ1 + Zn39Zr5 was determined based on the micrograph and the XRD pattern of the annealed alloy #7.
According to the results of the annealed alloys #1-7, the phase relationship of Mg-Zn-Zr in Zn-rich at 400 °C was determined. The homogeneity ranges of τ1 were detected to be Mg(7-17)Zn(80-88)Zr(4-6). Besides, the solubility of Mg in the Zn3Zr, Zn39Zr5 and Zn22Zr is negligibly little at 400 °C. However, the single phase of τ1 was not successfully prepared. The crystal structure of this phase is still need to study in a future work.
Three more ternary compounds, IM1, IM2 and IM3, were reported by Zhang et al. [21]. The crystal structure and prototype of IM1 were determined to be MgZn2 structure type with the hexagonal structure and P63/mmc space group. But the crystal structure and prototype of the IM2 and IM3 have not been determined. In the current work, the six key alloys #8-13 were prepared to investigate the phase relationship of these compounds.
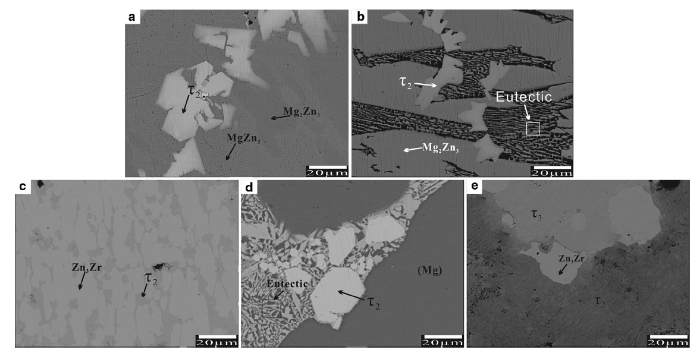
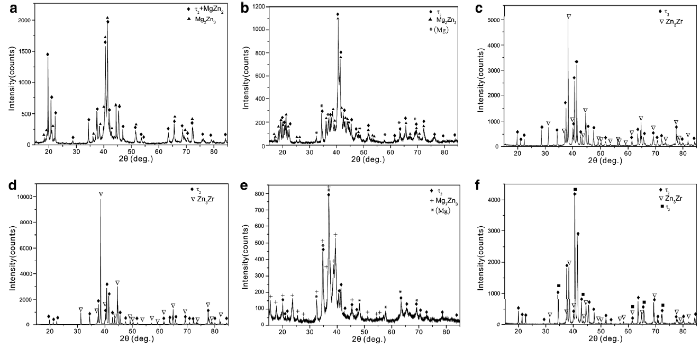
EPMA results of the alloy #8 annealed at 400 °C for 30 days are presented in Fig. 3a. Although the color contrast of MgZn2 and Mg2Zn3 is very small due to their similar composition, the phase boundaries of these two phases are clearly visible. The third gray phase, named as τ2, is significantly different from the MgZn2 and Mg2Zn3. The grain size of τ2 is comparatively large, and the average composition of τ2 was detected to be Mg15.6Zn67Zr16.1. The XRD pattern of the alloy #8 can be indexed perfectly by Mg2Zn3 and MgZn2 as shown in Fig. 4a. The light gray phase τ2 in Fig. 3a corresponds to the IM1 phase by Zhang et al. [21], of which the crystal structure and prototype were also determined to be MgZn2structure type. Because there is a small deviation on the atomic size of Mg (r = 0.16 nm) and Zr (r = 0.159 nm), no clear shift of peaks was observed on the XRD patterns of τ2 from those of MgZn2. This was also supported by the results of the annealed alloys #9 to #13. As shown in Fig. 3b, three phases were observed in the alloy #9 annealed at 400 °C for 30 days: the gray Mg2Zn3 phase, the liquid phase, which solidified into the eutectic microstructure including (Mg) during quenching, and the light phase τ2. The average composition of τ2 was detected to be Mg19.4Zn67Zr13.1 by EPMA, as listed in Table 1. The XRD patterns agree well with the EPMA results, as shown in Fig. 4b. Therefore, two three-phase equilibria of MgZn2 + Mg2Zn3 + τ2 and Mg2Zn3 + liquid + τ2 were detected by the annealed alloys #8 and #9, respectively. Both the annealed alloys #10 and #11 are in a two-phase region of Zn3Zr + τ2. BSE micrograph of the alloy #11 is presented in Fig. 3c. And the compositions of τ2 are measured to be Mg22Zn68Zr10 and Mg16Zn68Zr16 in the alloys #10 and #11, respectively. As presented in Fig. 4c, d, no clear shift of peaks was observed in the XRD patterns of τ2. BSE micrograph and XRD patterns of the alloy #12 annealed at 400 °C for 30 days, as shown in Fig. 3d, e certified that the alloys are located in a three-phase region of (Mg) + liquid + τ2.
Fig. 3 BSE micrographs of the Mg-Zn-Zr typical alloys annealed at 400 °C: a #8; b #9; c #11; d #12; e #13
Fig. 4 XRD patterns of the Mg-Zn-Zr typical alloys annealed at 400 °C: a #8; b #9; c #10; d #11; e #12; f #13
Since the content of Zr in the alloy #13 is high, the alloy was annealed at 400 °C for 40 days in order to get homogeneity. As shown in Fig. 3e, there are three phases: the light Zn3Zr phase, the dark τ2 phase and the gray phase named as τ3. The composition of τ3 was measured to be Mg9Zn68Zr23, which corresponds to IM3 [21]. As shown in the BSE micrographs, the τ2 phase is so inhomogeneous, which could be attributed to the insufficient annealing time. However, because the alloy is very brittle and the amount is small, no further annealing was carried out in this work. XRD patterns of the alloy are presented in Fig. 4f, and it is easy to identify three phases: τ2, Zn3Zr and Zn2Zr. Considerately, τ3 should be in the structure of Zn2Zr because no other phase was observed in the XRD results.
Based on the EPMA and XRD results of the alloys #8-13, two ternary phases τ2 and τ3 were detected. The homogeneity ranges of τ2 and τ3 were evaluated as Mg(15-22)Zn(66-68)Zr(9-16) and Mg9Zn68Zr23, respectively. The results show that the IM1 and IM2 phases reported by Zhang et al. [21] are in fact one phase, which is named as τ2 in this work. No Zn2Zr3phase was observed in the present work, which is different from the reported result by Ren et al. [20]. The solubility of Zr in MgZn2 and Mg2Zn3 phases is negligible, which is also different from the reported result by Ren et al. [20] that the solubility of Zr in the MgZn2 intermetallic compound reaches about 15.35 at.%.
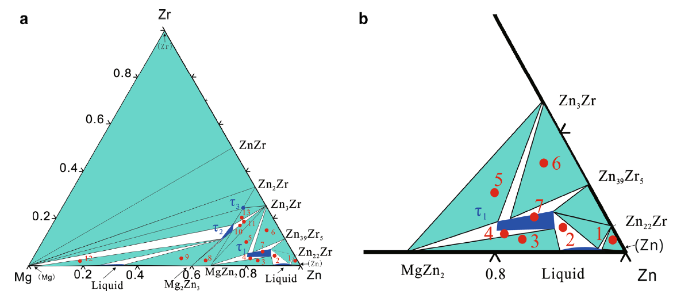
Based on the present experimental data, the isothermal section at 400 °C of the Mg-Zn-Zr is constructed in Fig. 5a. Eight three-phase regions and four two-phase regions were determined based on phase analysis of 13 annealed alloys. Three ternary phases, τ1, τ2 and τ3, were presented in the isothermal section. The solubility of the third component in binary phases is negligible. For a better review, the phase relationship in Zn-rich corner is shown in Fig. 5b.
Fig. 5 a Isothermal section of Mg-Zn-Zr ternary system at 400 °C, b partial isothermal section of Mg-Zn-Zr in Zn-rich corner at 400 °C
Isothermal section at 400 °C of the Mg-Zn-Zr was determined and constructed by using the equilibrated alloy method in the present work. Three ternary phases, τ1, τ2 and τ3, stably exist at 400 °C, and the homogeneity ranges of them were, respectively, determined to be Mg(7-17)Zn(80-88)Zr(4-6), Mg(15-22)Zn(66-68)Zr(9-16) and Mg9Zn68Zr23. The crystal structure of τ1 is still unclear. The crystal structure of τ2 was determined to be a MgZn2 structure type, and τ3 should be in the structure of Zn2Zr. The maximum solubility of Mg in Zn22Zr, Zn39Zr5and Zn3Zr phases was measured to be 0.52, 0.37 and 0.99 at.%, respectively. While the solubility of Zr in MgZn2 and Mg2Zn3 phases is negligible. Eight three-phase regions (Zn22Zr + (Zn) + liquid, MgZn2 + τ1 + liquid, MgZn2 + τ1 + Zn3Zr, Zn3Zr + τ1 + Zn39Zr5, Mg2Zn3 + MgZn2 + τ2, τ2 + Mg2Zn3 + liquid, τ2 + (Mg) + liquid, τ2 + τ3 + Zn3Zr) and four two-phase regions (τ1 + liquid, τ1 + MgZn2, τ1 + Zn39Zr5, τ2 + Zn3Zr) were determined by EPMA and XRD.
Acknowledgements The financial supports from the National Key Research and Development Plan (No. 2016YFB0701202) and the National Natural Science Foundation of China (Grant No. 51771235) are greatly acknowledged.
The authors have declared that no competing interests exist.

 WeChat
/
| 〈 |
|
〉 |