Search for articles:
Hua-Ping Tang , Chuan Lei
Corresponding authors:
Received: 2019-03-1
Revised: 2019-04-18
Online: 2019-12-10
Copyright: 2019 Editorial board of Acta Metallurgica Sinica(English Letters) Copyright reserved, Editorial board of Acta Metallurgica Sinica(English Letters)
More
Abstract
This study examines the relationship among cooling rate, microstructure and mechanical properties of a sand-casted Al-5.0Mg-0.6Mn-0.25Ce (wt%) alloy subjected to T4 heat treatment (430 °C × 12 h + natural aging for 5 days), and the tested alloys with wall thickness varying from 5 to 50 mm were prepared. The results show that as the cooling rate increases from 0.22 to 7.65 K/s, the average secondary dendritic arm spacing (SDAS, λ2) decreases from 94.8 to 27.3 μm. The relation between SDAS and cooling rate can be expressed by an equation: $\lambda_{2} = 53.0R_{\text{c}}^{ - 0.345}$. Additionally, an increase in cooling rate was shown not only to reduce the amount of the secondary phases, but also to promote the transition from Al10Mn2Ce to α-Al24(Mn,Fe)6Si2 phase. Tensile tests show that as the cooling rate increases from 0.22 to 7.65 K/s, the ultimate tensile strength (UTS) increases from 146.3 to 241.0 MPa and the elongation (EL) increases sharply from 4.4 to 12.2% for the as-cast alloys. Relations of UTS and EL with SDAS were determined, and both the UTS and EL increase linearly with (1/λ2)0.5 and that these changes can be explained by strengthening mechanisms. Most eutectic Al3Mg2 phases were dissolved during T4 treatment, which in turn further improve the YS, UTS and EL. However, the increment percent of YS, UTS and EL is affected by the cooling rate.
Keywords:
Al-Mg alloys have a reputation for providing good ductility, excellent corrosion resistance and high specific stiffness, and thus they have been found to be applied in a variety of industries ranging from consumer packaging to automation and shipbuilding [1, 2]. As the Al-Mg alloys undergo solidification, several impurities containing Fe are introduced to form at inter-dendritic regions and compromise the ductility of the overall alloy. Several secondary phases such as eutectic Al3Mg2 and the needlelike Al3Fe appear within the microstructure due to segregation of alloying elements [3]. The presence of these secondary phases can degrade the mechanical properties severely and even cause the brittleness of the alloys [4]. To relieve the harmful effect of these impurities on the mechanical properties of Al-Mg alloys, a T4 heat treatment (involving solution treatment) and natural aging process are commonly utilized to dissolve the eutectic Al3Mg2 phase [5, 6]. Mn is then added to the alloys to modify the morphology of Fe-rich intermetallic compounds [7]. Recent research has also reported that the addition of Ce to Al alloys can refine Fe-rich intermetallic compounds, leading to an improvement in strength [8].
The mechanical properties of Al-Mg alloys are mainly dependent on their internal microstructure, and thus the factor relating to thermal parameters and alloy compositions is the major effect on these properties. The cooling rate is one of the important thermal parameters and can greatly affect the microstructure of the alloy. Increasing cooling rate not only reduces the primary and secondary dendrite arm spacings of α-Al phase, but also affects the Al3Mg2 eutectic phase and Fe-/Mn-rich intermetallic phase during solidification [9]. Specifically, a high cooling rate may inhibit the formation of the Al3Mg2 eutectic phase and also refine Fe-/Mn-rich phases. Therefore, it is expected that Al-Mg alloys treated at higher cooling rates will have higher strength obtaining a higher tolerance of Fe and Si contents in Al-Mg alloys. Zhang et al. [10] studied the effect of extreme rapid cooling rates on the microstructure and properties of die-casted Al-Mg-Mn alloy, and the results showed that an extremely rapid cooling rate is beneficial to improve mechanical properties. Liu et al. also reported that a higher cooling rate can inhibit the formation of Fe- and Mn-rich phases [11] and thus improve the mechanical properties of Al-Mg-Mn alloy manufactured using continuous strip casting methods [12].
Varying the Mg content will change the effect of the cooling rate on the microstructure, thereby also changing the macroscopic properties of the alloys. Increasing Mg content increases the difference between liquidus and solidus temperatures [13]. Therefore, if the cooling rate is kept constant while Mg content is high, the solid solution limit of Mg in the final solidified area will be reached more quickly and more Al3Mg2 phase will be present at boundary areas. The increased presence of Al3Mg2 phases will lead the material to become more brittle decreasing the strength and ductility of the alloys. Gomes et al. [14], however, revealed a different trend: The ultimate tensile strength increases slightly, while the elongation decreases gradually with the increase in the cooling rate for Al-1.2Mg-1.5Fe cast alloys. In his study, as Mg content ranged from 1.2 to 7.0% at low cooling rates, the ultimate tensile strength is nearly constant, while the elongation increased significantly. As it is known, the relationship between the microstructure and properties Al-Mg alloys is quite complex and can be affected greatly both by cooling rate and alloying composition.
Combining with these results in Refs. [10, 11, 14], it can also be reasoned that the mechanical properties of Al-Mg alloys with moderate-to-high Mg content may be more susceptible to cooling rate than that of Al-Mg alloys with low Mg content. When the cooling rate varies between low and medium, the microstructure and properties may change significantly for Al-Mg alloys with moderate-to-high Mg content. Though the cooling rate at lower ranges may have a measurable effect on the microstructure and properties of alloys, there are very few studies for examining these relationships. These studies will greatly benefit sand casting, which is known to have a relatively low cooling rate, and most Al-Mg alloy castings are sand-casted due to their severe cracking tendency in permanent gravity casting [15].
This study aims to investigate the effect of cooling rate (ranging from 0.22 to 7.65 K/s) on the microstructure and mechanical properties of sand-casted Al-5.0Mg-0.6Mn-0.25Ce alloys (wt%) under the as-cast and T4-treated conditions. The relationships among cooling rate, microstructure characteristics and the mechanical properties are examined under the as-cast condition, in turn, providing more data for commercial production. Additionally, the effect of cooling rate on the mechanical properties under T4-treated condition is also given attention.
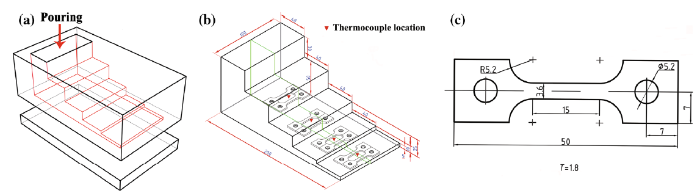
An ingot with a composition of Al-5.0Mg-0.6Mn-0.25Ce was melted in an iron crucible in an electrical resistance furnace at 730 °C. To prevent impurity iron from melting into Al melt, a mixed coating of sodium silicate and zinc oxide powder was brushed on the iron crucible during the melting process. The melt was degassed with 0.2 wt% C2Cl6 before pouring into a tailor-made sand mold coated with graphite powder on the internal surface. The sand mold was made of self-hardening resin sand and preheated at 200 °C for 10 min in the drying oven. The design of the filling is shown in Fig. 1a. After pouring the melted Al into this mold, a step shape casting was obtained. The dimensions of the casting are shown in Fig. 1b.
Fig. 1 Schematic illustration of step shape sand mold a, casting b, the dimension for tensile specimen c (unit: mm)
Cooling curves were measured using a K-type thermocouple connected to a data acquisition system for determining the transformation temperature. The thermocouple was inserted into the midsection at the heights of each step, as shown in Fig. 1b. The cooling rates (Rc) were determined by the formula:
$R_{\text{c}} = \left( {T_{\text{Liq}} {-}T_{\text{Sol}} } \right)/\left( {t_{\text{Sol}} {-}t_{\text{Liq}} } \right),$ (1)
where TLiq and TSol are the liquidus and solidus temperatures (°C), while tLiq and tSol are the times from the cooling curves corresponding to liquidus and solidus temperatures, respectively. The chemical composition of the alloys after casting was measured by using an inductively coupled plasma optical emission spectrometer and the result of composition is given in Table 1. The as-cast alloys were subjected to T4 heat treatment, which is comprised of a solution treatment at 430 °C (below 450 °C, the melting point of Al3Mg2 phase) for 12 h, followed by the quenching of the sample into an ice water bath, and finally performing a natural aging process at room temperature for 5 days, which was used to simulate the practical production times.
Table 1 Chemical composition of the as-cast alloy (wt%)
| Mg | Mn | Ce | Si | Fe | Al |
|---|---|---|---|---|---|
| 4.91 | 0.67 | 0.23 | 0.29 | 0.10 | Bal. |
Samples for microstructure analysis and tensile tests were taken from the central area of each step as shown in Fig. 1b. The dimension of the tensile specimen is shown in Fig. 1c. The samples for microstructure analysis were prepared and etched with Keller’s reagent. The phases in the as-cast alloys were identified using a poly-functional X-ray diffractometer (XRD) with a Cu Kα source operating at 25 kV, 50 mA and a scanning rate of 5°/min. Microstructural observation was performed using a Zeiss Axio Observer A1 optical microscope (OM) and a FEI NOVA 230 field-emission scanning electron microscopy (SEM) equipped with an AZtec X-Max 80 X-ray energy-dispersive spectroscope (EDS). The secondary dendritic arm spacing (SDAS) was measured using the linear intercept method under an examination of 30 micrographs at 100× magnification. The average area fraction of Al3Mg2 and Mn-rich phase was measured using Image Pro-Plus 6.0 software by examining 30 SEM micrographs. Furthermore, transmission electron microscopy specimens were cut from the ends of the tensile specimen. The cut wafers were then mechanically thinned to ~ 100 μm in thickness, punched into 3-mm disks, and twin-jet-electropolished in a solution of 4 vol% perchloric acid and 96 vol% ethanol cooled to about - 30 °C. TEM observation was accomplished using a JEM-2100 transmission electron microscopy operating at 200 kV.
Vickers hardness testing was carried out on polished specimens at a load of 5 N and a holding time of 10 s. Each result is determined as the average value of six hardness measurements. Moreover, the tensile test was conducted on Zwick/Roell Z020 tensile machine with an initial strain rate of 1.6 × 10⁻⁴ s-1 at room temperature. The three tests were conducted for each cooling rate, and the average value was recorded.
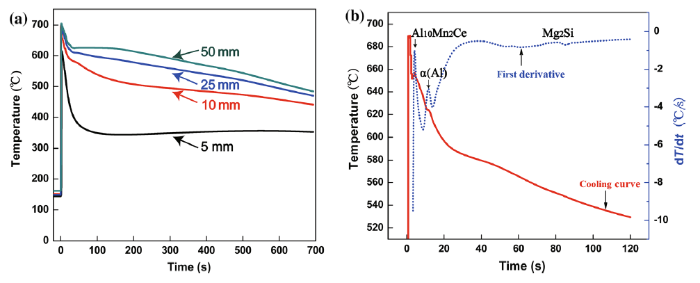
Figure 2a shows the cooling curves of the as-cast Al-5.0Mg-0.6Mn-0.25Ce alloys with different thicknesses. From this figure, a clear observation is that the solidification time varies dramatically with the casting thickness. To determine the transformation temperatures of the new phases during the solidification process, the first derivative of the cooling curve was graphed. The cooling curves for the as-cast alloy (with a thickness of 10 mm) and the corresponding first derivative are shown in Fig. 2b. As shown in Haq et al. [16], inflection points on the derivative curve correlate the formation of a new phase related to the transformation temperature. When analyzing the first derivative graph (Fig. 2b), three distinct inflection points can be observed correlating to three distinct phase transformations. Comparing the phase seen from the results of the data with the Al-Mn-Ce phase diagram shown in Coury et al. [17] and the Al-Mg-Mn phase diagram given by Yi et al. [18], it was determined that the inflection points found correspond to the formation of the Al10Mn2Ce phase, α(Al) dendrite phase and Mg2Si phase, respectively. It is evident that the formation of Al10Mn2Ce occurs first near the beginning of solidification, while the formation of Mg2Si comes last at the end of solidification. Thus, the cooling rates (Rc) are calculated using the slope of the cooling curve from the temperature range between liquidus and Mg2Si, and the results are given in Table 2. The corresponding cooling rates calculated for the thicknesses of 50, 25, 10 and 5 mm are 0.22, 0.33, 1.39 and 7.65 K/s, respectively. The range of the cooling rates and thicknesses analyzed in this study (from 0.22 to 7.65 K/s) are consistent with those used in Chen et al. [19] (which analyzed a cooling rate range of 0.19-6.25 K/s with the thickness varying from 4 to 30 mm).
Fig. 2 Cooling curves of the as-cast Al-5.0Mg-0.6Mn-0.25Ce alloys with different thicknesses a and the cooling curve (red solid line) and the corresponding first derivative (blue dashed line) of the as-cast alloy with a thickness of 10 mm b
Table 2 Solidification parameters of as-cast alloys with different thicknesses (T2: the formation temperature of α(Al); t2: the formation time of α(Al); T3: the formation temperature of Mg2Si; t3: the formation time of Mg2Si)
| Thickness (mm) | Rc (K/s) | ∆T (°C) | ∆t (s) | Al10Mn2Ce | α(Al) | Mg2Si | |||
|---|---|---|---|---|---|---|---|---|---|
| TLiq (°C) | tLiq (s) | T2 (°C) | t2 (s) | T3 (°C) | t3 (s) | ||||
| 50 | 0.22 | 69.7 | 419.1 | 654.2 | 15.2 | 626.4 | 31.2 | 556.7 | 450.3 |
| 25 | 0.33 | 69.8 | 292.3 | 656.1 | 11.5 | 626.5 | 20.0 | 556.6 | 312.3 |
| 10 | 1.39 | 79.0 | 71.6 | 657.1 | 4.3 | 629.2 | 9.6 | 550.2 | 81.4 |
| 5 | 7.65 | 63.9 | 8.4 | - | - | 614.8 | 2.5 | 550.9 | 10.8 |
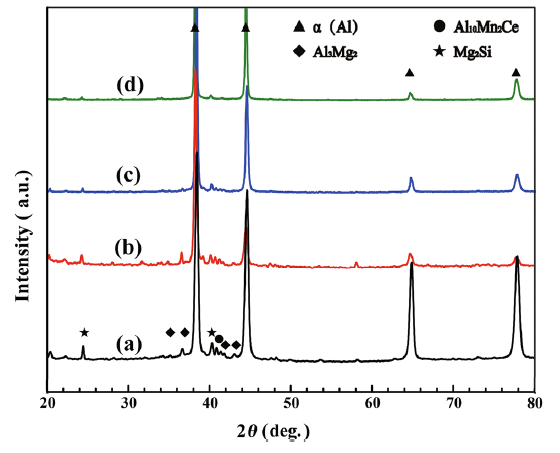
XRD was used to identify phases of the as-cast Al-5.0Mg-0.6Mn-0.25Ce alloys, and the results are shown in Fig. 3. It is shown that the as-cast alloy mainly consists of α-Al, Al3Mg2, Al10Mn2Ce and Mg2Si phases. As increasing cooling rates, the intensities of peaks from the secondary phases appear to decrease. These decreases are likely correlated with the decreases in the amount of secondary phases. Thus, it can be determined that at higher cooling rates, higher amounts of alloying elements are dissolved into the α-Al phase, thereby leaving less alloying elements to form the secondary phases.
Fig. 3 XRD patterns of the as-cast Al-5.0Mg-0.6Mn-0.25Ce alloys produced at different cooling rates: a 0.22 K/s; b 0.33 K/s; c 1.39 K/s; d 7.65 K/s
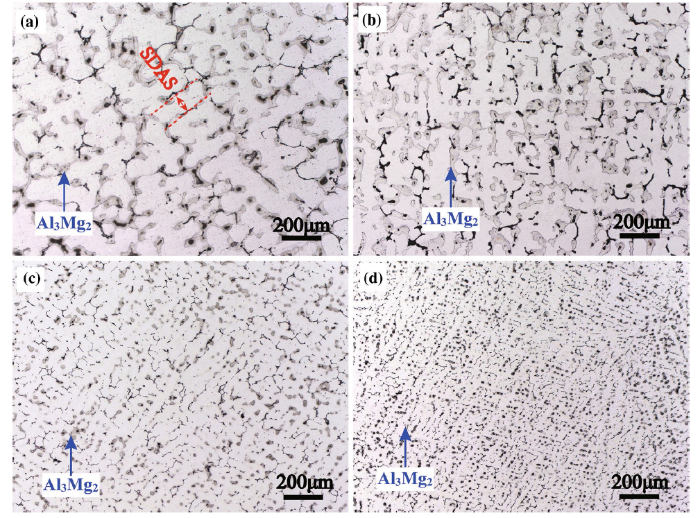
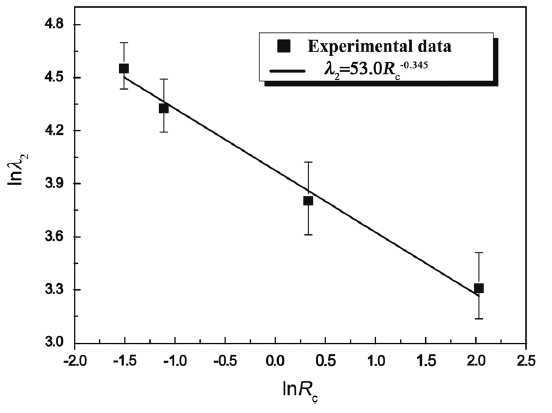
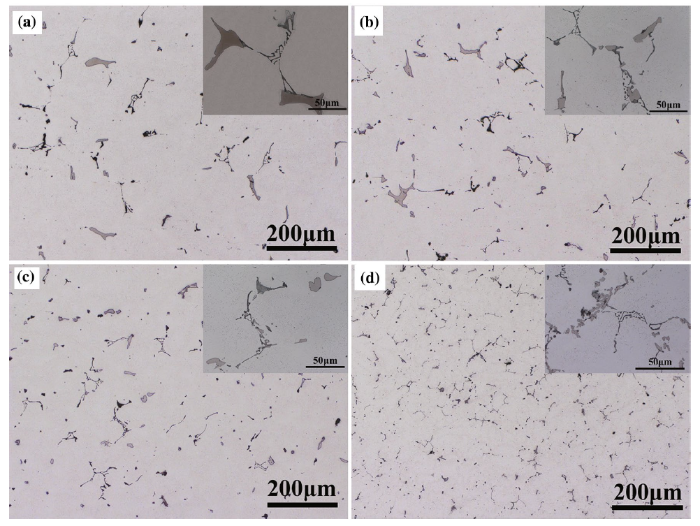
Figure 4 shows the optical microstructures of the as-cast Al-5.0Mg-0.6Mn-0.25Ce alloys. It is shown that the as-cast microstructure contains α(Al) dendrites, the eutectic Al3Mg2 phase and other secondary phases. The Al3Mg2 and other secondary phases are distributed in the inter-dendritic regions. It is evident that the cooling rate induces a considerable change in the microstructure with reduction in SDAS as shown in Fig. 4a-d. Measured values of SDAS are given in Table 3. A 70% reduction in SDAS is observed with an increase in the cooling rate from 0.22 to 7.65 K/s. The regression analysis through the data points of the cooling rate and SDAS shows that the SDAS is a function of the cooling rate (using data from Table 3) and can be represented by the following equation:
$\lambda_{2} = 53.0R_{\text{c}}^{ - 0.345} ,$ (2)
where λ2 represents the SDAS (in μm) and Rc represents the cooling rate (in K/s). Similar results are also reported in Al-11.0Mg alloys by Liu et al. [20] and Hosseini et al. [21]. These studies reported that increasing the cooling rate could increase the undercooling and the nucleating rates of α-Al, thereby reducing the SDAS, which is consistent with the results (Fig. 5) in this study.
Fig. 4 Optical microstructures of the as-cast Al-5.0Mg-0.6Mn-0.25Ce alloys under different cooling rates: a 0.22 K/s; b 0.33 K/s; c 1.39 K/s; d 7.65 K/s
Table 3 SDAS of α(Al) dendrites, area fraction (%) of Al3Mg2 and Mn-rich phases in the as-cast Al-5.0Mg-0.6Mn-0.25Ce alloys produced at different cooling rates
| Thickness (mm) | Rc (K/s) | SDAS (μm) | Area fraction (%) | |
|---|---|---|---|---|
| α(Al) Dendrite | Al3Mg2 phase | Mn-rich phase | ||
| 50 | 0.22 | 94.8 ± 13.2 | 21.5 ± 4.6 | 1.46 ± 0.15 |
| 25 | 0.33 | 75.7 ± 12.4 | 20.8 ± 3.8 | 1.40 ± 0.11 |
| 10 | 1.39 | 44.8 ± 9.5 | 8.7 ± 1.3 | 0.76 ± 0.10 |
| 5 | 7.65 | 27.3 ± 5.5 | 6.6 ± 0.9 | 0.67 ± 0.08 |
Fig. 5 Relation of SDAS with the cooling rate for the as-cast Al-5.0Mg-0.6Mn-0.25Ce alloys
Besides the effect on the SDAS, the cooling rate also appears to affect the amount and size of the eutectic Al3Mg2 phase. As the cooling rate increases from 0.22 to 7.65 K/s, the average area fraction of the Al3Mg2 phase decreases from 21.5 to 6.6%, as illustrated in Fig. 4 and Table 3. The reduction in the amount of Al3Mg2 meets expectations related to the decline in the peak intensity of Al3Mg2 from XRD results shown in Fig. 3. Furthermore, after comparing the Al3Mg2 phases in Fig. 4a, b with c, d, it is evident that the size of eutectic Al3Mg2 phase is reduced from a coarse network structure to a fine granular structure.
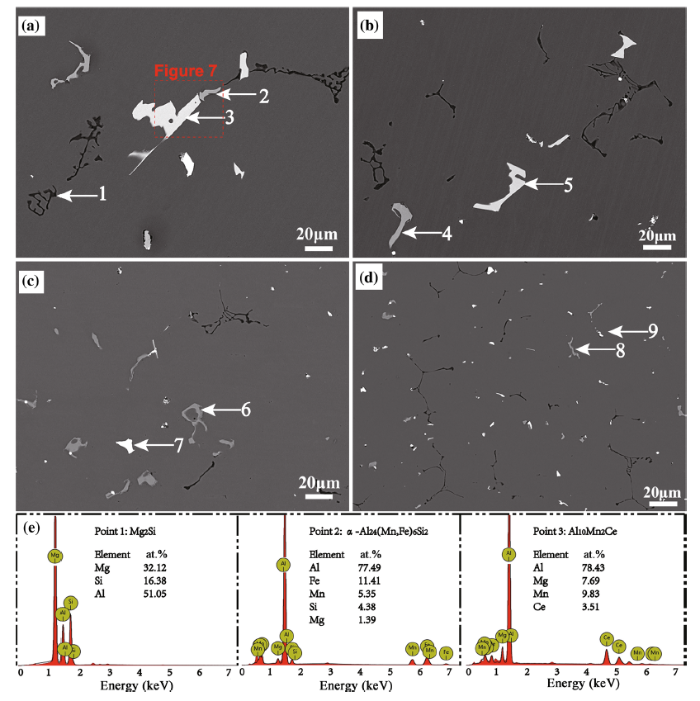
Figure 6 shows the SEM micrographs and quantitative EDS results of different points that are given in Table 4. The black phase represents the Mg2Si phase with a skeleton-like structure. The diagrams show that this phase is significantly reduced with the increase in the cooling rate. The white phases in Fig. 6a-d consist of Al, Mn and Ce elements and are considered to have a similar composition as Al10Mn2Ce. The gray-white phases in Fig. 6a-d consist of Al, Mn, Fe, Si and Mg elements with a composition analogous to the α-Al24(Mn,Fe)6Si2 phase. Because of the similar composition, the gray-white phase can be described as the α-Al24(Mn,Fe)6Si2 phase, a Mn-rich phase [22]. Furthermore, as the cooling rate increases from 0.22 to 7.65 K/s, the average length of the Mn-rich phase decreases from 34.8 to 6.6 μm and the average area fraction reduces from 1.46 to 0.76% (as shown in Table 3). Since the atomic numbers of Al and Mg are close, it is difficult to distinguish the eutectic Al3Mg2 from α-Al by SEM observation. Thus, the Al3Mg2 phases are not observed in Fig. 6. In summary, an increase in the cooling rate reduces the size and amount of the secondary phases for the as-cast alloys.
Fig. 6 SEM micrographs showing effect of the cooling rate on the secondary phases in the as-cast Al-5.0Mg-0.6Mn-0.25Ce alloys: a 0.22 K/s; b 0.33 K/s; c 1.39 K/s; d 7.65 K/s; e corresponding EDS results of points 1, 2 and 3
Table 4 EDS results of the secondary phases shown in
| Point | Al | Mg | Mn | Ce | Fe | Si | Identified phase |
|---|---|---|---|---|---|---|---|
| Figure 6a, 1 | 51.05 | 32.12 | 0 | 0 | 0.45 | 16.38 | Mg2Si |
| Figure 6a, 2 | 77.49 | 1.39 | 5.35 | 0.04 | 11.41 | 4.38 | α-Al24(Mn,Fe)6Si2 |
| Figure 6a, 3 | 78.43 | 7.69 | 9.83 | 3.51 | 0.54 | 0 | Al10Mn2Ce |
| Figure 6b, 4 | 77.94 | 1.74 | 6.31 | 0.02 | 10.35 | 3.63 | α-Al24(Mn,Fe)6Si2 |
| Figure 6b, 5 | 80.54 | 7.53 | 8.00 | 3.41 | 0.52 | 0 | Al10Mn2Ce |
| Figure 6c, 6 | 78.38 | 1.65 | 6.15 | 0 | 9.94 | 3.88 | α-Al24(Mn,Fe)6Si2 |
| Figure 6c, 7 | 80.99 | 7.53 | 7.75 | 3.21 | 0 | 0 | Al10Mn2Ce |
| Figure 6d, 8 | 77.30 | 3.37 | 7.38 | 0.10 | 8.13 | 3.72 | α-Al24(Mn,Fe)6Si2 |
| Figure 6d, 9 | 81.88 | 7.74 | 7.15 | 3.23 | 0 | 0 | Al10Mn2Ce |
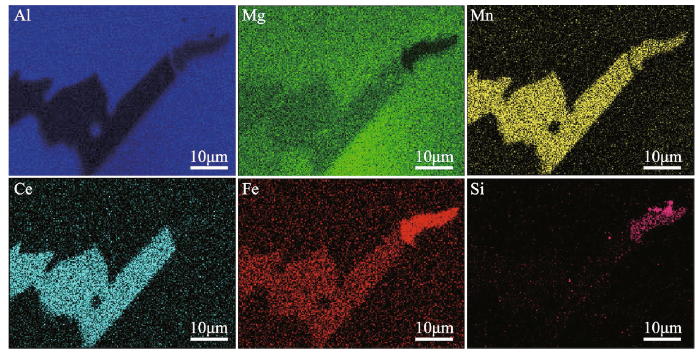
It is noteworthy that with the increase in the cooling rate, the percentage of Al10Mn2Ce in the Mn-rich phase decreases and that of α-Al24(Mn,Fe)6Si2 phase increases (as shown in Fig. 6). This means that an increase in cooling rate promotes the transition from Al10Mn2Ce to the Al24(Mn,Fe)6Si2 phase. EDS mapping analysis shown in Fig. 7 indicates that Ce exists primarily in the Al10Mn2Ce phase, rather than in α-Al24(Mn,Fe)6Si2 phase, showing that Ce tends to combine with Al and Mn to form Al10Mn2Ce phase. The cooling curve analysis in Fig. 2b shows that the formation temperature of the Al10Mn2Ce phase is much higher than that of the α-Al24(Mn,Fe)6Si2 phase during solidification. At low cooling rates (such as 0.22 and 0.33 K/s), the Al10Mn2Ce has more time to grow and consume more Mn. As a result, there is less Mn within the sample to form α-Al24(Mn,Fe)6Si2 phase. On the contrary, a higher cooling rate will cause less of the Al10Mn2Ce phase to form and a higher amount of the α-Al24(Mn,Fe)6Si2 phase is formed in the overall alloy.
Fig. 7 Concentration mapping of Al, Mg, Mn, Ce, Fe and Si in
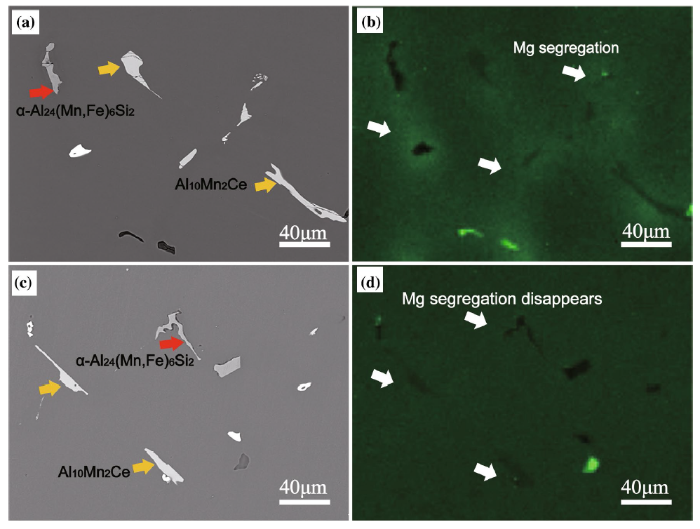
Figure 8 shows the optical microstructures of the T4-treated Al-5.0Mg-0.6Mn-0.25Ce alloys produced at different cooling rates. It is mainly composed of the α(Al) phase, Mn-rich phase and Mg2Si phase. When comparing the T4-treated alloy with the as-cast alloys, the eutectic Al3Mg2 phase is no longer present, while Mn-rich intermetallic and Mg2Si phase have remained. From these results, it is evident that the T4 treatment at 430 °C can dissolve most of Al3Mg2 phase but has a minimal impact on the Mn-rich intermetallic and Mg2Si phases. Figure 9 shows the appearance of the secondary phases and the corresponding EDS mapping of Mg element of Al-5.0Mg-0.6Mn-0.25Ce alloys under the as-cast and T4-treated conditions. Mg segregation occurs around the secondary phases in the as-cast condition, as shown in Fig. 9b. After T4 heat treatment, the Mg segregation disappears, as shown in Fig. 9d. It can be seen that Mg distribution in the T4-treated alloys is much more homogeneous than that of the as-cast alloys, while there are minimal changes in other secondary phases (such as the Mg2Si or Mn-rich phases). This phenomenon confirms that the Al3Mg2 phase is dissolved into α(Al) matrix during the T4 heat treatment. Additionally, the SDAS and area fraction of Mn-rich phase were measured and are given in Table 5. As shown in this table and Table 3, the SDAS and area fraction of Mn-rich phase do not have many differences between the T4-heat-treated and the as-cast samples.
Fig. 8 Optical microstructures of the T4-treated Al-5.0Mg-0.6Mn-0.25Ce alloys produced at different cooling rates: a 0.22 K/s; b 0.33 K/s; c 1.39 K/s; d 7.65 K/s
Fig. 9 SEM micrographs and the corresponding EDS mapping of Mg element of Al-5.0Mg-0.6Mn-0.25Ce alloys fabricated at a cooling rate of 0.22 K/s under different states: a, b as-cast; c, d T4-treated
Table 5 SDAS of α(Al) dendrites, area fraction (%) of Al3Mg2 and Mn-rich phase in the T4-treated Al-5.0 Mg-0.6Mn-0.25Ce alloys produced at different cooling rates
| Thickness (mm) | Rc (K/s) | SDAS (μm) | Area fraction (%) | |
|---|---|---|---|---|
| α(Al) dendrites | Al3Mg2 phase | Mn-rich phase | ||
| 50 | 0.22 | 100.8 ± 15.2 | ~ 0 | 1.43 ± 0.16 |
| 25 | 0.33 | 79.7 ± 12.4 | ~ 0 | 1.38 ± 0.13 |
| 10 | 1.39 | 50.8 ± 9.4 | ~ 0 | 0.72 ± 0.10 |
| 5 | 7.65 | 31.3 ± 5.7 | ~ 0 | 0.63 ± 0.08 |
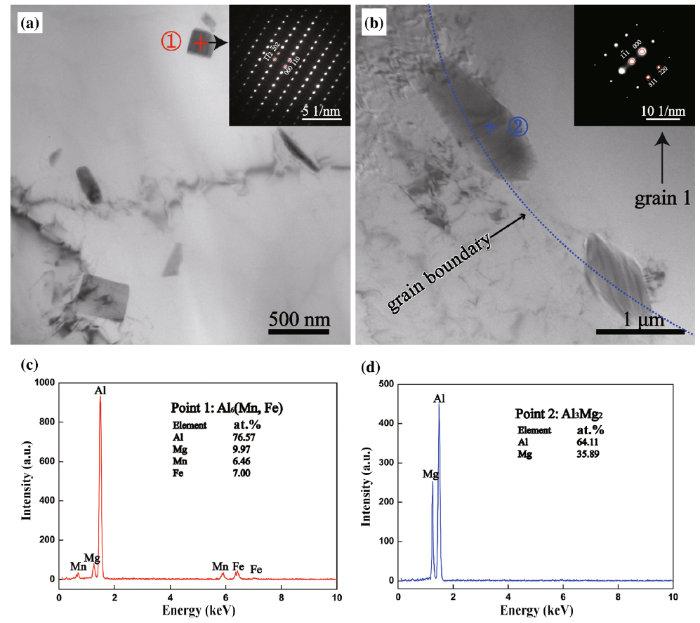
Figure 10 shows the typical TEM images for the T4-treated alloys fabricated at a cooling rate of 7.65 K/s. From Fig. 10a, some rodlike and block precipitates appear in Al matrix. The block particles ranged from 200 to 400 nm in size, while the apparent length and width of the rodlike particles varied from 300 to 500 nm and 80 to 120 nm, respectively. Given that the composition of this alloy is Al-5.0Mg-0.6Mn-0.25Ce, only several precipitates, including Al6Mn, Al6(Mn,Fe) and Al3Mg2, can form during solidification and heat treatment process [23]. According to the morphological characteristics of precipitates in Fig. 10a, these precipitates are more likely to be Mn-rich phases. The corresponding selected area diffraction (SAED) analysis on the block particle shows that it corresponds to the [111] zone axis of Al6Mn phase, which is consistent with the results reported by Yan et al. [23]. However, the EDS measurement shows that the block particle consists of Mn- and Fe-rich elements with an average composition analogous to the Al6(Mn,Fe) phase (Fig. 10c). Thus, according to the EDS measurement, this block dispersoid is Al6(Mn, Fe) phase, rather than Al6Mn phase. This may be due to the crystal structure of Al6Mn and Al6(Mn, Fe) phase. It has been reported that both Al6Mn and Al6(Mn, Fe) phases have an orthorhombic crystal structure with small differences in lattice parameters (a = 6.4978, b = 7.5518 and c = 8.8703 Å for Al6Mn, while a = 7.498, b = 6.495 and c = 8.8837 Å for Al6(Mn, Fe)) [24, 25]. In fact, both Al6Mn and Al6(Mn, Fe) precipitates can form in Al-Mg-Mn(-Fe) alloys [17]. These Mn-rich dispersoids will benefit to the formation of β-Al3Mg2 during sensitization at low temperature from 50 to 70 °C for several months [26]. However, few β-Al3Mg2 phases are found around these Mn-rich particles. Occasionally, several large precipitates ranging from 0.8 to 2.0 μm are found at the grain boundaries, as shown in Fig. 10b. The morphology and size of the precipitates are obviously different from those in Fig. 10a. The corresponding EDS measurement (as shown in Fig. 10d) indicates the precipitate is likely to be β-Al3Mg2 phase. It is known that the grain boundaries can act as diffusion channels for Mg atoms, leading to the formation of Al3Mg2 phase. From the TEM observation, it is clear that there are some dispersoids in Al matrix or at the grain boundaries, including Al6(Mn, Fe) and Al3Mg2 dispersoids. However, due to the large size and a small amount of them, the dispersion strengthening in this alloy is relatively limited.
Fig. 10 TEM images for the T4-treated alloys fabricated at a cooling rate of 7.65 K/s; a, b TEM bright-field images showing dispersoids in matrix and at grain boundary (the insets in a and b show the SAED patterns from the dispersoid and Al matrix, respectively; c, d the EDS results of dispersoids in matrix and at grain boundary)
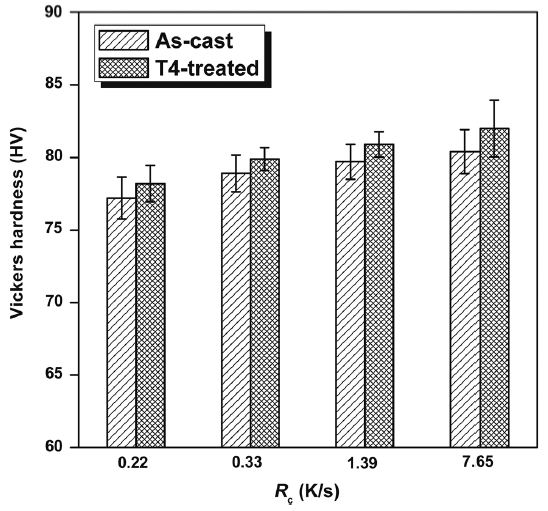
Figure 11 shows the Vickers hardness test results at various cooling rates under both the as-cast and T4-treated conditions. As the cooling rate increases from 0.22 to 7.65 K/s, the hardness value increases slightly from 77.4 to 81.2 HV. The Vickers hardness values after T4 treatment are a little higher when compared with those of the as-cast alloys.
Fig. 11 Vickers hardness versus the cooling rate for studied alloys under as-cast and T4-treated conditions
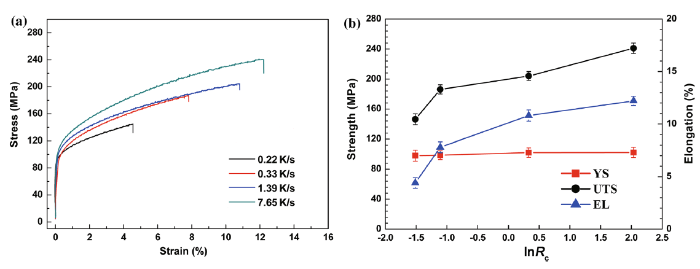
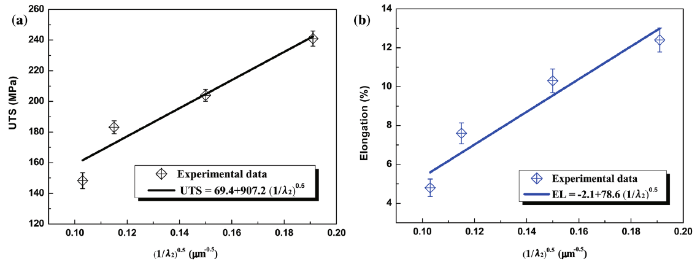
Tensile properties of the as-cast Al-5.0Mg-0.6Mn-0.25Ce alloys at different cooling rates are shown in Fig. 12. It is found that as the cooling rate increased from 0.22 to 7.65 K/s, the yield strength (YS) increased slightly from 98.1 to 112.8 MPa, the ultimate tensile strength (UTS) increased from 146.3 to 241.0 MPa, and the elongation (EL) increased from 4.4 to 12.2%. A regression analysis showed that both UTS and EL are functions of the SDAS, as shown in Fig. 13, and can be represented by the following equations:
${\text{UTS}} = 69.4 + 907.2({1 \mathord{\left/ {\vphantom {1 {\lambda_{2} }}} \right. \kern-0pt} {\lambda_{2} }})^{0.5} ,$ (3)
${\text{EL}} = - 2.1 + 78.6({1 \mathord{\left/ {\vphantom {1 {\lambda_{2} }}} \right. \kern-0pt} {\lambda_{2} }})^{0.5} ,$ (4)
where λ2 represents the SDAS (in μm), while UTS and EL represent ultimate tensile strength (MPa) and elongation (%), respectively. It can be seen that the UTS and EL significantly increase with the decrease in λ2 and they are proportional to (1/λ2)0.5. As discussed earlier, an increase in the cooling rate correlates with the refinement of the SDAS and secondary phases (Figs. 4, 7), causing an increase in elongation for the as-cast Al-5.0Mg-0.6Mn-0.25Ce alloys. As a result, higher UTS is obtained through the microstructure refinements and the strain hardening effect due to better ductility. Considering the relationship between Rc and λ2 in Eq. (2), it is evident that increasing the cooling rate reduces the λ2 and thus improves the UTS and EL based on Eqs. (3) and (4).
Fig. 12 a Typical tensile curves and b tensile properties of the as-cast Al-5.0Mg-0.6Mn-0.25Ce alloys produced under different cooling rates
Fig. 13 Relationship between SDAS and a UTS, b EL for as-cast Al-5.0Mg-0.6Mn-0.25Ce alloys
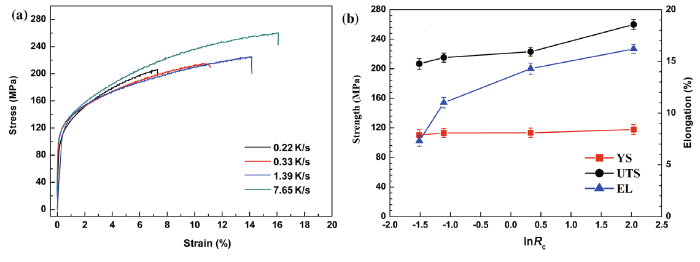
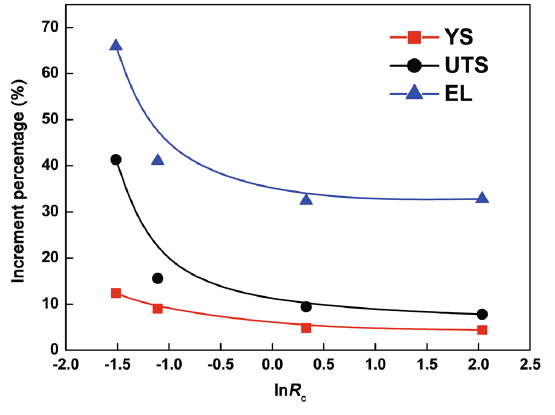
Figure 14 shows the mechanical properties of the T4-treated Al-5.0Mg-0.6Mn-0.25Ce alloys. After T4 heat treatment, both the strength (YS and UTS) and elongation are improved. The increment percentages of the change in strength and elongation before and after T4 heat treatment are shown in Fig. 15. It is obviously found that the increment percentage of YS, UTS and EL varies with the cooling rate. At a cooling rate of 0.22 K/s, the increment percentage of YS, UTS and EL reaches 12.4%, 47.0% and 65.9%, respectively, while at a cooling rate of 7.65 K/s, these values reach lower values of 4.4%, 7.8% and 32.7%, respectively. The increment percentages of strength and EL under low cooling rate condition are much larger than that under high cooling rate condition. Based on the above analysis, the T4 heat treatment improves mechanical properties of the as-cast Al-5.0Mg-0.6Mn-0.25Ce alloy and that the cooling rate has a significant effect on the increment of strength and EL. This phenomenon is likely due to the eutectic Al3Mg2 phases being more dissolved into the α(Al) matrix during the T4 treatment. Furthermore, a higher cooling rate will result in the production of less of the Al3Mg2 phase in the as-cast microstructure (as shown in Fig. 4), thus improving the YS, UTS and EL.
Fig. 14 a Typical tensile curves, b tensile properties of the T4-treated Al-5.0Mg-0.6Mn-0.25Ce alloys under different cooling rates
Fig. 15 Effect of the cooling rate on increment percentage of strength (YS and UTS) and elongation of alloys before and after T4 heat treatment, noting that the ‘increment percentage’ refers to the enhancement of properties compared to those of as-cast materials
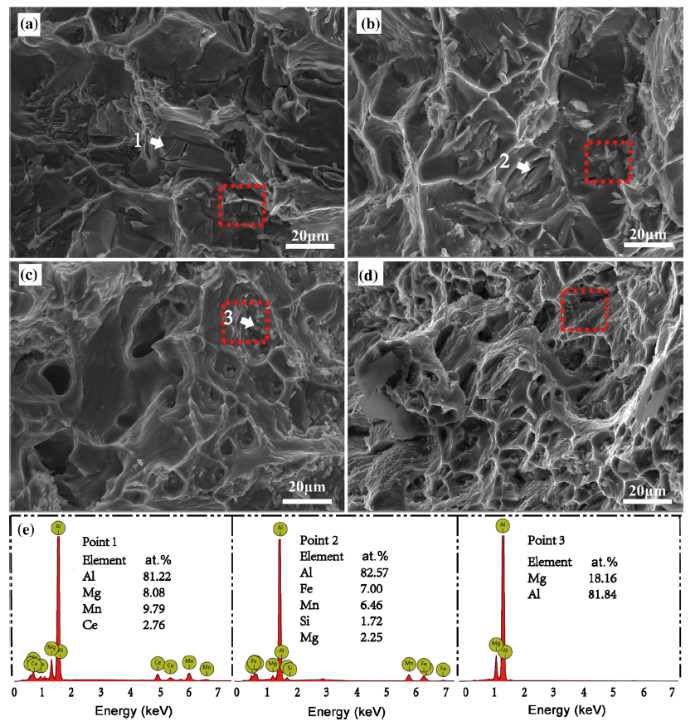
Figure 16 shows the fracture surfaces of the tensile specimens from the as-cast Al-5.0Mg-0.6Mn-0.25Ce alloys and the EDS results of the particles on the fracture surfaces. For the specimens under lower cooling rates, such as 0.22 and 0.33 K/s, a mixed fracture surface is observed. In these specimens, a fracture surface containing many cleavage planes, some fine broken phases (marked with red frame in Fig. 16) and minor dimples can be observed. According to the EDS results, these phases formed on the cleavage planes and fine broken phases are Mn-rich phases and Al3Mg2 phases, respectively. It seems that these phases tend to break first during tensile tests and lead to the initiation of micro-cracks. Therefore, alloys treated at lower cooling rates will tend to exhibit characteristics similar to brittle fractures. As the cooling rate increases to 1.39 and 7.65 K/s, the fracture surface shows more and more dimples, indicating that the alloy has become more ductile. This finding agrees with the results of tensile tests depicted in Fig. 12. The improvement in ductility is attributed to the refinement of α(Al) dendritic and homogeneous distribution of finer secondary phases caused by higher cooling rates.
Fig. 16 SEM micrographs of fractured tensile specimens from the as-cast Al-5.0Mg-0.6Mn-0.25Ce alloys at different cooling rates: a 0.22 K/s; b 0.33 K/s; c 1.39 K/s; d 7.65 K/s; e EDS results of particles on fracture surfaces
Above observation on the fracture surfaces indicates that the cooling rate affects ductility significantly of the as-cast alloys, and these Mn-rich phases and Al3Mg2 phases play an important role during the fracture process. This can be explained well by the stress concentration. It is known that high local stress concentrations occur during the tensile process and that the bonding force between the atoms is damaged by this stress concentration. As a result, some voids may begin to form in the Al matrix. With the continuous tensile process, three-dimensional stress concentrations form on micro-holes and the growth and coalescence of these voids create fracture sources. For the alloys analyzed, there are many brittle secondary phases where stress concentrations can form around, leading to the formation of micro-cracks and, in turn, poor ductility. On contrary, the refinement of α(Al) dendritic and the homogeneous distribution of secondary phases reduces the formation of these stress concentrations, improving the ductility of the as-cast alloys.
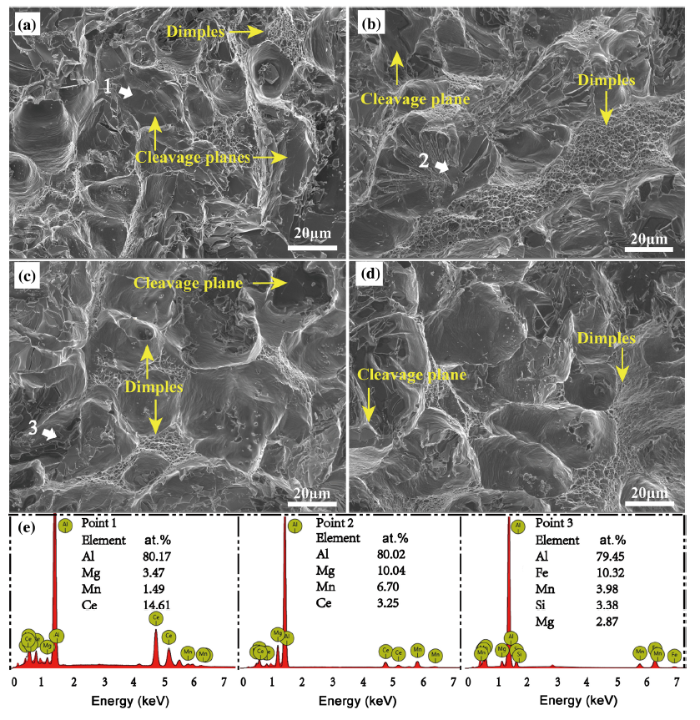
Figure 17 shows the fracture surfaces of the T4-treated specimens and the EDS results of the particles on the fracture surfaces. From this figure, it can be seen that many dimples and some cleavage planes are present on the fracture surfaces for all specimens. Also, the compositions of the cleavage plane obtained by EDS measurements are shown in Fig. 17e. These phases consist of Mn-, Fe- and Ce-rich elements, with similar compositions shown in Fig. 16. With the increase in the cooling rate, more dimples appear on the fracture surface, indicating a positive correlation between higher cooling rates and ductility. When compared with the as-cast specimens, no fine broken phases are observed in the T4-treated samples. These fine broken phases depicted in the as-cast specimens disappear after T4 heat treatment, which implies that this granular phase is the broken eutectic Al3Mg2 phase. The dissolution of the brittle Al3Mg2 phase not only reduces the amount of secondary phases, but also provides an increased number of sites of fine dimples, therefore improving the ductility significantly.
Fig. 17 SEM micrographs of fractured tensile specimens from the T4-treated Al-5.0Mg-0.6Mn-0.25Ce alloys at different cooling rates: a 0.22 K/s; b 0.33 K/s; c 1.39 K/s; d 7.65 K/s; e EDS results of particles on fracture surfaces
From the examination of the as-cast microstructure of Al-5.0Mg-0.6Mn-0.25Ce alloys under different cooling rates, it can be deduced that the cooling rate plays a key role in the refinement of α-Al and intermetallic compounds. When the cooling rate increases from 0.22 to 7.65 K/s, both SDAS and the amount of eutectic Al3Mg2 are significantly reduced.
During solidification, α-Al tends to exhibit dendritic growth, and statistical results show that the relationship between SDAS (λ2) and cooling rate (Rc) can be described well by an exponential equation, as shown in Eq. (2). This relation between them can be explained by the growth of secondary dendritic arms of multicomponent proposed by Rappaz et al. [27] and is given by:
$\lambda_{2} = 5.5(Mt_{\text{SL}} )^{{{1 \mathord{\left/ {\vphantom {1 3}} \right. \kern-0pt} 3}}} ,$ (5)
where tSL is the local solidification time and M is dependent on the Gibbs-Thomson coefficient (Γ), the liquidus slope (mL), the final liquid composition (cf) at the dendrite root, and the final solid composition (c0). The solidification time, tSL, is converted into a cooling rate using the relationship [27]:
$t_{\text{SL}} = {{\Delta T} \mathord{\left/ {\vphantom {{\Delta T} {R_{\text{c}} }}} \right. \kern-0pt} {R_{\text{c}} }},$ (6)
where ΔT is the temperature interval between the liquidus and the eutectic onset, and Rc is the cooling rate. In the present work, ΔT is a constant, about 70 K, as shown in Table 2. Thus, the λ2 can be expressed as
$\lambda_{2} = 5.5(M{{\Delta }}T)/(3R_{\text{c}}^{ - 1/3} ).$ (7)
As described by the equation, the -1/3 theoretical exponent is nearly the same as the experimental exponent (-0.345, as shown in Fig. 5). With the increase in the cooling rate, the SDAS will be greatly reduced.
The final solidification zones are the regions with triangle grain boundaries and inter-dendrites, where the intermetallic compounds will be formed. The refinement of α-Al grains results in the increase in these regions with triangle grain boundaries and inter-dendrites. Due to the increase in the number of these regions, the intermetallic compounds formed in the final solidification zones are extremely refined and distributed more even at higher cooling rate.
With the growth of primary α-Al, the solute Mg is enriched at the solid/liquid interface front during solidification. Once the composition of the remaining liquid in the final solidification zones has reached the eutectic composition, the eutectic reaction L → α-Al + Al3Mg2 occurs. However, with the increase in the cooling rate, the solidification process may transform to a non-equilibrium state and solute trapping will occur. In this case, the local non-equilibrium diffusion effect in bulk liquids plays an important role in solute redistribution at the interface. This leads to a diffusionless solidification with a complete solute trapping at a finite interface velocity, as demonstrated for binary alloy solidification [28, 29]. According to this solute trapping theory, more solute Mg will be dissolved in α-Al with the increase in the cooling rate. This means that the remaining solute Mg in the final solidification zone is reduced and less of the Al3Mg2 phase is formed.
The results of tensile tests show that both UTS and EL increase significantly with the decrease in λ2 for the as-cast Al-5.0Mg-0.6Mn-0.25Ce alloy and the relationships between them can be expressed by experimental formulas:
${\text{UTS}} = 69.4 + 907.2({1 \mathord{\left/ {\vphantom {1 {\lambda_{2} }}} \right. \kern-0pt} {\lambda_{2} }})^{0.5} ,$ (8)
${\text{EL}} = - 2.1 + 78.6({1 \mathord{\left/ {\vphantom {1 {\lambda_{2} }}} \right. \kern-0pt} {\lambda_{2} }})^{0.5} .$ (9)
Interestingly, similar formulas describing the relationships between the UTS, EL and λ2 had also been reported in the cast Al-9.0Si [30] and Al-4.5Cu alloy [31]. However, these relationships have not been clearly examined and a corresponding model for these relationships has not been developed.
The strength of the as-cast alloys changes with the variation in secondary dendritic arm spacing (SDAS, λ2), solute concentration, as well as phase components and their fractions (Tables 2, 3, 4), which are all influenced by the cooling rate. In order to understand empirical formulas related to these alloys, the following relationships among the cooling rate, microstructure characteristics and strengthening mechanisms should be considered. Firstly, strengthening mechanisms are related to the grain boundary strengthening, solute solution strengthening and strain hardening for the as-cast Al-5.0Mg-0.6Mn-0.25Ce alloy. As the cooling rate increases during solidification, the λ2 begins to decrease, leading to finer α-Al grains and an improvement in UTS due to grain boundary strengthening. Secondly, as discussed in Sect. 4.1, the solute Mg concentration in α-Al matrix increases with the decrease in λ2. This helps to enhance the UTS by solute solution strengthening. Moreover, secondary phases, such as Mn-rich phase and Al3Mg2, show finer size and better distribution with the refinement of λ2, leading to higher ductility. As a result, an enhancement of strain hardening is obtained. In summary, these strengthening mechanisms related to UTS are directly or indirectly influenced by the λ2, which in turn is directly controlled by the cooling rate. Thus, it seems reasonable that the UTS can be expressed by Eq. (8).
It should be noted that although there is a clear relationship among cooling rate, microstructure and strength (as discussed above), it is difficult to distinguish how the cooling rate contributes (whether through an interplay between SDAS, solute concentration, phase components and their fractions) to UTS using the relationship between SDAS and UTS. In fact, it is difficult to calculate the contribution to strength accurately by experimental research due to complexities of the as-cast microstructures. To more accurately examine this relationship, simulation calculation studies would likely be much more effective. A dislocation plug model [32] could likely also be used to analyze this relationship. Although the experimental equations using Rc, λ2, UTS and EL are not perfectly accurate, these mathematical models are useful tools that can be used to manipulate the relation of cooling rate with the tensile properties of the as-cast Al components. For example, Quarema et al. [31] used the experimental formulas in Al-4.5Cu cast alloy to predict the effect of foundry processes on the final mechanical properties of alloys with relatively accurate degree.
After the T4 heat treatment, both strength and elongation of T4-treated alloys increased when compared with the as-cast alloys. For these as-cast alloys, eutectic Al3Mg2 phases are present at the grain boundaries. After the T4 heat treatment at 430 °C for 12 h, most of eutectic Al3Mg2 phases were dissolved in the α-Al matrix. As a result, the brittle phases were reduced, resulting in the reduction in stress concentrations. Additionally, the disappearance of Al3Mg2 phase will correlate with an increase in SDAS, indicating an increased dislocation slip distance. Because of both the reduction in brittle phases and an increase in SDAS [33], the elongation of the alloy can greatly increase. Moreover, the strength also increases due to an enhancement of the solid solution strengthening and strain hardening processes. The amount of eutectic Al3Mg2 phases is also influenced by the cooling rate. More eutectic Al3Mg2 phases are formed under low cooling rates condition, while less eutectic Al3Mg2 phases are formed under high cooling rates condition (Fig. 4). Thus, the incremental percentage of strength (YS and UTS) and elongation under different cooling rates is different, as shown in Fig. 14. Higher increments are obtained at low cooling rate (0.22 and 0.33 K/s), while lower increments are obtained at high cooling rate (1.39 and 7.65 K/s).
(1) The effect of the cooling rate on the microstructure and mechanical properties of Al-5.0Mg-0.6Mn-0.25Ce alloy was investigated systematically at cooling rates between 0.22 and 7.65 K/s. By increasing the cooling rate from 0.22 to 7.65 K/s, the average SDAS is greatly reduced from 94.8 to 27.3 μm. The relationship between SDAS (λ2) and the cooling rate fits well with the following equation: $\lambda_{2} = 53.0R_{\text{c}}^{ - 0.345}$. Additionally, increasing the cooling rate will not only refine the secondary phases, but also promote the transition from Al10Mn2Ce to α-Al24(Mn,Fe)6Si2 phase.
(2) By increasing the cooling rate, the tensile properties of the as-cast alloys are significantly improved. As the cooling rate increases from 0.22 to 7.65 K/s, the UTS increases from 146.3 to 241.0 MPa and the EL increases from 4.4 to 12.2%. Experimental equations of the UTS and EL with SDAS (λ2) have been proposed and can be represented by the formulas: UTS = 69.4 + 907.2(1/λ2)0.5 and EL =-2.1 + 78.6(1/λ2)0.5, respectively.
(3) The cooling rate affects the incremental percentage of both strength and elongation caused by T4 treatment. A higher increment is obtained at a lower cooling rate, while a lower increment is obtained under a higher cooling rate. This is related to the effect of the cooling rate on the amount of the Al3Mg2 phase. The T4 heat treatment dissolves most of the eutectic Al3Mg2 phase in the as-cast microstructure, further improving the YS, UTS and EL of the as-cast alloys.
(4) With increasing the cooling rate, the fracture mode transforms from mixed fracture to a more ductile fracture for the as-cast alloys, while the fracture mode is a ductile fracture for the T4-treated alloys.
This work was supported financially by the National Natural Science Foundation of China (No. 51674166). Also, many thanks are given to Colin Luo for his editing work in English, who is from University of Calgary in Canada.
The authors have declared that no competing interests exist.

 WeChat
/
| 〈 |
|
〉 |