Search for articles:
Krzysztof Siemek , Mirosław Kulik
Corresponding authors:
Received: 2018-08-30
Revised: 2018-12-5
Online: 2019-10-10
Copyright: 2019 Editorial board of Acta Metallurgica Sinica(English Letters) Copyright reserved, Editorial board of Acta Metallurgica Sinica(English Letters)
More
Abstract
The defects created in commercial dental alloys during blasting with alumina particles propelled in compressed air under pressure 0.1 and 0.4 MPa have been studied using positron annihilation spectroscopy, scanning electron microscopy and X-ray diffraction. It was observed that higher pressure causes the increase in roughness and damaged zone range. The type of defects was determined as vacancies on dislocations. The defect concentration decreases with the depth and depends on alloys’ type and applied pressure. The Rutherford backscattering spectroscopy and variable energy positron beam studies indicate shallow alumina deposition in material and show that small pressure of 0.1 MPa is not enough to remove metal surface oxides completely in 60 s in all studied dental alloys.
Keywords:
Dental restorations are used to restore the function, integrity and morphology of a missing tooth structure and to resolve aesthetic problems. Commonly used implants have a two-layer structure. The outer veneer layer, which ensures aesthetic, is built from weak ceramics or composite connected with a strong supporting core made of ceramics or metal alloys [1, 2]. Previously, nobles-based alloys were used as base metals. In current trends these alloys are started to be replaced by NiCr and CoCr alloys, due to their lower price and excellent mechanical properties [3, 4]. Allergenic problems have raised some barriers in the use of Ni-containing alloys. CoCr alloys are regarded as more biocompatible and therefore, more adequate in dental restorations [4].
The oxide layer present on the metal surface has a great influence on the metal-veneer bond strength [3, 4, 5]. Base metal alloys are formed by elements that are able to be passivated, especially chromium. These oxides and organic contaminants are mostly removed through sandblasting. One of the challenges in Cr containing alloys is controlling the excessive formation of chromium oxide that results in lower bond strength between base metals and veneer [4]. After sandblasting some abrasive particles remain and adhere to the blasted surface and can positively influence the adhesion properties of a material [4, 5, 6, 7, 8]. The alumina retention issue was studied using X-ray energy-dispersive spectroscopy (EDS) technique by Al Jabbari et al. [5], and it was shown that aluminum content after sandblasting depends on grit size, compression air pressure and alloy composition and equals from 8 to 26 atomic percentage. In some clinical cases these alumina particles are removed by ultrasonic cleaners.
Despite the benefits of sandblasting this process also induces subsurface damages and generation of the residual stress [9, 10]. Each single abrasive particle can be treated as bullet launched on the surface. The impact of hit depends on particle mass and its velocity likewise direction of the collision angle. Essentially, the bigger particles and higher compression of air used to propel the blasting material cause the higher deformations of subsurface zone. The direction of blasting nozzle is also very important. In work [11], stainless steel samples were subjected to blasting under different angles between a nozzle and a sandblasted surface. Small collision angles generate smaller concentration of defects beneath sandblasted surface; however, the strong erosion of surface was also observed in this case. The maximal erosion occurred for angle 30° [11]. Other studies proved erosion increases for small sandblasting angles, i.e., for copper reaches maximal value between 10° and 20° [12]. In dental restoration mostly perpendicular sandblasting is applied. The ranges of defected zone depend on sandblasting parameters and materials properties, as well [7, 13, 14].
To remove defects induced during manufacturing temperature treatment above the recrystallization temperature should be used. This happens during porcelain firing. During such process lattice defects should disappear and residual stress should relax and transform into tensile stress [7, 13, 15]. However, when the polymer veneers are used and no thermal treatment is applied defects remain in the structure [5].
It is commonly known that structural defects change mechanical properties of a material. For example, ab initio calculations performed by Zhu et al. [16] for α-Zr showed that increasing vacancy concentration up to 3% decreases both the bulk modulus and ductility, but increases the shear and Young’s moduli and hardness. It was also pointed out that vacancy clusterization strengthens these changes. However, accumulation of vacancies during material fatigue also contributes to cracking. Nowadays, the new techniques appear and make possible studies of connection among material properties and lattice defects type and concentration. Among others such method is positron annihilation spectroscopy (PAS). This is a suitable tool for the detection of open-volume defects such as vacancies, their clusters, dislocations, voids. It allows one to recognize type of introduced structural defects and their depth profile. The successful application of PAS in studies of damages in materials is well documented in the literature [11, 14, 17].
The major aim of these studies is to recognize crystalline defects induced by sandblasting in Cr-Co, Cr-Ni, Cr-Ni-Fe dental alloys with the stream of alumina particles propelling compressed air under pressure 0.1 or 0.4 MPa. These alloys were chosen as the typical materials subjected to sandblasting due to negative influence on bonding strength between metal and the veneers caused by surface oxides, especially chromium oxides. The main focus of the present study is to determine the depth profiles of structural defects concentration and evaluation of their type. The second goal is focused on estimation of the effectivity of erosion process and evaluation of oxide thickness after sandblasting treatment using Rutherford backscattering and variable energy positron beam spectroscopy methods. Additionally, X-ray diffraction (XRD) technique, hardness measurements, scanning electron microscopy (SEM) and atomic force microscopy (AFM) have also been used to characterize the materials.
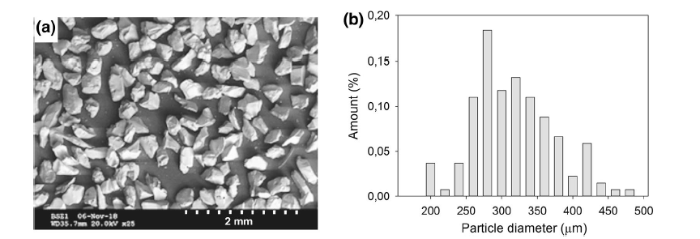
Commercial dental alloys Polycast, I-GW, Magnum AN and I-MG were used in this study. Their chemical composition is shown in Table 1 (data taken from the manufacturer). These alloys are based mostly on transition metals such as Ni, Fe, Co, Mo and contain around 25% of Cr. Here, we will call these alloys A, B, C and D, respectively. All samples in cylinder shape with a diameter of 8 mm and 5 mm thickness were cut from a rod. Then, the samples were polished and they were annealed at about 1000 °C for 2 h in vacuum of 10-3 Pa and slowly cooled down to the room temperature. This procedure allowed one to prepare specimens with only residual defects in conditions protected from oxidation. Two samples were saved as reference ones, while the others were exposed to the surface treatment. Sandblasting was performed using Renfert Vario Basic Jet blaster. The abrasive material Edelkorund containing 99.8% aluminum oxide (Al2O3) was applied. The Al2O3 particles had irregular shapes and sharp edges (Fig. 1a), and particle average size (evaluated over 200 particles) was equal to 320 ± 30 μm. The size distribution of Al2O3 is shown in Fig. 1b. The surfaces were blasted for 60 s under the pressure of 0.1 or 0.4 MPa with the distance of 10 mm between the sample and perpendicularly directed nozzle. The blasting direction perpendicular to surface was chosen as it is the most commonly used in dental prosthetic practice. The nozzle size was 1 mm. There were always two specimens prepared for each employed pressure for future studies.
Table 1 Chemical composition of the alloys used for examinations. In brackets the name of manufacrurer is given
| Description | Alloy | Element (wt%) | |||||||
|---|---|---|---|---|---|---|---|---|---|
| Cr | Ni | Fe | Co | Mo | Si | Mn | Nb | ||
| Alloy A | Polycast (Bilkim Ltd. Co.) | 26 | 62 | 0.15 | n/a | 10 | 1.4 | n/a | 0.35 |
| Alloy B | I-GW (Interdent d.o.o) | 24.5 | 62.5 | 1.5 | n/a | 10 | 1.5 | n/a | n/a |
| Alloy C | Magnum AN (Mesa di Sala Giacomo & C. S.N.C) | 24 | 26 | 44 | 0.1 | 3 | 3 | 1.2 | 0.35 |
| Alloy D | I-MG (Interdent d.o.o) | 29.5 | n/a | n/a | 62.5 | 5.5 | 1.2 | n/a | n/a |
Fig. 1 a SEM images of alumina particles used during sandblasting. b Size distribution of abrasive particles
The positron lifetime (LT) measurements were performed using digital spectrometer APU-8702RU with detectors based on the BaF2 scintillators. The timing resolution equaled about 180 ps. The isotope 22Na with activity 27 μCi enveloped into two 5-μm-thick titanium foils was placed between two identical samples. The analysis of obtained spectra including 5 × 10⁶ counts was provided with LT 9.2 program [18]. The source contribution, background and finite time resolution were taken into account as adjustable parameters in the deconvolution procedure. The source contribution was equal to 15% and consisted of two components: the first one 242 ps (with intensity 97%) and the second one 952 ps (3%).
Doppler broadening of annihilation line (DB) measurements was performed using two methods with conventional encapsulated 22Na source with activity of 15 μCi. The DB experiments were provided using HPGe detector with energy resolution of 1.20 keV for energy 511 keV. Each obtained spectrum was analyzed to calculate annihilation line shape parameter called S parameter. It is given as the ratio of the area below the central part of annihilation peak to the total area in the range of this line. The value of the S parameter is extremely sensitive to the open-volume defects which trap positrons and increases when their concentration increases. However, the dependency is not linear and can also be sensitive to the size and type of defects.
The depth of damaged layer obtained after sandblasting is about dozens of micrometers [11, 19]. It has been proved in many experiments that sequential removing of layer by chemical etching and measurements of annihilation characteristics make it possible to detect the depth profile in an accurate way [11, 14, 20]. Chemical etching does not produce any defects which could disturb the initial defect depth distribution. So, in our studies the samples were etched in the mixture of nitric acid and hydrochloric acid in a molar ratio 1:3. The thin layer of about 5 µm was sequentially removed in this mixture. The thickness of the sample was measured using digital micro-screw with accuracy ± 2 µm. The LYS-1 program based on multi-scattering model [21] was used to evaluate amount of positrons which annihilate in the near-surface region up to 5 µm. During calculations the absorption coefficient α was calculated using equation:
α=12.6$\frac{Z^{0.17}\rho}{E_{max}}$ (1)
where ρ is density (g/cm3), Z is mean atomic number, and Emax is maximal positron energy emitted from radioisotope. Calculations show that around 20% of positrons annihilate in such layer of 5 µm thickness. The most changes observed in S parameter come from passing of positrons from the near-surface region before etching to new surface after removing a thin layer. This allows one to reveal deeper region of samples and track changes of S parameter beneath the surface.
The third method employs linear accelerator working at Joint Institute of Nuclear Research in Dubna, Russia [22]. Firstly, the positrons emitted from 22Na source are moderated using frozen neon and then accelerated to desired energies in the range from 50 eV up to 35 keV. This lets us to control the mean positron implantation depth of positrons in studied material. In the current report the S parameter dependency in a region up to 1.4 µm was studied.
The Rutherford backscattering spectrometry and nuclear reaction (RBS/NR) [23, 24] is a method widely used for near-surface region analysis. The main objective of performed measurements was to determine the oxygen concentration before and after sandblasting. The RBS measurements were conducted using incident angle α =75°, exit angle β = 65°, scattering angle θ = 170° and 4He+2 energy 3.045 MeV at Joint Institute of Nuclear Research. Although RBS discriminates strongly against light elements in a heavy substrate, such as oxygen in the metal alloys lattice, the use of the resonant reaction 16O(α, α)16O at 3.04 MeV is very beneficial, as its cross section is nearly 23 times as that of the Rutherford cross section [25].
The surface characterization was performed using a scanning electron microscope (Tescan Vega3 SBH) and an atomic force microscope (AFM/STM SOLVER Nano, NT-MTD).
A TUKON™ 2500 instrument manufactured by Wilson Instruments—an Instron Company, Norwood, MA, USA, was used for the micro-hardness measurement of reference samples. The Vickers method with a load of 29.42 N (HV10) was applied. The requirements and recommendations of the ISO 4545 standard were met.
X-ray diffraction (XRD) patterns of the samples of alloys A and B were taken in the 2θ range from 20° to 130° with a step of 0.03°. For these measurements the parallel beam of the filtered Cu radiation was applied on a Panalytical Empyrean diffractometer. XRD patterns of the samples of alloys C and D were carried out with the filtered Co radiation using a Bruker D8 Advance diffractometer (the 2θ range from 40° to 125°, step of 0.03°). Panalytical software HighScore Plus v.3.0e (3.0.5) was used for the XRD pattern analysis.
XRD measurements have shown that all tested alloys are mainly γ-phase (i.e., the face-centered cubic phase, the space group No. 225) metals with a slightly different lattice parameter. For reference alloys the lattice parameter was determined to be equal to 3.5864(2) Å, 3.5867(3) Å, 3.587(1) Å and 3.568(1) Å for the alloys A, B, C and D, respectively. Results of the Rietveld analysis showed that all alloys, except the D one, almost exclusively contain fcc phase. For the alloys B and C a share of this phase was close to 99%; for the alloy A, it was a little lower and close to 95%. The hexagonal phase with the space group No. 194 (called the ε-phase) was the second phase of the all tested alloys. The alloy D can be considered as a two-phase material with ca. 35% of the hexagonal phase. In the alloy C also small contribution of σ-phase (i.e., the body-centered tetragonal phase, the space group No. 136) was noted.
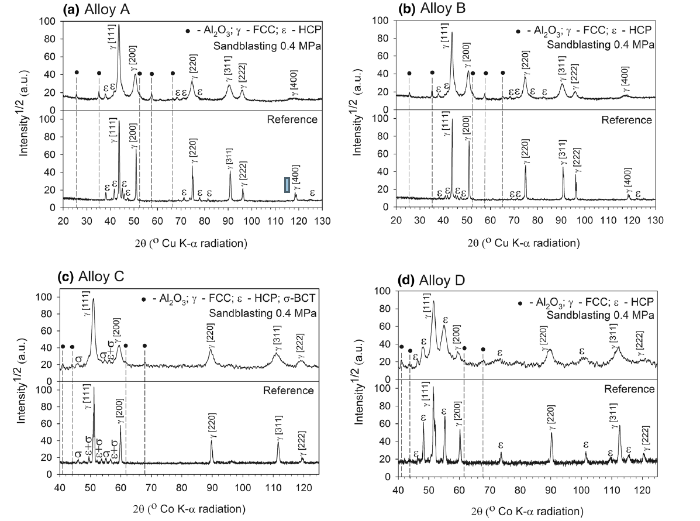
Some new diffraction peaks have been registered on the diffraction patterns of all sandblasted samples. These peaks correspond to Al2O3 used for the abrasive blasting (Fig. 2). It is noted the alumina retention on sandblasted surface or in the subsurface layer. Moreover, in Fig. 2 one can see that diffraction peaks from metals are broadened and their positions are shifted toward the lower 2θ angles, which indicates the presence of the crystal lattice strains. Such effects can be related to some lattice defects generated in the plastically deformed subsurface zone.
Fig. 2 XRD pattern for dental alloys before and after sandblasting under the air pressure 0.4 MPa
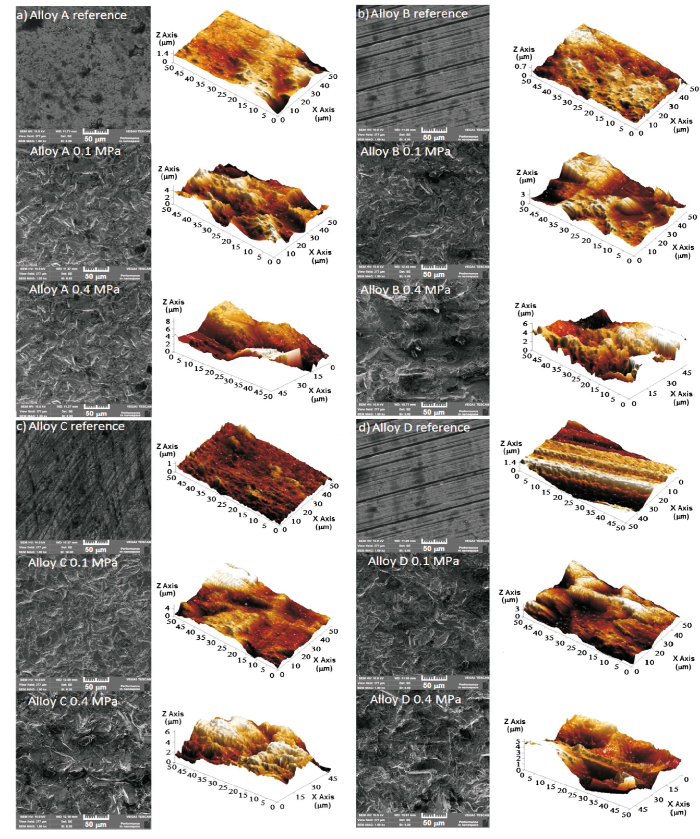
The morphological changes in surface after sandblasting can be well visible using an atomic force microscope and a scanning electron microscope (Fig. 3). Before sandblasting a lot of scratches exist as a result of polishing. Multiple hitting of abrasive materials creates a lot of sharp edges, valleys, hills and pits. They can be characterized by average roughness Ra. This parameter for each sample was determined using Image Analysis 3.5 and ImageJ as an average over five independent areas of size 50 µm × 50 µm and 100 µm × 100 µm. The results of this procedure are collected in Table 2. All samples before sandblasting had low roughness smaller than 0.3 µm. After sandblasting under air stream pressure of 0.1 MPa the increment in the Ra to value ca. 0.8 µm is observed. Four times higher pressure gives only small growth in Ra in comparison with 0.1 MPa for dental alloys B, C and D. The air pressure hardly affects the roughness in these cases. The most efficient impact of pressure was noted for alloy A of which roughness increases from 0.88 µm up to 1.47 µm.
Fig. 3 SEM images and AFM profiles of each sample before (reference) and after sandblasting under air stream pressure 0.1 and 0.4 MPa. a-d The results for alloys A, B, C and D, respectively
Table 2 Average roughness Ra of dental alloys before (reference) and after sandblasting under air stream pressures 0.1 and 0.4 MPa
| Alloy | Average roughness Ra (µm) | ||
|---|---|---|---|
| Reference | Sandblasting 0.1 MPa | Sandblasting 0.4 MPa | |
| A | 0.18 (1) | 0.88 (4) | 1.47 (7) |
| B | 0.11 (1) | 0.77 (4) | 1.08 (5) |
| C | 0.11 (1) | 0.83 (4) | 1.03 (5) |
| D | 0.26 (1) | 0.85 (4) | 0.93 (5) |
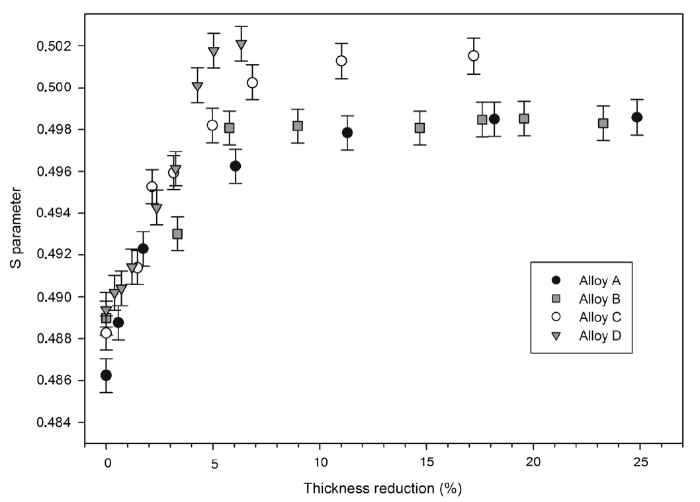
Positron lifetime measurements were performed to determine the type of the lattice defect generated during sandblasting. Firstly, the LT spectra were recorded for all alloys after annealing, sandblasting and compression under 15 × 105 N load in hydraulic press (maximum thickness reduction of samples in Fig. 4). Only single lifetime component was resolved from the lifetime specters in all samples, and its values are collected in Table 3. For annealed sample its value is about 115 ps and this corresponds to the bulk value for pure, well-annealed metals, i.e., chromium 120 ps, iron 111 ps, nickel 109 ps and cobalt 119 ps [26]. It was found that the positron lifetime component value for sandblasted samples slightly increases with pressure and does not exceed the value determined for the pressed samples. In both cases plastic deformation appears; however, during sandblasting the deformed zone is limited and dependent on the applied pressure. It is worth noting that compression process produces also only single lifetime component, which is very similar to the one obtained for sandblasted samples. Such situations occur when all positrons find a defect of the same type and annihilate only from trapped state, i.e., defects concentrations are very high. It indicates that deformed regions after sandblasting are much larger than subsurface region analyzed by positrons. Obtained lifetimes are lower than monovacancies’ lifetimes calculated for chromium—184 ps—or for nickel—182 ps [26]—which are major components of the alloys A and B. It is known that for plastically deformed iron the positron trapped at a vacancy associated with dislocation gives a theoretical positron lifetime value ranging from 140 to 170 ps depending on the relative position of the vacancy on the dislocation line [27]. Obtained lifetimes are comparable to the positron lifetime of 158 ps for a cold-rolled Ni and Fe [28] and arc-melted high-entropy alloys Fe26Cr25Co25Ni24 for which it is equal to 160 ps [29]. This shows that in blasted alloys studied in the present work almost only monovacancies on dislocation lines are present.
Fig. 4 S parameter as a function of thickness reduction in compression for commercial dental alloys
Table 3 Positron lifetime (ps) of dental alloys before (annealed) and after sandblasting under air stream pressures 0.1 and 0.4 MPa. The table also includes positron lifetime measurements for samples pressed under 15 ton
| Alloy | Positron lifetime (ps) | |||
|---|---|---|---|---|
| Annealing | Sandblasting 0.1 MPa | Sandblasting 0.4 MPa | Compression load 15 × 105 N | |
| A | 116 (1) | 159 (1) | 167 (1) | 171 (1) |
| B | 114 (1) | 150 (1) | 157 (1) | 160 (1) |
| C | 116 (1) | 153 (1) | 164 (1) | 165 (1) |
| D | 115 (1) | 147 (1) | 148 (1) | 150 (1) |
In many studies the retention of alumina particles after sandblasting was observed [4, 5, 6, 7, 8]. In the current study, this effect was registered on the XRD patterns. However, in recorded lifetime spectrum evidence of remains of Al2O3 was not found. This could be caused by two reasons. In the literature it is reported that the value of the mean positron lifetime in Al2O3 at room temperature is equal to 150 ps [30]. Previous results for polycrystalline Al2O3 show two components of positron lifetime, e.g., τ1 = 159 ± 8 ps, τ2 = 720 ± 30 ps, I2 = 2.2% [31]. We also measured LT spectrum for the abrasive powder Al2O3 used also in the present research and obtained single lifetime component of 164 ± 2 ps. Unfortunately, the value of positron lifetime in Al2O3 is similar for defects created during sandblasting in used alloys and cannot be easily separated, especially when the intensity of this component is low. The second more important reason is a shallow deposition of Al2O3. The lack of information about depth of alumina is a major problem. It is very likely that alumina remains in the subsurface depth below 1 µm, in which annihilate up to 3% of all 22Na positrons. This allows one to neglect the alumina retention during the conventional 22Na experiments. Only usage of slow positrons can reveal the presence of Al2O3 and answer on its depth deposition.
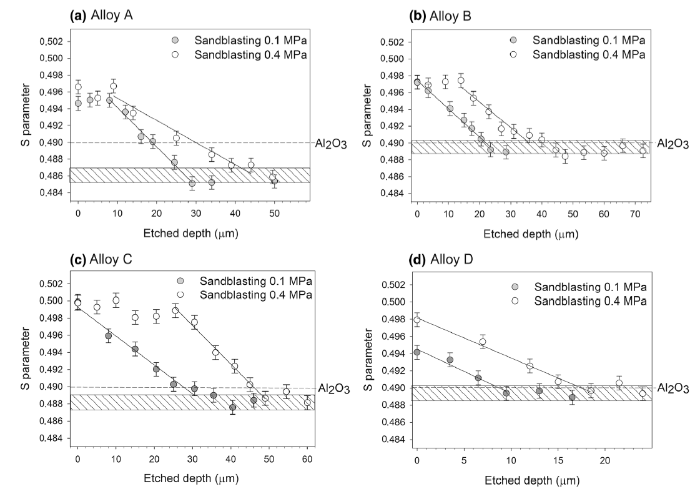
The depth defect profiles were obtained using conventional Doppler broadening method using 22Na source and sequential etching procedure. It means that after each measurement sandblasted sample was etched and measured again. The procedure was repeated until S parameter reached the value of a well-annealed sample. The S parameter dependency as a function of etched depth for dental alloys sandblasted with alumina particles with diameter 320 µm in stream of compressed air under pressure 0.1 and 0.4 MPa is shown in Fig. 5. It could be seen that S parameter dependency shows two regions for alloys A, B and C sandblasted under the air pressure 0.4 MPa and for A under 0.1 MPa. For the first one, the S parameter value is almost constant, and for the second one it linearly decreases with the etched depth. For other sandblasted samples only one linear region can be distinguished.
Fig. 5 S parameter as a function of etched depth for commercial dental alloys after sandblasting under the air pressure 0.1 (gray points) and 0.4 MPa (white points). The hatched area corresponds to reference samples. The regression lines were fitted using linear regression. The dashed horizontal line represents the value for alumina powder
Firstly, S parameter as a function of relative thickness reduction in compression in Fig. 4 is worth studying. First point in this compression experiment presents the value S for a well-annealed sample without damaging (also marked by hatched area). An increase in the compression load causes higher plastic deformation of the sample which rises value of the S parameter due to increase in the lattice defects concentration. Finally, S parameter reaches the saturation value, which means that almost all positrons annihilated in trapped state in defects (Fig. 4). A further increase in defect concentrations (or in the plastic deformation) does not change the value of the S parameter, and this is upper limit of defect concentration which could be detected using positron annihilation spectroscopy. The saturation value of the S parameter depends on alloy composition, and it is very similar for alloys A and B and differs for C and D. For example, for B alloy we could observe increasing of S parameter value up to thickness reduction ε = 5%, and almost constant value of S parameter above. The S parameter saturation values from compression experiment are the same as for the subsurface flat regions observed for sandblasted alloys A, B and C in Fig. 5. Only for alloy D the concentration of defects was not high enough to reach the saturation value. This result allows one to assume that the flat subsurface region of blasted alloys is so highly deformed that the defect concentration limit for the positron technique used has been reached. Also this time, the presence of Al2O3 in subsurface region was not noted. The S parameter of alumina is much smaller than for positrons trapped in defects (Fig. 5) and should decrease the S parameter value near surface. However, such behavior was not observed.
A decrease in the S parameter (the second region in Fig. 5) shows a reduction in the lattice defect concentration. The linear regression was used for characterization of this region and for determination of the damaged area ranges. For the same alloy the values of the regression line slope are almost the same for different pressures (Table 4), which shows that only material properties influence defect concentration changes below the blasted surface. Only difference was noted for alloy A blasted with pressure equal to 0.4 MPa. However, this dissimilarity could be caused by small number of experimental points. The defect zone ranges were determined as crossing point of the regression line and hatched area (well-annealed sample) in Fig. 5. The fitting parameters and the damaged zone range are collected in Table 4. The damaged zone ranges are very similar for three studied alloys A, B and C, i.e., for 0.1 MPa in the range 21-30 µm and for 0.4 MPa in the range 35-48 µm. Samples sandblasted under air pressure of 0.1 MPa exhibit 1.5-2 times smaller damaged zone range than the samples after treatment under 0.4 MPa. It is not surprising that higher air pressure creates higher defect concentration beneath the sandblasted surface and increases the damaged zone ranges. Higher compression of air increases the velocity of abrasive particles which hit and damage material. However, usage of higher pressure is not always necessary if high concentration of defects is desired in the range of several micrometers. The alloy D (with Cr-Co) shows around twice as small defected zone ranges in comparison with the others. It is interesting that sample D blasted under 0.4 MPa shows even smaller damaged area (equal to 17 µm) than the other studied alloys after treatment under 0.1 MPa. These differences can be related to the difference in the materials structure and mechanical properties (i.e., difference in hardness). The hardness of reference samples is shown in Table 4. Three almost single-phase alloys (i.e., alloys A, B and C) have similar hardness values in the range 230-260 HV10. The hardness of the two-phase alloy D was considerably higher and equal to 425 HV10. Higher hardness hampers plastic deformation of the alloy, limits share of defect and reduces value of the damaged zone ranges.
Table 4 Table includes fitting parameters of S(x) = - Ax + B regression (where x is depth) from
| Alloys | Sandblasting 0.1 MPa | Sandblasting 0.4 MPa | Microhardness HV10 | ||||
|---|---|---|---|---|---|---|---|
| A × 104 | B × 10 | Range (µm) | A × 104 | B × 10 | Range (µm) | ||
| A | 4.6 (2) | 4.988 (5) | 25 | 2.6 (3) | 4.979 (9) | 41 | 232 (7) |
| B | 3.3 (1) | 4.974 (2) | 21 | 3.0 (4) | 5.009 (9) | 35 | 238 (5) |
| C | 3.4 (2) | 4.993 (6) | 30 | 4.5 (2) | 5.106 (8) | 48 | 255 (5) |
| D | 5.1 (7) | 4.945 (4) | 8 | 4.7 (3) | 4.982 (3) | 17 | 425 (6) |
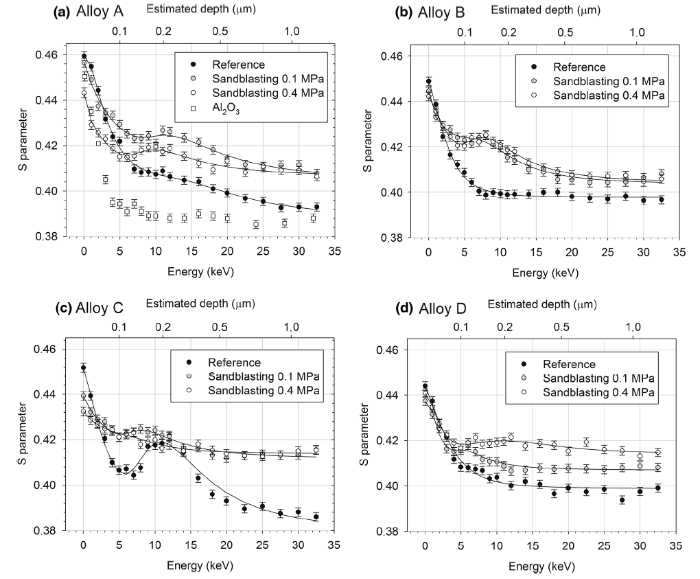
The variable energy positron beam measurements were performed to study defects and observe changes in surface oxide in region depth up to 1 μm. In Fig. 6 the results for S parameter as a function of implantation positron energies are presented for alloys before and after sandblasting. The mean implantation depth depends on positron energies as follows:
$\bar{z}=\frac{A}{\rho}E^{n}$,(2)
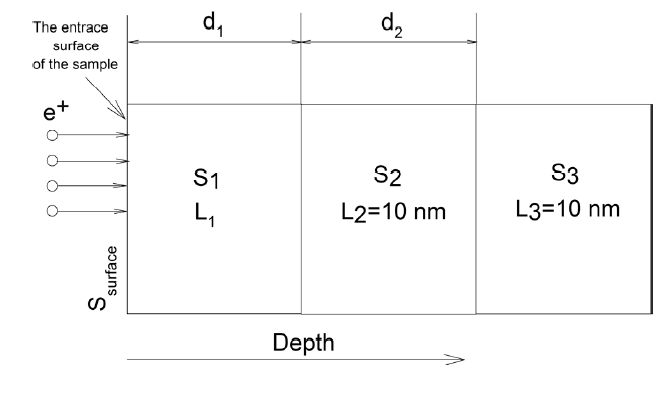
where A and n are material parameters and ρ = 8.2 g/cm3 is density of material. The values n = 1.675 and A = 2.67 µg cm2 keVn reported for nickel were used in calculation [32]. Higher positron energies allow one to study region of samples deeper. The analysis of the results was conducted using the VEPFIT software [33]. In order to describe the S parameter depth profile the model containing up to three material layers was used, where the fitting parameters were positron diffusion length L, the layer thickness d and value of S parameters for layers and surface. The scheme of the used system is shown in Fig. 7. To decrease the number of fitting parameters and get reasonable value of parameters, the positron diffusion length for second and third layers was kept fixed and equal to 10 nm. The result of fitting procedure is shown in Table 5. The S parameters on the surface are higher than in the interior of samples and decrease with positron energy at beginning. It is caused by positrons which annihilate on the surface. The positron fraction which reaches the surface and lower S parameter through diffusion is smaller for higher positron energies. For unblasted alloys B (containing Cr and Ni) and D (with Cr and Co) only one-layer model was able to describe measurement very well (Fig. 6). However, for A (CrNi) and C (CrNiFe) samples such model was insufficient. For A samples the S parameter slowly decreases in positron energies ranges from 10 to 25 keV. This almost linear decrease can be caused by deeply depleted oxides with lowering oxygen concentration in region up to around 600 nm. For C alloy characteristic bump in region 170-320 nm occurs, which is connected with alloy composition containing the large quantity of iron. Similar bumps were reported for thermally grown oxide films on stainless steel grade 304 [34]. It should be emphasized that according to the literature [35, 36], under the conditions of high temperature the multi-oxide film consists of α-Fe2O3 at the top of the layer and spinel containing mainly Cr2O3 and other kinds of Fe, Cr and Ni oxides. Such systems can be fitted using at least the three-layer model. After sandblasting this arrangement is removed and replaced by new oxides layer (Fig. 6c). Below this coating a damaged structure exists.
Fig. 6 S parameter as a function of energy of positron beam for dental alloys before (black points) and after sandblasting under the air pressure 0.1 (gray points) and 0.4 MPa (white points). Lines show the best fit obtained using VEPFIT program. The upper axis corresponds to mean implantation positron depth. In a also the S parameter profile for polycrystalline Al2O3 was presented as white squares
Fig. 7 Schematic representation of system used in VEPFIT program during fitting. The S1, S2, S3 and Ssurface correspond to S parameter in three layers and surface, respectively. Positron diffusion length in second L2 and third L3 layers was kept as 10 nm, and L1 was fitted parameter
Table 5 Fitting parameters obtained using VEPFIT program for variable energy positron beam measurement curves presented in
| Alloy | Sandblasting pressure (MPa) | Ssurface | S1 | L1 (nm) | d1 (nm) | S2 | d2 (nm) | S3 |
|---|---|---|---|---|---|---|---|---|
| A | None | 0.460 (1) | 0.404 (1) | 27 (1) | 604 (52) | 0.388 (1) | ||
| A | 0.1 | 0.448 (1) | 0.420 (1) | 29 (1) | 286 (18) | 0.445 (1) | 391 (35) | 0.405 (1) |
| A | 0.4 | 0.430 (1) | 0.407 (1) | 27 (1) | 156 (11) | 0.427 (1) | 281 (14) | 0.407 (1) |
| B | None | 0.441 (1) | 0.398 (1) | 22 (1) | ||||
| B | 0.1 | 0.434 (1) | 0.422 (1) | 15 (1) | 115 (16) | 0.434 (1) | 175 (9) | 0.404 (1) |
| B | 0.4 | 0.439 (1) | 0.414 (1) | 17 (1) | 80 (17) | 0.431 (2) | 207 (20) | 0.404 (1) |
| C | None | 0.444 (1) | 0.394 (1) | 23 (1) | 172 (3) | 0.452 (1) | 315 (4) | 0.379 (1) |
| C | 0.1 | 0.434 (1) | 0.418 (1) | 24 (1) | 134 (3) | 0.434 (1) | 209 (12) | 0.412 (1) |
| C | 0.4 | 0.429 (1) | 0.421 (1) | 18 (1) | 151 (15) | 0.444 (1) | 189 (12) | 0.412 (1) |
| D | None | 0.437 (1) | 0.399 (1) | 34 (1) | ||||
| D | 0.1 | 0.441 (1) | 0.412 (1) | 8 (1) | 79 (9) | 0.475 (1) | 85 (9) | 0.407 (1) |
| D | 0.4 | 0.440 (1) | 0.415 (1) | 11 (1) | 91 (13) | 0.421 (1) | 424 (41) | 0.414 (1) |
Unfortunately, the S parameter does not allow one to get exact information about the type of defect, but some common behavior for profiles after sandblasting can be observed. Table 5 contains information about the value of S parameter in fitted curves according to the scheme shown in Fig. 7. The S parameter is the highest in the second layer. The drop in first layer can be caused by two reasons. Sometimes W parameter, which is defined as ratio of the area below the central part of annihilation peak to the total area in the range of this line, gives possibility to distinguish the major contribution. However, the analysis of shape parameters S and W (not included in this report) in this case does not allow one to judge which one is more crucial. The first one is the influence of epithermal positron. The second is related to alumina retention. The S parameter for metal oxides is much higher than deformed metal matrix, but the alumina particles which remain in the samples, according to Figs. 4 and 6a, decrease this value. The depth d1 can be identified as maximal thickness on which the alumina particles could be present. In most cases this depth does not depend clearly on the applied pressure; only for A sample reduction from 286 to 156 nm can be observed. For other alloys this value is in the range from 79 to 151 nm. The second important parameter related to defects concentration is positron diffusion length L+. Shortening of this parameter is mostly caused by higher defects concentration. Obtained positron diffusion lengths in oxides layer before the sandblasting were in the range 23-34 nm. After sandblasting for two alloys B (CrNi) and D (CrCo) shortening of L+ was noted to value around 15 and 10 nm, respectively. This means that defect concentration increases after sandblasting. However, for two other samples A and C only small differences in L+ were observed. Probably, it is due to the complex nature of oxide layer formed after sandblasting. The big difference of value of Ssurface parameter in this case supports this suspicion. The second and third regions describe the damaged structure. The changes in S parameter are caused by decreasing defect concentrations. However, the presence of vacancy clusters in the second region cannot be excluded. It is well known that vacancy agglomeration in clusters in metals increases value of S parameter [37]. These clusters were not able to be observed in current studies in lifetime measurements due to small area of occurrence. However, for soft materials like copper after sandblasting [19] the presence of vacancy clusters has already been observed. The values of S parameter for third layer under different pressures are almost the same for alloys A, B and C and differ for D (with Co and Cr). Similar situation was noted for the first measurements points (without etching) in Fig. 5. This shows that obtained beam experiment results fulfill information from conventional Doppler broadening of annihilation line spectroscopy and allow to gain information about the subsurface zone responsible for bonding strength between the metals and veneers. However, performed studies do not allow one to connect the influence of defects with bonding strength and additional studies should be carried out.
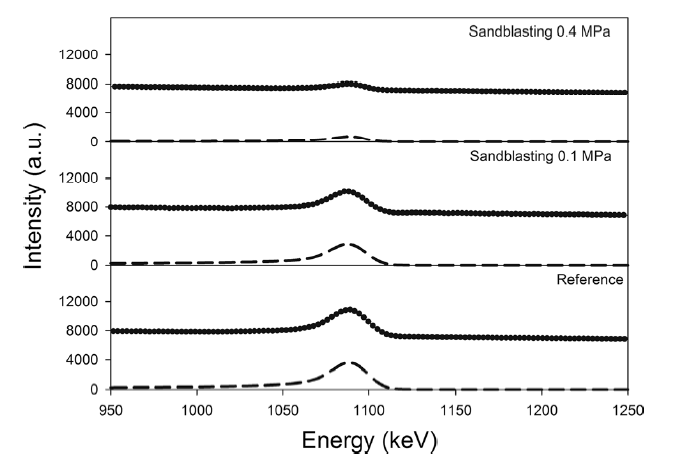
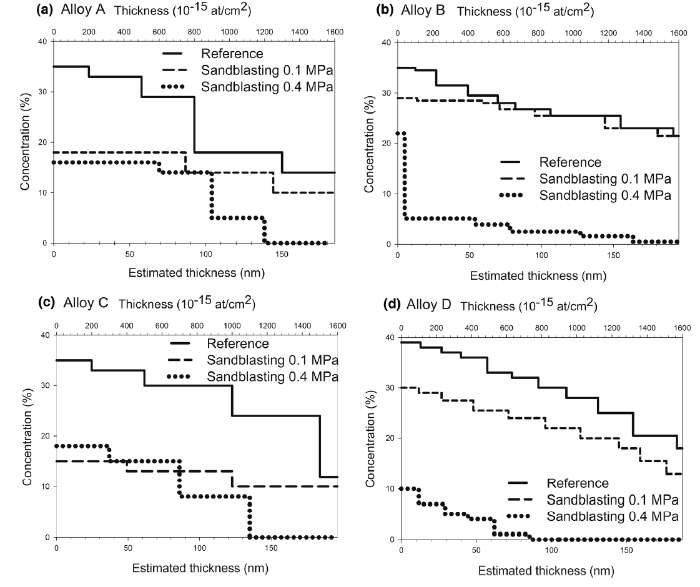
The controlling of oxide thickness in base dental alloy is an important factor, which influences bonding strength with the veneer. The information about oxide thickness can be gained from the RBS technique. Figure 8 shows exemplary the 3.045 MeV 4He+2 experimental RBS/NR normalized spectra in the region of the oxygen peak for the alloy B before and after sandblasting under pressure 0.1 MPa and 0.4 MPa. The RBS signal energy from the 4He+2 ions backscattered by the oxygen atoms can be observed in the 1025-1120 keV energy range, with a maximum at around 1090 keV. As the RBS/NR technique does not allow one to distinguish an element from two different sources, the oxygen signal due to alumina retention and metal oxides cannot be separated. The oxygen concentration decreases after sandblasting and depends on sandblasting pressure. The long tail in the energy range of 1025-1075 keV in signal from ions backscattered on oxygen atoms, shown in Fig. 8, is well visible for the reference and for the sample blasted under 0.1 MPa and corresponds to deeply depleted oxides. In order to determine the oxygen depth profile as well as the elemental concentration, the RBS spectra were simulated using the SIMNRA code. The theoretical model consisting of plano-parallel homogeneous uniform layer on the homogeneous substrate was used in the analysis. The changes in oxygen concentration obtained during analysis are presented in Fig. 9. The oxide thickness in all references is higher than 200 nm, and oxide concentration decreases from value 35-39% on surface to 12-21% at 200 nm. Sandblasting removes oxides from the surface. During sandblasting under pressure 0.1 MPa, erosion process is effective for A and C samples, i.e., concentrations of oxygen and oxide thickness are highly reduced. However, it is poor for B and D alloys. Only usage of higher pressure of 0.4 MPa gives possibility to remove deeply depleted oxides from all alloys.
Fig. 8 RBS/NR normalized spectra in oxygen peak range as a function of backscattered He energies for alloy B before and after sandblasting under the compressed air pressure 0.1 MPa and 0.4 MPa. The black points correspond to the experimental measurement. Dashed line presents the number of counts scattered only on oxygen atoms obtained using SIMNRA code
Fig. 9 Oxygen concentration from RBS/NR spectra as a function of thickness for dental alloys before and after sandblasting under the compressed air pressure 0.1 MPa and 0.4 MPa obtained using SIMNRA code. The upper axis corresponds to real thickness obtained in experiment in atoms/cm3 unit. The lower axis is the estimated thickness calculated using the density of the alloy in nm unit
The sandblasting process can be used as an effective tool for modification of surface. The presented RBS and variable energy positron beam results indicate the shallow deposition of alumina after sandblasting in chromium contained in dental alloys. The range of damaged area depends on the applied pressure and the type of alloys and expands up to the depth of 50 µm. The higher compression of air propelling abrasive particles (0.4 MPa) increases the defected zone range 1.5-2 times in comparison with 0.1 MPa. The most resistant to damaging during sandblasting from all studied alloys is I-MG based on chromium and cobalt. In comparison with other alloys I-MG defected zone range is nearly twice as small. This difference is caused by much higher hardness of I-MG alloys in comparison with others.
Most defects created during sandblasting are vacancies on dislocation lines. However, in region below 1 µm the occurrence of vacancy clusters is possible. The RBS studies reveal that the erosion process during the 60-s sandblasting under 0.1 MPa pressure cannot completely remove metal oxides from the surface and higher compression of air 0.4 MPa should be used. The SEM and AFM studies show that the roughness of samples increases as well as pressure, but the meaningful differences in this parameter between the same dental alloys were not observed.

 WeChat
/
| 〈 |
|
〉 |