Search for articles:
Hong Zhao , Bo Yang
Corresponding authors:
Received: 2017-10-10
Revised: 2017-11-6
Online: 2018-06-10
Copyright: 2018 Editorial board of Acta Metallurgica Sinica(English Letters) Copyright reserved, Editorial board of Acta Metallurgica Sinica(English Letters)
More
Abstract
Mg-Zn-Ag alloys have been extensively studied in recent years for potential biodegradable implants due to their unique mechanical properties, biodegradability and biocompatibility. In the present study, Mg-3Zn-xAg (wt%, x = 0.2, 0.5 and 0.8) alloys with single-phase crystal structure were prepared by backward extrusion at 340 °C. The addition of Ag element into Mg-3Zn slightly influences the ultimate tensile strength and microstructure, but the elongation firstly increases from 12% to 19.8% and then decreases from 19.8% to 9.9% with the increment of Ag concentration. The tensile yield strength, ultimate tensile strength and elongation of Mg-3Zn-0.2Ag alloy reach up to 142, 234 MPa and 19.8%, respectively, which are the best mechanical performance of Mg-Zn-Ag alloys in the present work. The extruded Mg-3Zn-0.2Ag alloy also possesses the best corrosion behavior with the corresponding corrosion rate of 3.2 mm/year in immersion test, which could be explained by the single-phase and uniformly distributed grain structure, and the fewer twinning.
Keywords:
Magnesium alloys have been extensively studied in recent years as potential biodegradable implants in bone and cardiovascular surgery due to their unique mechanical properties, biodegradability and biocompatibility [1, 2, 3, 4, 5]. Among these magnesium alloys, the Mg-Zn-based alloys have attracted much attention, since Zn is one of the most abundant nutritionally essential elements in human body [6, 7, 8]. To date, even though significant progress has been achieved in the performance of Mg-Zn-based alloys, the degradation behavior and mechanical properties are still unsatisfactory.
In general, the mechanical properties and degradation behavior of Mg-Zn-based alloys can be tailored by adding alloying elements such as Al, Ca, Zr, Mn, Ag and rare earth elements (RE) [9, 10, 11, 12, 13, 14, 15, 16, 17, 18, 19, 20, 21, 22, 23, 24, 25]. But the release of some elements may cause hepatotoxicity and/or neurotoxicity, such as Al and Pb [3, 26, 27]. As far as biocompatibility is concerned, Mg-Zn-Ag-based alloys have received much attention as candidates for a resorbable alloy due to its anti-inflammatory effects [22, 28]. However, the primary use of Mg-Zn-Ag-based alloys concentrated on structural applications, with the improvement in mechanical properties by the precipitation of secondary phases [22, 23]. Owing to their difference in chemistry in comparison with magnesium matrix, these particles possessing higher electrode potential than the matrix will induce galvanic corrosion and/or pitting corrosion, which accelerates the degradation rate of Mg alloys and further leads to the deterioration of mechanical properties [29, 30]. There is lack of research on the mechanical properties and corrosion behavior of Mg-Zn-Ag alloys with single-phase structure.
Previous studies have proved that solid solution treatment decreases the biodegradation rate of Mg-Zn system alloys by decomposing the secondary phase particles and reducing the micro-galvanic corrosion [31, 32, 33, 34]. According to the Mg-Zn and Mg-Ag binary equilibrium phase diagram, the solid solubility of Zn, Ag in magnesium is 6.2 wt% at 340 °C and 15.02 wt% at 472 °C, respectively [35]. Recently, Wang et al. [36] reported Mg-Zn-Ag ternary phase diagram and revealed that both Zn and Ag had a certain amount of solid solubility in Mg matrix. It indicates that single-phase structure Mg-Zn-Ag alloys can be obtained by solid solution treatment. In the present study, Mg-3Zn-xAg (wt%, x = 0.2, 0.5 and 0.8) alloys were prepared by the backward extrusion technology at elevated temperature in order to develop a single-phase Mg-Zn-Ag alloys. The influences of Ag concentration on microstructures, mechanical properties and corrosion behavior of the extruded Mg-3Zn-Ag alloys are presented.
The Mg-3Zn-xAg (where x = 0.2, 0.5 and 0.8 wt%) alloy ingots were prepared by induction melting pure constituent elements Mg (99.99%), Zn (99.95%) and Ag (99.95%) under a mixture of N2 and 0.2% SF6 atmosphere in a graphite crucible and casted into a steel mold (Φ60 mm × 180 mm), which was preheated to 250 °C. The casting ingots were homogenized at 320 °C for 2 h and solution treated at 400 °C for 8 h with the protection of graphite powders and machined into Φ48 mm cylinders. Subsequently, the billets were indirectly extruded into Φ6 mm bars with ram speed of 200 mm/min at 340 °C in order to obtain the single-phase microstructure. The nominal and measured compositions of samples are listed in Table 1.
Table 1 Composition of Mg-Zn(-Ag) alloys measured by ICP-AES (balance magnesium)
| Alloy | Mg (wt%) | Zn (wt%) | Ag (wt%) |
|---|---|---|---|
| Mg-3Zn | 97.20 | 2.80 | 0 |
| Mg-3Zn-0.2Ag | 96.97 | 2.83 | 0.20 |
| Mg-3Zn-0.5Ag | 96.61 | 2.88 | 0.51 |
| Mg-3Zn-0.8Ag | 96.34 | 2.88 | 0.78 |
Microstructural investigations were performed by scanning electron microscopy (SEM, JEOLJSM-7001F) and transmission electron microscopy (TEM, JEOL JEM-2100F) equipped with energy-dispersive X-ray spectrometry. Electron backscatter diffraction (EBSD) was applied to reveal microstructure details and local crystallographic orientation. For the microstructural analyses, the samples were mechanically polished and electrolytically polished with a solution of 10 mL perchloric acid (HClO4) and 90 mL ethanol (C2H5OH) for 120 s. The specimens for TEM observation were ground to 30 μm and further thinned with ion milling. The crystal structures were determined by X-ray diffractometer (Rigaku SmartLab) with Cu Kα radiation at 40 kV and 200 mA.
Mechanical testing samples with a diameter of 5 mm and a gauge length of 30 mm were cut from the extruded bars for tensile test. The tensile tests were conducted on a Shimadzu AG-X100kN electromechanical universal testing machine at a displacement rate of 1.5 mm/min at ambient temperature. The tensile axis was parallel to the extrusion direction, and at least three samples were examined for each testing material.
Cylindrical specimens with a diameter of 6 mm were molded in epoxy resin for electrochemical tests. The test was conducted at 37 °C in an open air glass cell containing 200 mL SBF (simulated body fluid) solution at pH 7.40 by using VersaSTAT-3 potentiostat/galvanostat (Princeton Applied Research), and the chemical compositions of SBF solution are given in Table 2 [37]. A three-electrode cell was used for potentiodynamic polarization tests, where the reference electrode was saturated calomel electrode (SCE), the counter electrode was platinum electrode (Pt) and the specimen was working electrode (WE). All experiments were carried out at a constant scan rate of 1 mV/s initiated at 300 mV below the open-circuit potential to 400 mV above the open-circuit potential.
Table 2 Chemical composition of SBF solution (g/L) used in these experiments
| NaCl | NaHCO3 | KCl | K2HPO4·3H2O | MgCl2·6H2O | c(HCl) = 1 mol/L (mL) | CaCl2 | NaSO4 | TRIS | c(HCl) = 1 mol/L (mL) |
|---|---|---|---|---|---|---|---|---|---|
| 8.035 | 0.355 | 0.225 | 0.231 | 0.311 | 39 | 0.292 | 0.072 | 6.118 | 0-5 |
The polarization curves were used to measure the corrosion current density (icorr: mA/cm2) at corrosion potential (Ecorr) by Tafel extrapolation of the cathodic branch. And icorr is related to the average corrosion rate using Eq. (1) [38]
$P_{i} = 22.85i_{\text{corr}} .$ (1)
To investigate the corrosion behavior in vitro conditions, Φ6 mm × 3 mm samples were cut and mechanically ground. Afterward the ground samples were washed ultrasonically with ethanol and then dried with a warm airflow for immersion test. The samples were weighed before and after immersion in thermostatic water bath at 37 °C using a balance with a precision scale resolution of 0.1 mg. Each sample was suspended with nylon strings and completely immersed in 30 mL SBF solution with pH value 7.40. Samples were removed from SBF after immersion of 1, 2, 4, 8 and 14 days and then cleaned with 200 g/L of chromic acid (CrO3) solution in the ultrasonic cleaning machine to remove the corrosion products. The in vitro corrosion rate (Pw ) was calculated by the following equation according to the weight loss:
$P_{w} = \left( {8.76 \times W} \right)/\left( {A \times T \times \rho } \right),$(2)
where W is the weight loss after immersion (g), A is the sample area exposed to solution (m2), T is the exposure time (h) and ρ is the density of the material (g cm-3). The weight loss tests were conducted three times in different days, using a new sample and a new solution.
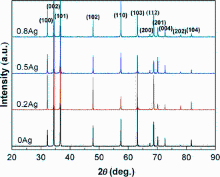
Figure 1 presents the X-ray diffraction (XRD) results for the extruded Mg-Zn(-Ag) alloys. As shown in Fig. 1, only the diffraction peaks of α-Mg can be observed in all the four alloys, which suggests that introduced Ag element is solute in α-Mg matrix and the extruded Mg-Zn(-Ag) alloys are of single-phase structure as expected. The lattice parameters of extruded Mg-Zn-Ag alloys are summarized in Table 3. It can be seen that the lattice parameter a slightly increases and c decreases with the addition of 0.2% Ag into the Mg-3Zn alloy, which results in the decrease in c/a ratio of Mg-3Zn alloys, whereas when the Ag content is larger than 0.2%, both the lattice parameters a and c of extruded Mg-Zn-Ag alloys decrease with the increasing Ag content. It indicates that the addition of Ag element to Mg-Zn changes the lattice parameters by occupying the substitutional sites of the crystal lattice.
Fig. 1 XRD patterns of as-extruded Mg-Zn(-Ag) alloys
Table 3 Lattice parameters of extruded Mg-Zn(-Ag) alloys
| Alloys | a (nm) | c (nm) | c/a |
|---|---|---|---|
| Mg-3Zn | 3.2034 | 5.2014 | 1.6236 |
| Mg-3Zn-0.2Ag | 3.2047 | 5.2008 | 1.6229 |
| Mg-3Zn-0.5Ag | 3.2036 | 5.2004 | 1.6232 |
| Mg-3Zn-0.8Ag | 3.2031 | 5.2006 | 1.6236 |
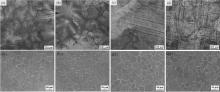
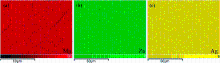
Figure 2a-d shows the optical microstructures of Mg-Zn(-Ag) alloys after solid solution treatment. It can be observed that the grain sizes of Mg-Zn-Ag alloys are more than 200 μm after solid solution treatment. Thus, the mechanical properties of solution-treated Mg-Zn(-Ag) alloys are poor. After extrusion, Mg-Zn(-Ag) alloys are composed of homogeneous equiaxed grains with perfect morphologies (Fig. 2a1-d1). It is suggested that the microstructures are of typical single-phase microstructure for all the alloys. The SEM-EDS mapping demonstrates that the Zn and Ag elements are distributed homogeneously in the Mg matrix without microscopic segregation and precipitation occurred during hot extrusion because of the high solubility and high extrusion temperature as shown in Fig. 3, which indicates that the Zn and Ag elements are fully solute in the Mg matrix.
Fig. 2 Optical micrographs of solid solute treatment Mg-Zn(-Ag) alloys and SEM-BSE images of as-extruded Mg-Zn(-Ag) alloys a, a1 Mg-3Zn, b, b1 Mg-3Zn-0.2Ag, c, c1 Mg-3Zn-0.5Ag, d, d1 Mg-3Zn-0.8Ag
Fig. 3 SEM-EDS mapping of all the extruded Mg-Zn-Ag alloys: a Mg, b Zn, c Ag
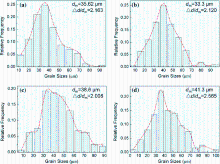
The average grain sizes of extruded Mg-Zn(-Ag) alloys were determined according to the standard test method (ASTM E112-96), as shown in Fig. 4. All the extruded alloys appear to be an approximate normal distribution with a single peak despite the different peak values, which indicates a slight difference in the average grain size for four alloys. The Mg-3Zn-0.2Ag alloy possesses the smallest grain size (~ 33.3 μm), as shown in Fig. 4b. The average grain size of the Mg-3Zn, Mg-3Zn-0.5Ag and Mg-3Zn-0.8Ag alloy is about 35.6, 38.6 and 41.3 μm, respectively, as shown in Fig. 4a, c, d, respectively. Regarding the microstructural heterogeneity, Δd/dm is used to characterize relative grain size dispersions according to Ref. [39], where d is the grain size, dm is the average grain size and Δd = dmax - dmin. It is easy to find the Mg-3Zn-0.2Ag alloy has a more uniform grain size distribution.
Fig. 4 Grain size distributions of the extruded Mg-Zn(-Ag) alloys: a Mg-3Zn, b Mg-3Zn-0.2Ag, c Mg-3Zn-0.5Ag, d Mg-3Zn-0.8Ag
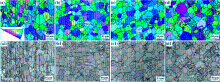
EBSD technique was employed to investigate the detailed microstructure and local crystallographic orientation of extruded Mg-Zn(-Ag) alloys. Figure 5 presents the inverse pole figure (IPF-Y) and band contrast mappings of the extruded Mg-Zn(-Ag) alloys. As can be seen from Fig. 5a-d, all the microstructures are composed of homogeneous equiaxed grains with <010>Mg and <120>Mg direction parallel to the normal direction of sample surface. Twins are also observed in all the four alloys, as shown in Fig. 5a1-d1. Crystallographic calculation reveals that these twins are of the conventional tensile twin in magnesium alloys. The corresponding twinning system is {\(10\bar{1}2\)}<\(1\bar{2}10\)>. It can be clearly seen that the Mg-3Zn-0.2Ag alloy possesses fewer twins than other alloys.
Fig. 5 EBSD inverse pole figure (IPF) map of as-extruded Mg-Zn(-Ag) alloys: a, a1 Mg-3Zn, b, b1 Mg-3Zn-0.2Ag, c, c1 Mg-3Zn-0.5Ag, d, d1 Mg-3Zn-0.8Ag
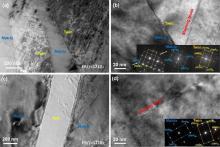
Figure 6 shows the TEM bright field images of extruded Mg-3Zn-0.2Ag and Mg-3Zn-0.8Ag alloys, where the electron beam is parallel to the <\(1\bar{2}10\)> direction of α-Mg. As shown in Fig. 6a, c, no precipitation of second phase is observed in the two alloys, which is in good consistency with the SEM and XRD results, whereas twins and stacking faults in grain and twins are observed in Fig. 6. According to the SAED patterns in Fig. 6b, d, the twinning plane is of {\(10\bar{1}2\)}, which is marked with white arrows in Fig. 6b, whereas the stacking faults are along the {\(0002\)} plane, which are marked with red arrows in Fig. 6b, d.
Fig. 6 TEM bright field micrographs of the as-extruded Mg-Zn-Ag alloys: a, b Mg-3Zn-0.2Ag, c, d Mg-3Zn-0.8Ag
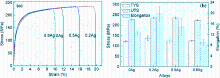
Figure 7 shows the tensile stress-strain curves and the corresponding TYS, UTS as well as elongation of extruded Mg-Zn(-Ag) alloys at room temperature. Firstly, there is almost no change in the TYS and UTS with the addition of Ag elements into Mg-3Zn alloys. As the microstructures shown, the Ag content not only affects the grain size but also influences the grain size distribution. It is evident that Mg-3Zn-0.8Ag alloy has the biggest grain size and grain size distribution. Even though its solid solution strengthening is greatest, the TYS and UTS of Mg-3Zn-0.8Ag alloy is almost the same with Mg-3Zn alloy. The elongation of extruded Mg-Zn(-Ag) alloys increases tremendously from 12% to 19.8% with the addition of 0.2 wt% Ag. Subsequently, it decreases to 15.8% and 9.9% for Mg-3Zn-0.5Ag and Mg-3Zn-0.8Ag, respectively. This may be related to the solution of a little Ag decreasing the c/a ratio of Mg matrix, which activates non-basal slip systems and improves the room temperature plasticity of Mg-3Zn-0.2Ag alloy [40, 41, 42]. Therefore, the mechanical properties of Mg-Zn-Ag alloys are related to solute atoms, grain sizes, dislocations and twinning. The TYS, UTS and elongation of Mg-3Zn-0.2Ag alloy reach up to 142, 234 MPa and 19.8%, respectively, exhibiting the best combination of tensile strength and elongation in the present work. To fulfill the complex stress conditions of implants in physiological environment, a good balance between strength and ductility is required, which indicates that the Mg-3Zn-0.2Ag alloy possesses great potential for implant application.
Fig. 7 Tensile stress-strain curves a and the corresponding yield strength, ultimate strength as well as elongation of extruded Mg-Zn(-Ag) alloys b. The load direction is parallel to extrusion direction
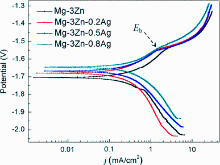
Figure 8 shows the potentiodynamic polarization curves of extruded Mg-Zn(-Ag) alloys. The details of the corrosion parameters are listed in Table 4. It can be observed that the corrosion potential (Ecorr) become more positive with the increase in the Ag concentration in the Mg-3Zn alloys. By addition of 0.2 wt% Ag into the binary Mg-3Zn alloy, the corrosion current density decreases from 60.534 to 33.627 μA/cm2, indicating that corrosion is kinetically more difficult for Mg-3Zn-0.2Ag alloy. However, the corrosion current increases to 68.938 and 101.594 μA/cm2 when introduction of 0.5 and 0.8 wt% Ag to the Mg-3Zn alloy, respectively, which indicates the higher electrochemical activity and the poorer corrosion resistance compared with Mg-3Zn-0.2Ag.
Fig. 8 Electrochemical polarization curves of Mg-Zn(-Ag) alloys in SBF solution
Table 4 Electrochemical parameters of Mg-Zn(-Ag) alloys from the polarization test
| Alloy | Corrosion potential, Ecorr (V vs. SCE) | Pitting potential, Eb (Vvs.SCE) | Current density, icorr(μA/cm) | Cathodic slope, βc (mV/decade) versus SCE | Anodic slope, βa (mV/decade) versus SCE | Polarization resistance, Rp (kΩ cm2) | Corrosion rate, Pi(mm/year) |
|---|---|---|---|---|---|---|---|
| Mg-3Zn | - 1.704 | - 1.549 | 60.534 | 135.142 | 106.784 | 0.43 | 1.4 |
| Mg-3Zn-0.2Ag | - 1.679 | - 1.548 | 33.627 | 104.598 | 68.322 | 0.54 | 0.8 |
| Mg-3Zn-0.5Ag | - 1.667 | - 1.546 | 68.938 | 181.715 | 124.388 | 0.45 | 1.6 |
| Mg-3Zn-0.8Ag | - 1.645 | - 1.541 | 101.594 | 202.528 | 138.116 | 0.35 | 2.3 |
The polarization resistance (Rp) was calculated using the icorr, βc and βa values from Eq. (3) [43], which is given as
$R_{\text{p}} = \frac{{\beta_{a} \cdot \beta_{c} }}{{2.3\cdot(\beta_{a} + \beta_{c} ) \cdot i_{\text{corr}} }}.$ (3)
As shown in Table 4, Mg-3Zn-0.2Ag alloy has the highest Rp value, whereas Mg-3Zn-0.8Ag alloy has the lowest value. Mg-3Zn and Mg-3Zn-0.5Ag alloys have intermediate Rp values. It is suggested that the corrosion layer on the Mg-3Zn-0.2Ag alloy is more protective and less susceptible to pitting corrosion than that of other samples.
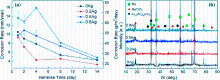
Figure 9 shows the corrosion rate of the four Mg-Zn(-Ag) alloys in SBF solution and XRD patterns of the corrosion products after 14 days of immersion. As can be seen in Fig. 9a, all four alloys present a high corrosion rate at first and then the rate decreases gradually with further immersion time due to the formation of the protective layer. Within the whole immersion test, Mg-3Zn-0.2Ag alloy shows the lowest corrosion rate of 3.2 mm/year, while Mg-3Zn-0.8Ag alloy shows the highest corrosion rate of 4.8 mm/year. The immersion results reveal that Mg-3Zn-0.2Ag alloy has the best corrosion resistance owing to its uniform microstructures, which is in agreement with the results of electrochemical test. The difference between Piand Pw is due to the chemical erosion, electrochemical corrosion and washing process of corrosion products. The EDS (not given) and XRD results (Fig. 9b) suggest the existence of biocompatible Mg(OH)2 and HA on the surface of the corroded alloys, which act as corrosion barriers to decelerate corrosion.
Fig. 9 a Corrosion rate of Mg-Zn(-Ag) alloys after immersion in SBF solution for various times, b X-ray diffraction patterns of the corrosion products after immersion for 14 days
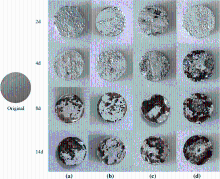
To investigate the degradation behavior, macro-surface morphologies after removing the corrosion products of the specimens immersed for different times in SBF solution were observed, as shown in Fig. 10. Many corrosion pits can be seen on the surface of different Mg-Zn(-Ag) alloys, whose sizes and depths are found to increase with the pass of immersion time. The results suggest that there are pitting corrosion behaviors for four alloys. After immersion for 4 days, many corrosion pits are presented as opposed to almost intact original surface. After 8 days, all the Mg-Zn(-Ag) alloys exhibit pitting corrosion and erosion on the Mg-3Zn-0.8Ag alloy continues to be more substantial compared with its counterparts, indicating that there is more significant corrosion with increasing amount of silver content. The above observations are consistent with the results in potentiodynamic polarization tests.
Fig. 10 Macro-morphologies of the corroded surfaces of Mg-Zn(-Ag) alloys after immersion in SBF solution. a Mg-3Zn, b Mg-3Zn-0.2Ag, c Mg-3Zn-0.5Ag, d Mg-3Zn-0.8Ag
As mentioned above, the extruded Mg-3Zn(-Ag) alloys with single-phase structure were fabricated by solid solution treatment. SEM and TEM results confirmed that there is no precipitation of secondary phase in the microstructure, and only homogeneous grains within twins and stacking faults can be observed in the microstructure. Therefore, the corrosion behavior of extruded Mg-Zn(-Ag) alloys is related to grain size and amount of twins. Grain refinement will induce more grain boundaries and the redistribution of impurities on the grain boundaries, which results in uniform cathodic sites throughout the Mg-Zn(-Ag) alloy structure for cathodic reaction and improvement in corrosion resistance [44, 45, 46]. Moreover, Ralston et al. [47] and Gollapudi [48] showed that the corrosion rate was proportional to the reciprocal square root of grain size: icorr = a + bd-1/2, and b is a positive value in a non-passivating environment when the grain sizes are in the range of 2-100 μm. Thus, Mg-3Zn-0.2Ag alloy with fine grains exhibits the lowest corrosion rate among all the extruded Mg-3Zn-Ag alloys. Meanwhile, the corrosion behavior is sensitive to the crystallographic defects, such as twinning, dislocation and stacking faults. In terms of literature, the existence of twins will accelerate corrosion process due to the accelerated anodic dissolution in the vicinity of dislocations [43, 44, 49]. Thus, Mg-3Zn-0.2Ag alloy with the least twins in microstructure achieves the best corrosion behavior, which shows lower corrosion rate than those of Mg-1Zn-0.2Ag and Mg-1Zn-0.8Ag alloy with secondary phase particles [22].
The present work proposed the systemically investigation on the microstructure, mechanical properties and corrosion behavior of extruded Mg-3Zn(-Ag) alloys with single-phase structure. The following conclusions can be drawn:
1.The extruded Mg-3Zn(-Ag) alloys are of single-phase structure. The equiaxed grain size is about 30-50 µm, which indicates the occurrence of recrystallization during extrusion. Both the grain size and amount of twins show a trend of slight decrease and then increase with the concentration of Ag alloying element.
2.As compared with the Mg-3Zn alloy, there was almost no increase in the yield strength and ultimate strength for Ag-containing alloys, while the elongation increased at first and then decreased with increment of Ag into Mg-3Zn alloy. The TYS, UTS and elongation of Mg-3Zn-0.2Ag alloys reached up to 142, 234 MPa and 19.8%, which is the best mechanical performance of Mg-Zn(-Ag) alloys in the present work.
3.The extruded Mg-3Zn-0.2Ag alloy also possesses the best corrosion behavior, and the corresponding corrosion rate is about 3.2 mm/year in immersion test. SEM and XRD results reveal that the corrosion products are composed of Mg(OH)2and HA after the Mg-Zn(-Ag) alloys immersed in the SBF for 14 days.
The authors have declared that no competing interests exist.

 WeChat
/
| 〈 |
|
〉 |