Search for articles:
Bei-Ning Du , Dao-Kui Xu
Corresponding authors:
Received: 2018-02-8
Revised: 2018-02-8
Online: 2018-02-08
Copyright: 2018 Editorial board of Acta Metallurgica Sinica(English Letters) Copyright reserved, Editorial board of Acta Metallurgica Sinica(English Letters)
More
Abstract
In the present study, the effect of Zn content on the microstructure and deformation behavior of the as-cast Mg-Zn-Y-Nd alloy has been investigated. The results showed that as Zn content increased, the volume fraction of secondary phases increased. Moreover, the phase transformation from W-phase to W-phase and I-phase occurred. In the as-cast state, W-phase exists as eutectic and large block form. When Zn content increases to 6 and 8% (wt%), small I-phase could precipitate around W-phase particles. Additionally, the effect of Zn content on the tensile properties and deformation behavior varies with the testing temperature. At room temperature, the tensile strength increases with Zn content, whereas the elongation increases initially and then decreases. At 250 °C, as Zn content increases, the tensile strength decreases initially and then increases slightly, whereas the elongation decreases. At 350 °C, the elongation increases with Zn content, whereas the tensile strength decreases initially and then increases slightly.
Keywords:
Mg, as an essential element in human body, is the second most important cation in human cells, which leads to good biocompatibility of implant part in the body [1, 2, 3]. Moreover, the low density and similar stiffness of human bone make Mg more attractive, which could reduce the “stress shielding effect” during implanted as bone lamella or nail [4]. In addition, the degradation products of Mg are almost no harmful to human body [5]. Therefore, Mg has been considered as one of the most potential materials applied in implant medical devices [6]. However, the low strength and high corrosion rate of Mg handicap its application [7]. To conquer these shortcomings, many methods have been applied, among which the alloying is the most feasible way [7, 8, 9].
Recently, the investigations [10, 11, 12] on biomedical magnesium alloys revealed that the addition of Zn could improve their mechanical properties and corrosion resistance with little influence on its biocompatibility, because Zn is an essential element for human body. Then a series of Mg-Zn alloys for biomedical application were developed [13, 14, 15]. The research of Zhang et al. [10] exhibited that Zn addition in Mg could increase the mechanical performance and biocompatibility, and the Mg-6Zn (wt%) alloy was the best choice. But the mechanical properties of Mg-Zn alloy are not high enough, because of the low proportion of strengthening precipitate and coarse grain [16, 17]. Generally, rare earth could refine the microstructure of Mg alloys and improve their mechanical properties effectively [18, 19, 20]. The research of Lee et al. [21] showed that the appropriate addition of Y in Mg-Zn alloy increased the strength, which could be attributed to the formation of I-phase and grain refinement, but the improvement effect was influenced by the Zn/Y ratio, and the Zn/Y ratio of alloy, and the highest strength was 2.5. The investigation of Xu et al. [22] on Mg-Zn-Y-based alloy exhibited that the alloy would obtain the highest strength when Zn/Y ration is about 5. Certainly, the content of Zn also exerts influence on the mechanical properties of the Mg-Zn-Y-based alloy. Based on the recent researches [23, 24], the appropriate addition of Nd in Mg alloy could also improve the corrosion resistance of Mg alloy. Thus, the combining addition of Y and Nd is a good choice to improve the mechanical properties and corrosion resistance. However, as unessential elements of human body, the contents of Y and Nd should be as less as possible. To obtain biomedical Mg alloy with optimum comprehensive properties, the contents of the alloying elements should be regulated. An Mg-2Zn-0.5Y-0.5Nd alloy for coronary stent was developed by Zhengzhou University, and in vitro and in vivo tests show good biocompatibility [25]. But due to the low alloying element contents, the strength of this alloy is low, which would limit its applications. To obtain an Mg alloy with better mechanical performance and more extensive application range, in the present research, the Zn content of the Mg-Zn-Y-Nd alloy has been increased significantly, and the Y and Nd contents have also increased moderately. Therefore, an Mg-Zn-Y-Nd alloy with three different Zn contents have been fabricated, and their microstructure and tensile deformation behavior at different temperatures were investigated to clarify the effect of Zn content on microstructure evolution and mechanical properties.
The investigated alloys with nominal compositions of Mg-4Zn-1.2Y-0.8Nd, Mg-6Zn-1.2Y-0.8Nd, and Mg-8Zn-1.2Y-0.8Nd were melted in an electric resistance furnace under a protective atmosphere of CO2 and SF6 in ratio of 100:1. Alloying elements Zn, Y, and Nd were added in the form of pure Zn (100%) and Mg-25Y (wt%), Mg-25Nd master alloys, respectively. The melts were poured into a mild steel crucible preheated to 200-300 °C with a diameter of 150 mm. The microstructures of the three as-cast alloys were observed by scanning electron microscope (SEM). The constitute phases were determined by X-ray diffraction (XRD) and transmission electron microscope (TEM). The phase compositions were analyzed by energy-dispersive spectroscope (EDS) attached in SEM and TEM. Samples for SEM observation were grinded, polished, and chemical-etched with a solution of 5% nitric acid and 90% alcohol. Samples for TEM observation were prepared by twin-jet thinning electrolytically in a solution of 10% nitric acid and 90% methanol at - 20 °C, and the twin-jet current is maintained at 40 mA. SEM observation was performed on Phnom Pro, and TEM observation was performed on JEM2100 at an acceleration voltage of 200 kV. Thermal analyses were taken using differential scanning calorimeter (DSC) with a heating rate of 5 °C/min.
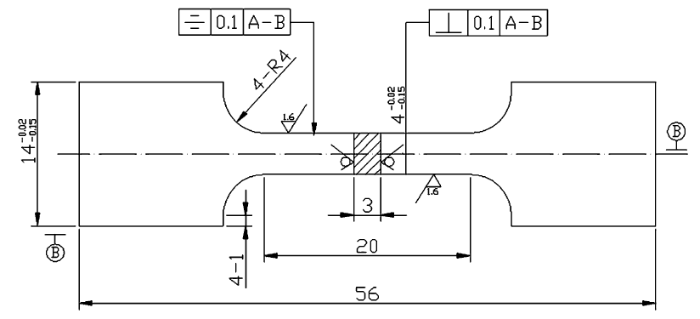
The specimens for tensile test were machined as shown in Fig. 1, and the tests were conducted on an INSTRON 5582 testing machine with a heating chamber at 21, 250, and 350 °C with an initial strain rate of 1 × 10⁻³ s-1. At least three identical tensile tests were performed at each temperature. The tensile tests at 250 and 350 °C were conducted to determine the deformability of the Mg-Zn-Y-Nd alloy at elevated temperatures, which would provide guidance for the hot extrusion process in the future investigation on the Mg-Zn-Y-Nd alloy. After tensile tests, the fracture surfaces and longitudinal sections cut from the fractured specimens were examined on SEM.
Fig. 1 Schematic diagrams of standard tensile specimen
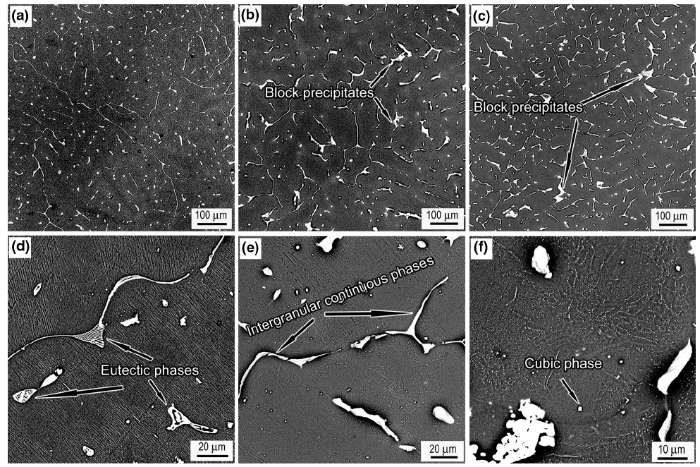
Figure 2 shows the microstructures of three as-cast Mg-Zn-Y-Nd alloys with different Zn additions. Clearly, the as-cast alloy specimens are composed of α-Mg matrix and secondary phases. By comparing SEM images of three alloys with different Zn contents in Fig. 2a-c, it can be seen that with the increase in Zn content, the content of secondary phase increases. The volume fraction of secondary phases was measured by image analysis software, and the results indicate that the volume fractions of secondary phases in these alloys with Zn contents of 4, 6, and 8% are 3.77, 5.18, and 6.70%, respectively. In the Mg-4Zn-1.2Y-0.8Nd alloy, the secondary phases at the grain boundary are continuous long strip and eutectic morphology, and the secondary phases in the grain interior are granular and rod-like morphology. As the Zn content increases to 6 and 8%, the grain boundary secondary phases become thicker, and the secondary phases in the grain interior become continuous and large block morphology.
Fig. 2 SEM images of cast Mg-4Zn-1.2Y-0.8Nd a, d, Mg-6Zn-1.2Y-0.8Nd b, e, Mg-8Zn-1.2Y-0.8Nd c, f at low a-c, high d-f magnification
Further SEM observations shown in Fig. 2d-f revealed that most of the secondary phases in the grain interior exhibit eutectic morphology with a size of 5-20 μm and only small amount of block precipitates appear in the Mg-4Zn-1.2Y-0.8Nd alloy. With the increase in Zn content, large block precipitates increase, as shown in Fig. 2b and c. In addition, some dispersive cubic phases with a size of about 1 μm are observed in the alloy, as shown in Fig. 2f.
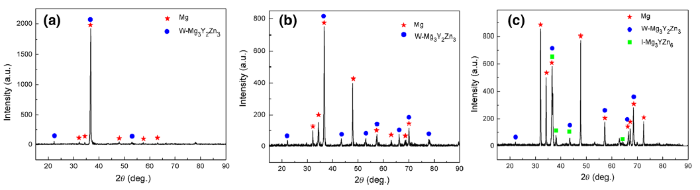
XRD analysis in Fig. 3 reveals that the increase in Zn addition promotes the precipitation of secondary phases in the alloy. In the Mg-4Zn-1.2Y-0.8Nd alloy, only a small amount of W-phase (Mg3Zn3Y2) can be detected. For the Mg-6Zn-1.2Y-0.8Nd alloy, the more 2 wt% addition of Zn increases the amount of W-phase. When the Zn content increases to 8 wt% (Mg-8Zn-1.2Y-0.8Nd), the peaks of W-phase become very strong and the peaks of I-phase (Mg3Zn6Y) start to emerge. Based on XRD patterns, it can be concluded that the W-phase and I-phase are the main secondary phases. However, due to the requirement of phase amount in XRD analysis, it still cannot confirm that no other phase precipitate in the alloy. Therefore, TEM observations are needed to characterize the tiny precipitates with small amount.
Fig. 3 XRD patterns of as-cast Mg-4Zn-1.2Y-0.8Nd a, Mg-6Zn-1.2Y-0.8Nd b, Mg-8Zn-1.2Y-0.8Nd c
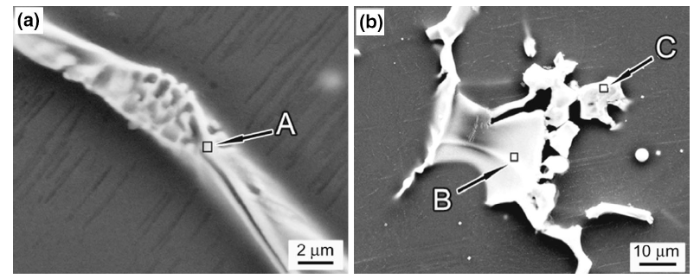
SEM and EDS analyses were conducted to investigate the composition of secondary phases in the alloys (Fig. 4 and Tables 1 and 2). According to the previous researches [26, 27], the Zn/Y ratio in the precipitate is usually used to distinguish between I-phase and W-phase in Mg-Zn-Y alloys. As shown in Fig. 4a and Table 1, the EDS result shows that the Zn/Y ratio in the phase with eutectic structure is 2.37 (at.%), which is close to that of W-phase (Zn/Y ratio is 1.5). Therefore, the eutectic phase can be confirmed as W-phase. The Zn/Y ratio in the center of the large block precipitate is similar to the eutectic phase, but the Zn/Y ratio of the small precipitate at the edge of the large block precipitate is 7.58, as shown in Table 2, which is close to that of I-phase (Zn/Y ratio is 6). It means that I-phase and W-phase coexist in the large block precipitate region.
Fig. 4 SEM images of eutectic a, large block precipitate b in as-cast Mg-6Zn-1.2Y-0.8Nd alloy
Table 1 EDS results of positions A and B in
| Element | wt% | at.% |
|---|---|---|
| Mg | 38.47 | 67.25 |
| Zn | 31.74 | 20.64 |
| Y | 18.21 | 8.71 |
| Nd | 11.57 | 3.41 |
Table 2 EDS results of position C in
| Element | wt% | at.% |
|---|---|---|
| Mg | 19.66 | 42.47 |
| Zn | 59.25 | 47.43 |
| Y | 10.59 | 6.26 |
| Nd | 10.50 | 3.82 |
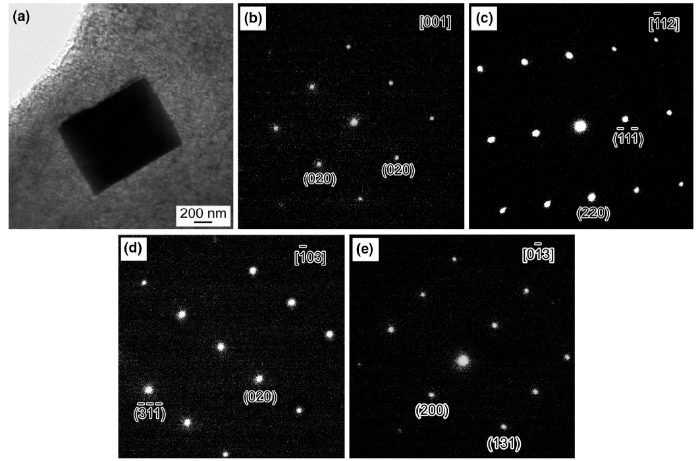
TEM electron diffraction analyses were performed to study the crystal structure of fine and dispersive cubic phases in the alloy, as shown in Fig. 5, indicating that the fine cubic phase has a face-centered cubic (fcc) structure with the lattice parameter of a = 0.52 nm. The composition of the cubic phase was detected with TEM-EDS method, and the result is illustrated in Table 3. It can be concluded that the fine cubic phase is Mg24Y5 phase [28].
Fig. 5 Bright-field TEM image a, selected area electronic diffraction (SAED) patterns b-e of cubic phase in as-cast Mg-6Zn-1.2Y-0.8Nd alloy
Table 3 EDS results of cubic phase in
| Element | wt% | at.% |
|---|---|---|
| Mg | 14.47 | 38.30 |
| Zn | 2.29 | 2.25 |
| Y | 80.48 | 58.22 |
| Nd | 2.76 | 1.23 |
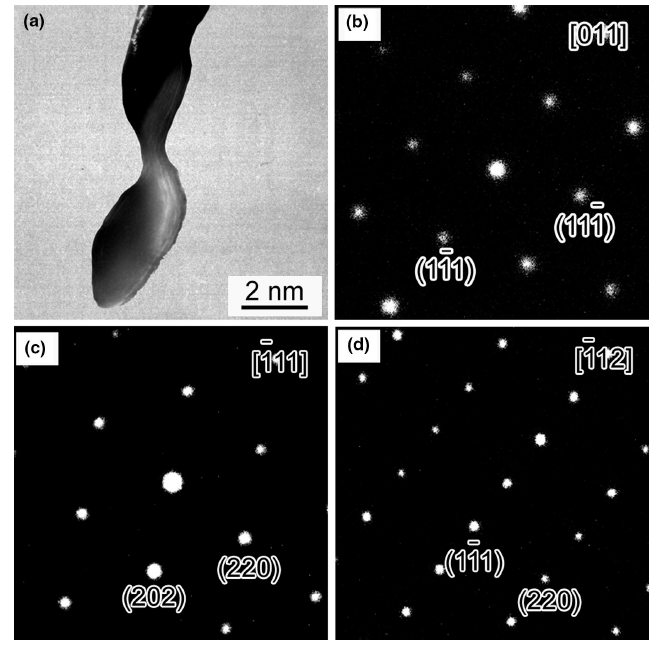
Furthermore, TEM electron diffraction analyses demonstrate that the grain boundary strip phases are fcc structure and the lattice parameter of which is a = 2.070 nm, as shown in Fig. 6. Since W-phase is fcc structure and its lattice parameter is a = 0.685 nm, the grain boundary strip phases have the same crystalline structure with W-phase, and the lattice parameter is nearly three times that of W-phase. According to the results reported by Luo et al. [29], the grain boundary strip phases should be W′-phase.
Fig. 6 Bright-field TEM image a, SAED patterns b-d of strip phase at grain boundary of as-cast Mg-4Zn-1.2Y-0.8Nd alloy
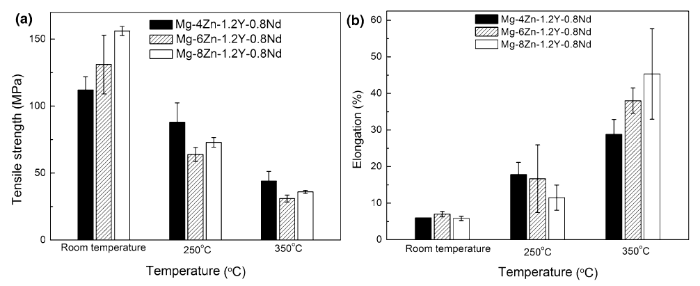
The tensile properties of the as-cast Mg-Zn-Y-Nd alloys with different Zn contents are illustrated in Fig. 7. The tensile strength increases with the increase in Zn content at room temperature. However, at 250 and 350 °C, the tensile strength decreases initially and then increases with the increase in Zn content, as shown in Fig. 7a. The variation tendency of the elongation with Zn content is shown in Fig. 7b. It can be seen that with the increase in Zn content, the elongation at room temperature increases initially and then decreases. At 250 °C, the elongation of the as-cast Mg-Zn-Y-Nd alloy decreases as Zn content increases. However, at 350 °C, the elongation increases with the increase in Zn content.
Fig. 7 Tensile test results of Mg-Zn-Y-Nd alloys with different Zn contents: a tensile strength; b elongation
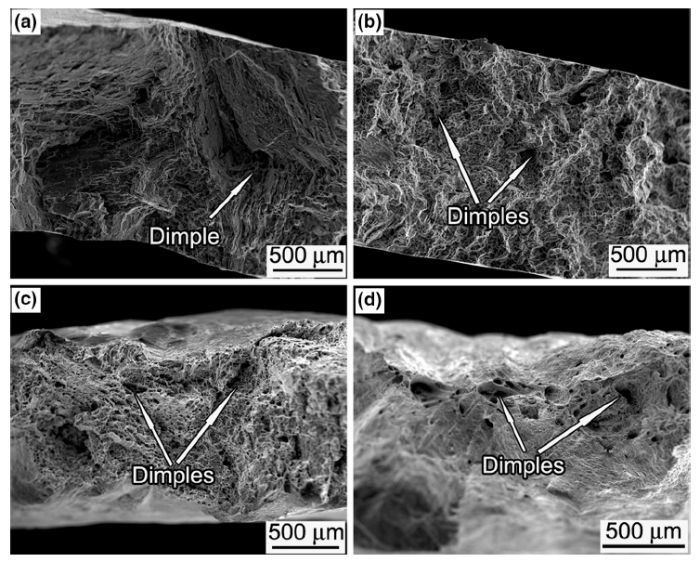
The typical facture surfaces observed by SEM are shown in Fig. 8. It can be seen that the facture surfaces of the alloys with different Zn contents after tensile tested at room temperature mainly consist of dimples, as shown in Fig. 8a, b. Moreover, there is no obvious shear lips to occur on the facture surfaces, which means that the plastic deformation of the as-cast Mg-Zn-Y-Nd alloys at room temperature is small. As the test temperature increases to 250 °C, the fracture surfaces of the three alloys all consist of dimples, which indicates that the tensile fractures of the three alloys are all ductile fracture mode, as shown in Fig. 8c. At 350 °C, the fracture surfaces also consist of dimples, as shown in Fig. 8d.
Fig. 8 SEM images of fracture surfaces of specimens after tensile test at different temperatures: a Mg-4Zn-1.2Y-0.8Nd alloy at room temperature; b Mg-8Zn-1.2Y-0.8Nd alloy at room temperature; c Mg-6Zn-1.2Y-0.8Nd alloy at 250 °C; d Mg-8Zn-1.2Y-0.8Nd alloy at 350 °C
The longitudinal section of the fractured specimens was observed to study the crack propagation path, and the typical results are exhibited in Fig. 9. It can be found from Fig. 9a, b, and c that the microcracks of Mg-Zn-Y-Nd alloys at room temperature propagate along the continuous precipitates. At 250 °C, the large eutectic and block phases near the fracture break and become microcrack initiation sites. Then, the microcracks propagate along continuous precipitates and lead to the final fracture, as shown in Fig. 9c, d. The longitudinal sections of tensile fractures tested at 350 °C are shown in Fig. 9e and f. The fluctuation of fracture surfaces are significantly. The α-Mg grains are elongated along the applied stress direction. The secondary phases break and distribute along the applied stress direction. As Zn content increases, the elongation extent of the α-Mg grain increases, and the broken secondary phases are more inclined to distribute parallelly to the applied stress direction, as demonstrated in Fig. 9f.
Fig. 9 SEM images of longitudinal section of fracture surfaces of specimens after tensile test at different temperatures: a Mg-4Zn-1.2Y-0.8Nd alloy at room temperature; b Mg-6Zn-1.2Y-0.8Nd alloy at room temperature; c Mg-4Zn-1.2Y-0.8Nd alloy at 250 °C; d Mg-6Zn-1.2Y-0.8Nd alloy at 250 °C; e Mg-4Zn-1.2Y-0.8Nd alloy at 350 °C; f Mg-6Zn-1.2Y-0.8Nd alloy at 350 °C
The DSC curves of Mg-Zn-Y-Nd alloys with different Zn contents are shown in Fig. 10. It can be seen that the peaks of the three alloys are similar during the heating process except for the extra endothermic peak at 350 °C for 8Zn alloy. The endothermic peaks can be expected to correspond to the melting of some compounds. The small peaks of 4Zn and 6Zn alloys at about 430 °C and 8Zn alloy at about 425 °C can be regarded as the melting of W′-phase phase. Geng et al. [30] has obtained the DSC curve of Mg63.5Zn34Y2.5 alloy and found that I-phase begin to decompose or melt at about 435 °C. Thus, in the present research, the peaks of 4Zn and 6Zn alloy at about 440 °C and of 8Zn alloy at 435 °C could be considered as the melting of I-phase. The last peaks, which are the largest peaks of the three alloys, appear at 492, 483, and 473 °C for the 4Zn, 6Zn, and 8Zn alloys, respectively. The investigation of Li in an as-cast Mg-Zn-Zr alloy shows that the endothermic peak of W-phase in the DSC curve initially appears at 490 °C [31]. Thus the last peaks of the present DSC curves can be referred as the melting of W-phase. Besides, the extra peak at 350 °C of 8Zn alloy may be the melting of Mg7Zn3, as in the previous study [32]. However, the Mg7Zn3 phase is metastable, and thus it would resolve in the matrix during the following solidification process.
Fig. 10 DSC curves of Mg-Zn-Y-Nd alloys with different Zn contents
As the above results, the solidification process of Mg-Zn-Y-Nd alloy could be deduced. During solidification, when the temperatures decrease to 492, 483, and 473 °C for the 4Zn, 6Zn, and 8Zn alloys, respectively, W-phase forms firstly in an eutectic reaction as follows:
$L \to \alpha - {\text{Mg}} + W - {\text{phase}}.$ (1)
Then, as the temperatures decrease to 440 °C for the 4Zn and 6Zn alloys and 435 °C for the 8Zn alloy, W-phase would react with the liquid phase as a peritectic reaction to form I-phase which is surrounding with W-phase:
$L + W - {\text{phase}} \to \alpha - {\text{Mg }} + \, I - {\text{phase}} .$ (2)
As the temperatures continue to decrease to 430 °C for the 4Zn and 6Zn alloys and 425 °C for the 8Zn alloy, W′-phase at grain boundary would precipitate as follows:
$L \to \alpha - {\text{Mg }} + \, {W^\prime } - {\text{phase}} .$ (3)
At last, due to the high Zn content in the 8Zn alloy, Mg7Zn3 would precipitate at about 350 °C:
$L \to \alpha - {\text{Mg }} + {\text{ M}}{{\text{g}}_7}{\text{Z}}{{\text{n}}_3}.$ (4)
Moreover, to express the effect of Zn content on the microstructure of the as-cast Mg-Zn-Y-Nd alloy, a schematic diagram is shown in Fig. 11. The microstructure of the as-cast Mg-Zn-Y-Nd alloy consists of grains and dendrites, as in Fig. 11a. As the secondary phases are formed mainly in the interdendritic region and along the grain boundary, the area with blue-dashed box in Fig. 11a is magnified to reveal the element segregation and secondary phase precipitation process during solidification, as shown in Fig. 11b-d. During solidification, the alloying elements tend to be expelled to the interdendrite and grain boundary areas which are the final solidification zones [33]. In Fig. 11b-d, the blue color at the interdendrite and grain boundary areas represents the element segregation. As Zn content increases, the blue color becomes darker and darker, which means the increase in the element segregated at the interdendrite and grain boundary areas. For 4Zn alloy, the Zn segregated at the interdendrite and grain boundary areas are low, and thus the continuous secondary phases formed at the grain boundary are thin, and the interdendritic secondary phases are small granular and rod-like shape, as indicated in Fig. 11b. While for the 6Zn and 8Zn alloy, as shown in Fig. 11c and d, the Zn segregated at the interdendrite and grain boundary areas increases, and therefore the continuous secondary phases formed at the grain boundary become thicker, and the secondary phases formed in the interdendritic area become larger and continuous. Especially for the Mg-8Zn-1.2Y-0.8Nd alloy, the secondary phases present as skeleton shape along the interdendritic area.
Fig. 11 Schematic diagrams of precipitation of secondary phases in Mg-Zn-Y-Nd alloy with different Zn contents: a morphology of grain and dendrite; element segregation and secondary phase precipitation at the grain boundary and interdendritic regions in 4Zn b, 6Zn c, 8Zn d alloys (b-d shows the magnification of the area with blue-dashed box in a)
According to the results mentioned above, the increase in Zn content leads to increased volume fraction of secondary phases in the as-cast Mg-Zn-Y-Nd alloys. More importantly, as Zn content increases, the peak of I-phase in the DSC curves becomes stronger, which means an increase in I-phase content. I-phase appears in the alloys as large block coexistence of W-phase and I-phase. As can be found from Fig. 2, the large block phase increases with the increase in Zn content, which is a confirmation of the above analysis. Previous work [26, 27, 34] indicates that the Zn/Y ratio in Mg-Zn-Y alloy has an important influence on the formation of secondary phases. When the Zn/Y weight ratio is 5-7, Mg-Zn-Y alloys mainly consist of α-Mg matrix and I-phase. When the Zn/Y ratio is 1.5-2, the Mg-Zn-Y alloys mainly consist of α-Mg matrix and W-phase; when the Zn/Y ratio is 2-5, the Mg-Zn-Y alloys mainly consist of α-Mg matrix, W-phase, and I-phase. Therefore, the increase in Zn/Y ratio would promote the formation of I-phase in Mg-Zn-Y alloy. As Zn content increases from 4 to 8%, the Zn/Y ratio increases, and thus the I-phase formation is promoted. In fact, this phenomenon can be explained by the solidification process of the alloy. I-phase (Mg3Zn6Y) contains more Zn than W-phase (Mg3Zn3Y2). During solidification, when the Zn content is relatively low, the enrichment of Zn, Y, and Nd in the liquid would lead to the precipitation of W-phase [27, 35]. The formation of W-phase may consume the Zn, Y, and Nd in the liquid. As the Zn content of the alloy increases, the enrichment amount of Zn in the liquid increases, the formation of W-phase would not be able to consume the Zn, and it is necessary to form I-phase and consume more Zn. Thus, the precipitates around the W-phase in Mg-6Zn-1.2Y-0.8Nd and Mg-8Zn-1.2Y-0.8Nd alloy are I-phase.
The influence of Zn content on tensile properties of the as-cast Mg-Zn-Y-Nd alloy varies with the testing temperature. At room temperature, with the increase in Zn content, the tensile strength increases while the elongation variation is relatively small and increases initially and then decreases, as shown in Fig. 7a. The analysis shows that the increase in Zn content leads to increase in the volume fraction of secondary phases, which causes the strengthening of Mg-Zn-Y-Nd alloy [36, 37]. Thus the tensile strength increases with the increase in Zn content. The ductility of the α-Mg matrix is very low at room temperature. The fracture surface observation shows that the tensile cracks in Mg-Zn-Y-Nd alloy propagate along the intergranular and interdendritic continuous precipitates. In 4Zn alloy, the secondary phases exhibit continuous shape at the grain boundary, and granular or rod-like shape in the interdendritic regions. Therefore, the tensile microcracks propagate along the grain boundary continuous secondary phases. While Zn content increases from 4 to 6%, the secondary phases in the interdendritic regions become large and semi-continuous. The tensile microcracks would grow along the semi-continuous secondary phases, and therefore the elongation of the alloy increases slightly as Zn content increases from 4 to 6%. As Zn content increases from 6 to 8%, the secondary phases would become more continuous, and their volume fraction would increase. The investigation of Li on the as-cast Mg-Zn-Zr alloy shows that the continuous networks of intergranular phases would deteriorate the elongation of the alloy [31]. Moreover, Chen et al. has studied the mechanical property of as-cast ZW21 alloy and the result indicates that the interdendritic eutectic W-phase with discontinuous laths and large-sized pools would be crack initiation sites and is harmful to the mechanical properties [38]. Therefore, in the present research, as Zn content increases from 6 to 8%, the increased volume fraction of secondary phases would increase the crack initiation sites and then reduce the ductility of the alloy, and thus the elongation decreases.
At 250 °C, as Zn content increases, the tensile strength decreases initially and then increases slightly, while the elongation decreases, as shown in Fig. 7a and b. Based on the observations to the fracture surfaces and longitudinal sections of fractured specimens, the cracks of all three alloys are formed along with intergranular large eutectic or block phases and grow along the continuous phases [28, 29]. Therefore, the secondary phases are the main factor affecting the tensile performance at 250 °C. Meanwhile, the α-Mg matrix is softened at 250 °C. For Mg-4Zn-1.2Y-0.8Nd alloy, the granular and rod-like secondary phases in the grain interior would play a strengthening role for the α-Mg matrix. As Zn content increases from 4 to 6%, the intragranular secondary phases become larger and the amount of secondary phases increases. As a result, the crack initiation site increases, and the tensile strength and elongation decrease. As Zn content increases from 6 to 8%, the interdendritic secondary phases become continuous and act as skeletons which would strengthen the alloy, and therefore the tensile strength increases. However, the interdendritic secondary phases would provide crack initiation sites and propagation paths during tensile at 250 °C. As Zn content increases, the interdendritic secondary phases become larger and more continuous, which would be beneficial for the fracture of the alloy. Therefore, the elongation of the as-cast Mg-Zn-Y-Nd alloy at 250 °C decreases as the Zn content increase.
At 350 °C, as shown in Fig. 7, with the increase in Zn content, the elongation increases and the tensile strength decreases initially and then increases slightly. Due to the improved deformability of the α-Mg matrix at 350 °C, the elongation of the as-cast Mg-Zn-Y-Nd alloy at 350 °C is higher than that at room temperature and 250 °C. According to the longitudinal section observation of the fractured specimens in Fig. 9e, f, the α-Mg grains are elongated along the applied stress direction, and the secondary phases are completely broken. It can be deduced that during tensile test at 350 °C, the continuous and large block secondary phase is broken and thus loses is function as skeletons to the α-Mg matrix, and thus the tensile strengths of Mg-6Zn-1.2Y-0.8Nd and Mg-8Zn-1.2Y-0.8Nd alloy are lower than Mg-4Zn-1.2Y-0.8Nd alloy at 350 °C. In addition, during tensile at 350 °C, the deformability of the α-Mg matrix increases significantly. The broken secondary phases would redistribute linearly along the deformation direction of the α-Mg matrix. As Zn content increases, the density of the secondary phases increases and thus would promote microcrack initiation parallel to the applied stress direction. Therefore, it can be inferred that during tensile at 350 °C, the microcracks along the tensile stress direction increases as Zn content increases. However, such kind of microcrack propagates slowly and would not cause rapid fracture of the specimen. The final fracture of the specimen relies on the cracks perpendicular to the tensile stress direction. Accordingly, during tensile at 350 °C, as Zn content increases, the microcracks would be more inclined to be parallel to the applied stress direction, the final fracture of the specimen would be postponed, and the elongation would be increased.
(1) The as-cast Mg-4Zn-1.2Y-0.8Nd alloy mainly consists of α-Mg matrix and W-phase. W-phase exists as eutectic form. As Zn contents increases to 6 and 8%, W-phase exists as both eutectic and block form. I-phase precipitates around the block W-phase. In addition, the intergranular phase in these three alloys is W′-phase, and the fine cubic phase dispersed in the alloys is Mg24Y5 phase.
(2) As Zn content increases, the amount of secondary phase increases, which leads to the variation of tensile performance of the as-cast Mg-Zn-Y-Nd alloys.
(3) At room temperature, as Zn content increases, the strength of the as-cast Mg-Zn-Y-Nd alloy increases, and the elongation increases first and then decreases.
(4) At 250 °C, with the increase in Zn content, the tensile strength of as-cast Mg-Zn-Y-Nd alloy decreases initially and then increases, while the elongation decreases.
(5) At 350 °C, with the increase in Zn content, the elongation of the as-cast Mg-Zn-Y-Nd alloys increases, and the variation tendency of the tensile strength decreases initially and then increases.
This work was supported financially by the Shenzhen Technology Innovation Plan (Nos. CXZZ20140731091722497 and CXZZ20140419114548507), the Shenzhen Basic Research Project (Nos. JCYJ20150529162228734, JCYJ20160407090231002, JCYJ20150625155931806 and JCYJ20160427100211076) and The Thirteen Five National Key Research and Development Plan (No. 2016YFC1102601).
The authors have declared that no competing interests exist.

 WeChat
/
| 〈 |
|
〉 |