Search for articles:
Kapil Sirohi , Suresh Kumar, Virender Singh, Anil Vohra
Corresponding authors:
Received: 2017-06-2
Revised: 2017-07-25
Online: 2018-03-20
Copyright: 2018 Editorial board of Acta Metallurgica Sinica(English Letters) Copyright reserved, Editorial board of Acta Metallurgica Sinica(English Letters)
More
Abstract
In this work, (1-x)CdO-xSnO2 nanocomposites (≤ 0.15) have been synthesized via hydrothermal route. The structural study reveals that CdO nanostructures possess crystalline phase and cubic structure. The CdO-SnO2 nanocomposites possess both cubic and orthorhombic structure with good crystallinity. The crystallite size in the nanocomposites was found to be in the range of 9.6-19.6 nm. Field emission scanning electronic microscopy and high-resolution tunnelling microscopy analysis confirm the presence of both cubic and orthorhombic structures which is also confirmed from X-ray diffraction studies. Fourier transform infrared spectroscopy (FTIR) studies confirm that CdO-SnO2 nanocomposites possess the characteristics band of both CdO and SnO2 nanostructures. The UV-visible absorption studies confirm that the optical absorption band in CdO-SnO2 nanocomposites possesses both blue and red shift as compared to that of CdO nanostructures. Photoluminescence spectroscopy studies reveal the appearance of strong emission peak at 513, 469 and 369 nm corresponding to green, blue and violet emission spectrum, respectively, in CdO-SnO2 nanocomposites. The FTIR studies confirm the presence of hydroxyl and water functional group due to atmospheric water vapours and chemical bonding in CdO and CdO-SnO2 nanocomposites. Raman spectroscopy confirms the presence of Raman bands of both CdO and SnO2 phases in the CdO-SnO2 nanocomposites.
Keywords:
Nanocomposites play very important role in the field of nanoscience and nanotechnology for their potential application in the areas of optoelectronics, sensing, photocatalysis, mainly due to their unusual electrical and optical properties [1]. ZnO, CdO and SnO2 are important class of oxides, and their nanostructures have been studied widely in optoelectronic and solar cell devices [2, 3, 4, 5]. There are lots of researches reported on the nanocomposites of these materials synthesized by various physical and chemical techniques. Zhang et al. [6], Jia et al. [7], Karami [8], Meshram et al. [9], Mosquera et al. [10] and Erten-Ela [11] synthesized CdO-ZnO nanocomposites and studied their gas sensing, antibacterial and photocatalytic properties. Hamrouni et al. [12] and Chen et al. [13] studied the sensing and photocatalytic properties of ZnO-SnO2 nanocomposite. But there are very few reports found on nanocomposite behaviour of CdO-SnO2 in the literature. Godines et al. [14] fabricated composite thin film of CdO-SnO2 via sol-gel technique and studied its transparent conducting oxide behaviour. Hasan et al. [15] prepared CdO-SnO2 thin film by pulse laser deposition method on glass substrate and demonstrated their optical and electrical properties. In the recent years, both CdO and SnO2 nanostructures have been studied individually by many researchers for applications in optoelectronics [3, 4]. Therefore, a study on CdO-SnO2 composite materials is required to explore its properties at nanoscale level for its applications in future nanoelectronic devices.
Both CdO and SnO2 nanostructures are very important nanomaterials that have numerous electronic applications. CdO is a II-VI n-type semiconductor that possesses large energy band gap, low electrical resistivity and high optical transmittance, and therefore, its properties need to be exploited for its applications in optoelectronic devices [13, 16, 17]. The energy band gap of CdO nanostructures lies between 2.2-2.5 eV (direct) and 1.36-1.98 eV (indirect) [10]. CdO possesses wide energy band gap, low electrical resistivity and high optical transmission in visible region, which make it suitable for various optoelectronic applications like photodetector, transparent conducting oxide, solar cell, sensor, phototransistor [17, 18]. SnO2 is also an important and well-studied n-type semiconductor with wide direct energy band gap of 3.6 eV and an indirect energy band gap of 2.6 eV [19, 20]. Tin oxide nanostructures have been studied for potential applications in optoelectronic devices, transparent conducting oxide in solar cells, solid-state sensors, Li-ion batteries and photocatalysis [3, 21].
In this work, CdO-SnO2 nanocomposites have been synthesized via hydrothermal technique and their structural, morphological and optical properties have been studied. The structure and morphology have been studied using X-ray diffraction (XRD), field emission scanning electron microscopy (FESEM), high-resolution transmission electron microscopy (HRTEM) and energy-dispersive spectroscopy (EDS). The optical properties have been evaluated using UV-visible spectroscopy, Raman and photoluminescence spectroscopy for potential applications in electronic devices.
For the synthesis of (1-x)CdO-xSnO2 nanocomposites, all the required chemicals such as cadmium chloride monohydrate (CdCl2·H2O), stannous chloride pentahydrate (SnCl4·5H2O) and sodium hydroxide (NaOH) were of analytical grade. All the chemicals were used in various experiments without further purification.
In the synthesis of CdO-SnO2 nanocomposite, four samples of (1-x)CdO-xSnO2 nanocomposites with four different compositions (x = 0, 0.05, 0.10 and 0.15) were prepared from the aqueous solutions of cadmium chloride, stannous chloride and sodium hydroxide. The solutions of cadmium chloride with varying molar concentrations of CdCl2·H2O, i.e. 0.047 mol/L (solution A1), 0.044 mol/L (solution A2) and 0.42 mol/L (solution A3), were prepared by dissolving it in de-ionized water in three different beakers. Three aqueous solutions of stannous chloride with varying concentrations of SnCl4·5H2O, i.e. 0.002 mol/L (solution B1), 0.005 mol/L (solution B2) and 0.007 mol/L (solution B3), were prepared by dissolving it in distilled water in three separate beakers. In another beaker, a third stock solution of NaOH (solution C) was prepared by dissolving 0.05 mol/L of sodium hydroxide in DI water.
The solution A1 and solution B1 were mixed properly under constant stirring for 2 h in a beaker at temperature of 60-70 °C to obtain a mixed solution containing cadmium and tin (solution D1). Now in solution D1, few drops of sodium hydroxide solution (solution C) were added drop-wise under constant stirring and the mixture was kept for 3-4 h for complete formation of white precipitates. After this, the solution was transferred into a Teflon-lined stainless steel pressure reactor (100 mL) and heated at 90 °C for 24 h. The sample was taken out from the reactor and then washed several times with de-ionized water and ethanol during filter to separate the white precipitates. The extracted sample was dried at 80 °C for 24 h and crushed into powder. The obtained sample in the form of powder was then calcined at 350 °C for 3 h to form CdO-SnO2 nanocomposites. Similar steps were repeated for other two concentrations of cadmium chloride and stannous chloride with subsequent addition of solution C for the preparation of CdO-SnO2 nanocomposites of other concentration. Pure CdO nanostructures were also synthesized from an aqueous solution of 0.05 mol/L CdCl2·H2O by adding sodium hydroxide as a reducing agent.
The as-prepared (1-x)CdO-xSnO2 nanocomposite samples were characterized using XRD (X’PERT-PRO Phillips), FESEM (Zeiss EVO 40), HRTEM (Tecnai G2, 200 kV), UV-visible spectroscopy, Raman spectroscopy and photoluminescence spectroscopy.
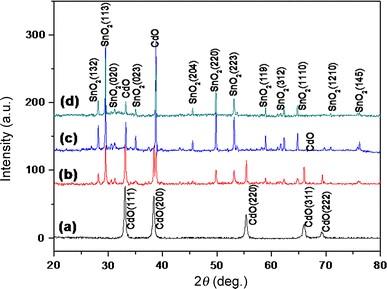
Figure 1 shows the XRD patterns of (1-x)CdO-xSnO2 nanocomposites. The results in Fig. 1a reveal the diffraction peaks at angles 33.01°, 38.26°, 55.30°, 65.87° and 69.22° corresponding to (111), (200), (220), (311) and (222) crystal planes, suggesting the formation of pure CdO nanostructures without any impurities and secondary phases, which is in good agreement with the values in the JCPDS file (75-0594). Pure CdO nanostructures exhibit good crystalline and face-centred cubic structure. Ravichandran et al. [22] also observed similar structural characteristics and phases of CdO nanostructures synthesized via chemical precipitation method. The crystalline size of CdO nanostructures with respect to high intense peaks for the crystal planes (111) and (200) was estimated using the Debey-Scherer’s equation [22]:
\[D=\frac{0.94{λ}}{βcosθ},\ \ (1)\]
where λ is the wavelength of the X-ray radiation (0.154056 nm), θ is diffraction angle and β is the full width of half maximum (FWHM). The crystalline size was calculated to be in the range of 9.6-13.1 nm. The lattice constant (a, c) was also estimated from the XRD data using the following equation and found to be 0.46952 nm that closely matches with the lattice constants of standard JCPDS data file (75-0594) for CdO:
\[d_{hkl}=\frac{a}{\sqrt{(h+k+l)}},\ \ (2)\]
\[\frac{1}{d^2}=\frac{h^2+k^2}{a^2}+\frac{l^2}{c^2},\ \ (3)\]
where (h, k, l) is the crystal plane index and d hkl is the corresponding crystal plane spacing. The XRD patterns of (1-x)CdO-xSnO2 nanocomposites shown in Fig. 1b-d present some extra diffraction peaks recorded at angles of 28.02°, 29.58°, 31.27°, 35.07°, 45.44°, 50.09°, 53.04°, 58.96°, 62.34°, 64.88°, 70.96° and 75.88°, corresponding to (132), (113), (020), (023), (204), (220), (223), (119), (312), (1110), (1210) and (145) crystal planes in addition to CdO peaks without altering the structures of CdO. These extra peaks obtained in CdO-SnO2 nanocomposites may attribute to SnO2 with orthorhombic structure that match well with JCPDS data file (78-1063). The crystallite size as calculated by Debey-Scherer’s equation [23] in CdO-SnO2 nanocomposites was estimated to be in the range of 9.6-19.6 nm. The lattice constants were calculated using Eq. (3) and found to be a = 0.4513 nm, b = 0.5747 nm and c = 1.7300 nm that correspond to high intense peak at an angle of 29.58°, which is in good agreement with the standard JCPDS file data (78-1063). Therefore, this results reveal that the as-prepared nanocomposites consist of both phases of CdO and SnO2, confirming the formation of CdO-SnO2 nanocomposites.
Fig. 1 XRD patterns of (1-x)CdO-xSnO2 nanocomposites for x = 0 a, x = 0.05 b, x = 0.10 c, x = 0.15 d
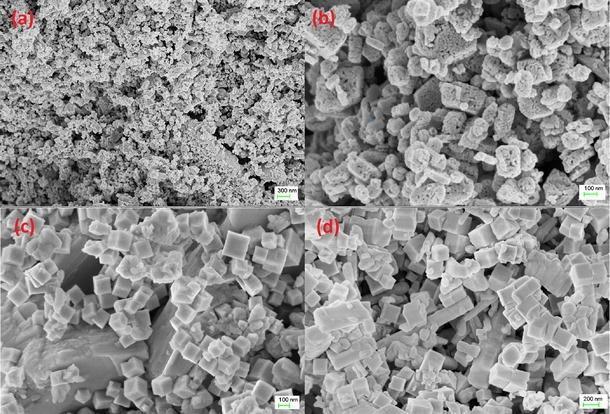
Figure 2a shows the SEM image of pure CdO (x = 0) where the random distribution of the nanostructures having cubic shape with good separation can be clearly seen. Figure 2b shows the morphology of (1-x)CdO-xSnO2 nanocomposites (x = 0.05), revealing that the addition of SnO2 in CdO exhibits the agglomeration of small nanostructures of CdO and SnO2 with both cubic and orthorhombic types. Figure 2c, d shows the SEM images of the (1-x)CdO-xSnO2 nanocomposites (x = 0.10, 0.15) that clearly shows the formation of CdO-SnO2 nanocomposites with both cubic and orthorhombic structures. The SEM images in Fig. 2b-d confirm the formation of both cubic and orthorhombic structures corresponding to CdO and SnO2, respectively, in the prepared nanocomposites. The results are in good accordance with those obtained from XRD analysis. Therefore, the FESEM results confirm that CdO-SnO2 nanocomposites were successfully synthesized via a low-cost hydrothermal technique with both cubic and orthorhombic structures and good crystallinity at nanoscale.
Fig. 2 FESEM images of (1-x)CdO-xSnO2 nanocomposites for x = 0 a, x = 0.05 b, x = 0.10 c, x = 0.15 d
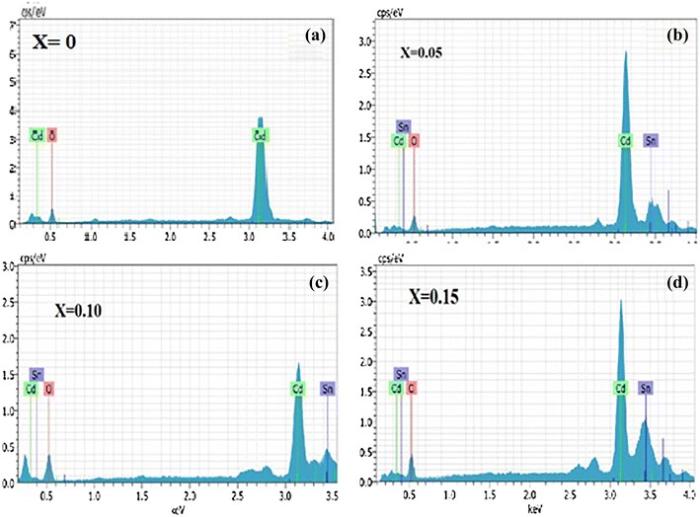
Figure 3a shows the EDS spectrum of pure CdO nanostructures, indicating the presence of Cd and O only. Figure 3b-d shows the elemental composition of (1-x)CdO-xSnO2 nanocomposites. The EDS spectra shown in Fig. 3b-d indicate the presence of Sn, O and Cd in the prepared CdO/SnO2 nanocomposite. The weight percentage of the (1-x)CdO-xSnO2 nanocomposites matches with their stoichiometric composition well. The quantitative analysis which indicates the atomic ratio of Cd, Sn and O in (1-x)CdO-xSnO2 nanocomposites is shown in Table 1. Other peaks appeared in the EDS spectra may be the introduction of others during sample preparation.
Fig. 3 EDS spectra of (1-x)CdO-xSnO2 nanocomposites for x = 0 a, x = 0.05 b, x = 0.10 c, x = 0.15 d
Table 1 Quantitative analysis of (1-x)CdO-xSnO2 nanocomposites for x = 0, 0.05, 0.10 and 0.15
| Sample | Weight percentage of element (%) | Atomic percentage of element (%) | ||||
|---|---|---|---|---|---|---|
| Cd | Sn | O | Cd | Sn | O | |
| x = 0 | 76.12 | - | 23.88 | 31.20 | - | 68.80 |
| x = 0.05 | 77.72 | 4.90 | 17.38 | 38.02 | 2.27 | 59.71 |
| x = 0.10 | 58.75 | 10.74 | 30.51 | 20.74 | 3.59 | 75.67 |
| x = 0.15 | 60.49 | 16.50 | 23.01 | 25.44 | 6.57 | 67.99 |
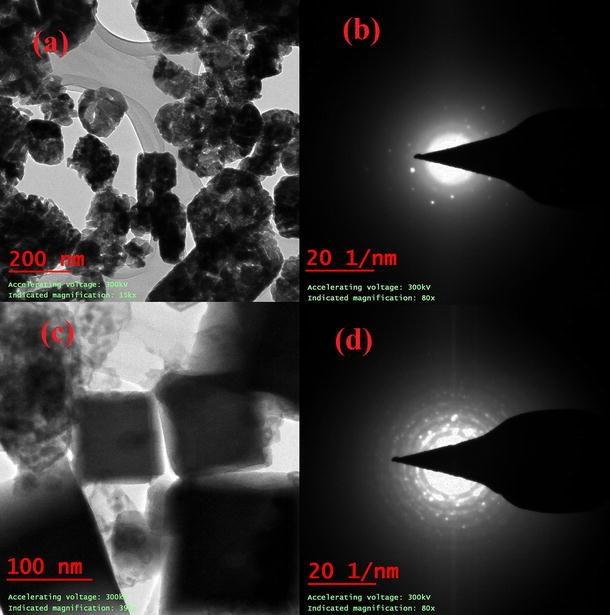
Figure 4a, c depicts the TEM images of (1-x)CdO-xSnO2 nanocomposites synthesized via hydrothermal technique for x = 0 and x = 0.10. The image of the pure CdO shows clusters consisting of small nanosize particles with different sizes. The size of the clusters of the CdO nanostructures is found to be in the range of 90-150 nm with fcc structure. The average size of the CdO nanostructures is found to be in accordance with the average size of 13-19 nm as evaluated from Scherer’s formula. The selected-area electron diffraction (SAED) pattern of pure CdO nanostructure shown in Fig. 4b exhibits the continuous bright spots that attribute to the single-crystalline nature. The TEM results are found to be similar to XRD results of pure CdO nanostructures.
Fig. 4 HRTEM images a, c and SAED patterns b, d of (1-x)CdO-xSnO2 nanocomposites for a, b x = 0, c, d x = 0.10
Figure 4c shows the TEM image of (1-x)CdO-xSnO2 nanocomposites for x = 0.10. The image clearly shows both cubic and orthorhombic shapes of nanostructures of CdO and SnO2, respectively. The cluster size of the nanostructures of SnO2 and CdO is in the range of 100-150 nm, showing the agglomerations of SnO2 and CdO nanostructures. The SAED pattern of the CdO-SnO2 nanocomposites shown in Fig. 4d exhibits a number of bright spot diffraction rings with clear boundaries due to polycrystalline nature.
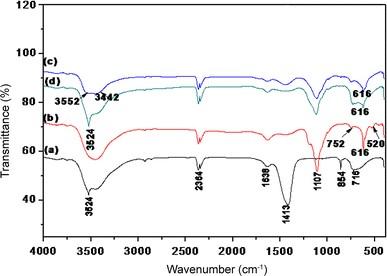
FTIR was used to determine the chemical bonding and functional groups in CdO and CdO-SnO2 nanostructures in the wave number range of 400-4000 cm-1. Figure 5a shows the FTIR spectrum of pure CdO nanostructure with the bands at ~ 3524, ~ 2364, ~ 1638, ~ 1413, ~ 854 and ~ 716 cm-1. The broad absorption band at ~ 3524 cm-1 can be attributed to the O-H stretching vibration of H2O on the surface of CdO, and the band at ~ 2364 cm-1 can be assigned to anti-symmetric stretching vibration of CO2 band [24]. The band located at ~ 1638 cm-1 is assigned to the H2O bending mode [17]. The OH/H2O functional group presents in the system may be due to atmospheric water vapours [20]. The broadbands located at ~ 1413, ~ 1107, ~ 854 and ~ 716 cm-1 observed as CdO stretching modes [17]. The FTIR spectra of (1-x)CdO-xSnO2 nanocomposites for x = 0.05, 0.10 and 0.15 as shown in Fig. 5b-d present the additional bands at ~ 616 and ~ 520 cm-1. The band at ~ 616 cm-1 can be assigned to the anti-symmetric O-Sn-O stretching mode of SnO2, and band at ~ 520 cm-1 is due to terminal oxygen vibration in SnO2 nanostructures. Seema et al. [25], Kumar et al. [26], Tan et al. [27] and Kumar et al. [28] also demonstrated similar stretching vibrations in SnO2 nanostructures. Therefore, the presence of characteristics bands of CdO and SnO2 in CdO-SnO2 nanocomposites clearly indicates the incorporation of SnO2 nanostructures in the CdO nanostructures. The slight shift of the bands located at 3524 to 3442 cm-1 and broadening of the band from 3442 to 3552 cm-1 are the evidences of the physical interactions between the CdO and SnO2 nanostructures.
Fig. 5 FTIR spectra of (1-x)CdO-xSnO2 nanocomposites for x = 0 a, x = 0.05 b, x = 0.10 c, x = 0.15 d
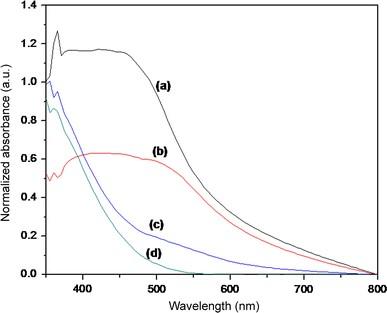
The UV-visible spectroscopy was used to study the absorption behaviour of (1-x)CdO-xSnO2 nanocomposites. Figure 6 shows the normalized absorption spectra of (1-x)CdO-xSnO2 nanocomposites recorded at the room temperature in the wavelength range of 350-800 nm. The absorption spectrum of pure CdO is shown in Fig. 6a, revealing the broad absorption bands from ~ 380 to ~ 460 nm. Anandhan et al. [29] reported a similar evidence of absorption band spectra in CdO nanostructure synthesized via wet chemical method. It is also evident from Fig. 6 that the absorption band edge appears at nearly 554 nm in pure CdO nanostructures. The absorption band edges of the (1-x)CdO-xSnO2 nanocomposites for x = 0.05, 0.10 and 0.15 were shifted nearly to 560, 451 and 440 nm, respectively, as depicted in Fig. 6b-d. The UV-Vis absorption spectra of CdO-SnO2 nanocomposites show that the optical absorption bands first shift towards higher wavelength region and then shift towards lower wavelength region with the percentage of SnO2. Therefore, both red and blue shifts exit in the CdO-SnO2 nanocomposites compared to CdO nanostructures.
Fig. 6 Normalized absorption spectra of (1-x)CdO-xSnO2 nanocomposites for x = 0 a, x = 0.05 b, x = 0.10 c, x = 0.15 d
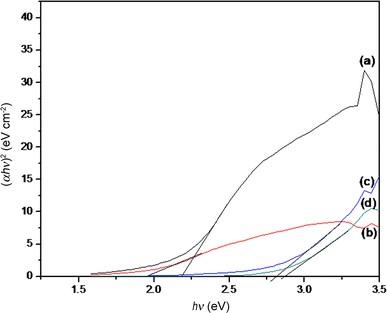
The optical band gap energies of (1-x)CdO-xSnO2 nanocomposites are calculated by extrapolation of the linear portion of the Tauc’s plots between (αhv)2 and hv and are shown in Fig. 7. The Tauc’s relation, also known as energy exponential relation [30], is given by following equation:
(αhv)n=B(hv-Eg), (4)
where α is the absorption coefficient, B is the constant, hv is the incident energy of photon, Eg is the band gap energy and n is an index that may have a value 2, 3, 1/2 and 1/3, depending on band-to-band transition. The optical energy band gap of pure CdO nanostructure is found to be 2.21 eV as shown in Fig. 7a, and the band gap energies of (1-x)CdO-xSnO2 nanocomposites for x = 0.05, 0.10 and 0.15 are 1.96, 2.80 and 2.87 eV, respectively, as depicted in Fig. 7b-d and presented in Table 2. It is evident from the analysis that the energy band gap of CdO-SnO2 nanocomposites can be tuned by controlling the concentration of SnO2 in the nanocomposite and therefore may have potential application in electronic devices.
Fig. 7 Touc’s plots of (1-x)CdO-xSnO2 nanocomposites for x = 0, 0.05, 0.10, 0.15
Table 2 Crystalline size and band gaps of (1-x)CdO-xSnO2 nanocomposites for x = 0, 0.05, 0.10 and 0.15
| Sample | Crystalline size (nm) | Band gap (eV) |
|---|---|---|
| x = 0 | 9.6-13.1 | 2.21 |
| x = 0.05 | 13.6-19.6 | 1.96 |
| x = 0.10 | 11.5-13.3 | 2.80 |
| x = 0.15 | 10.9-19.4 | 2.87 |
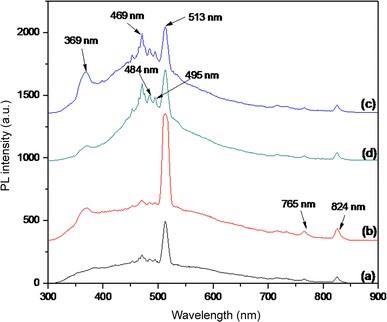
The photoluminescence spectroscopy (PL) was used to study the optical emission properties of (1-x)CdO-xSnO2 nanocomposites for x = 0, 0.05, 0.10 and 0.15. The PL spectra of (1-x)CdO-xSnO2 nanocomposites were recorded at an excited wavelength of 300 nm at room temperature. The PL spectrum of pure CdO shown in Fig. 8a reveals that the maximum strong emission occurs at ~ 513 nm which attributes to green emission spectrum at band gap of 2.4 eV comparable to near-band-edge emission of CdO nanostructures. Yang et al. [31] and Rajesh et al. [32] reported similar PL emission spectra. Such strong emission peak can be due to recombination of electrons in the conduction band and holes in the valence band. The PL spectra of (1-x)CdO-xSnO2 nanocomposites for x = 0.05, 0.10 and 0.15 shown in Fig. 8b-d depict significant effect on the photoluminescence intensities of the nanocomposites with the coupling of SnO2 and CdO nanostructures. It is clearly evident that as the concentration of SnO2 is increased, the peak intensity firstly increases and then subsequently decreases. At the same time, some additional PL peaks at ~ 369, ~ 469, ~ 485 and ~ 495 nm were also observed in CdO-SnO2 nanocomposites. Tan et al. [27] observed similar emission peaks for SnO2 nanostructures synthesized by hydrothermal method. Two more small intensity peaks at 765 and 824 nm were also observed which may arise due to the defects occurred in the nanocomposites during the growth.
Fig. 8 PL spectra of (1-x)CdO-xSnO2 nanocomposites for x = 0 a, x = 0.05 b, x = 0.10 c, x = 0.15 d
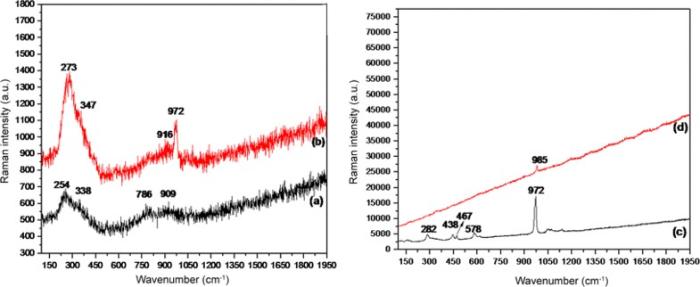
The Raman spectra of (1-x)CdO-xSnO2 nanocomposites are shown in Fig. 9. The Raman spectrum of pure CdO nanostructures shown in Fig. 9a consists of one major sharp and broadband peak centred at ~ 254 cm-1 which is spanned from 150 to 500 cm-1. Kumar et al. [33, 34] and Cusco et al. [35] observed similar peaks in CdO nanostructures synthesized by co-precipitation method spanned from 200 to 500 cm-1. The other two weak peaks were also observed and are located at ~ 786 and ~ 909 cm-1. One more additional peak located at ~ 338 cm-1 on the shoulder of major peak ~ 254 cm-1 was also observed. All these four peaks observed can be assigned as transverse optical (TO) and longitudinal optical (LO) modes of cubic CdO nanostructures which arise due to stress induced by surface effects in nanostructures [17, 36]. Cusco et al. [35] described these types of two modes in CdO nanostructures which may occur due to the second-order Raman scattering found in CdO.
Fig. 9 Raman spectra of (1-x)CdO-xSnO2 nanocomposites for x = 0 a, x = 0.05 b, x = 0.10 c, x = 0.15 d
The Raman spectrum of (1-x)CdO-xSnO2 nanocomposites for x = 0.05 shown in Fig. 9b presents the Raman bands located at ~ 273, ~ 347, ~ 916 and ~ 972 cm-1, which are red shifted as compared to CdO nanostructures. It is observed that the intensity of the Raman bands increases due to the increase in the size of the nanostructures in the nanocomposites. The Raman spectrum of (1-x)CdO-xSnO2 nanocomposites for x = 0.10 shown in Fig. 9c depicts Raman bands at 282, 438, 467, 578 and 972 cm-1 and observed some additional Raman bands compared to pure CdO nanostructures. The additional bands located at 438, 467 and 578 cm-1 are related to SnO2 nanostructures. The Raman bands at 438 and 467 cm-1 can be assigned to Eg vibrational modes of SnO2 nanostructures, and the band located at ~ 578 cm-1 may be assigned to A1g mode of SnO2 [37]. The Raman spectrum of (1-x)CdO-xSnO2 nanocomposites for x = 0.15 shown in Fig. 9d presents only one Raman band located at 985 cm-1. It is also observed that the other Raman bands disappear or may have very low intensities with increasing concentration of SnO2 in the nanocomposites.
The (1-x)CdO-xSnO2 nanocomposites with different values of x were successfully synthesized by the hydrothermal technique, and their structure, morphology and optical properties were investigated. The XRD analysis confirmed that CdO and CdO-SnO2 nanocomposites exhibit crystalline nature and possess cubic and orthorhombic structures. Studies of FESEM and HRTEM confirmed the formation of CdO and CdO-SnO2 nanocomposites with different phases and sizes of the nanostructures in the nanocomposites. The EDS studies revealed the stoichiometric composition of Sn, O and Cd in the nanocomposites. The FTIR analysis confirmed the presence of hydroxyl and water functional group and chemical bonding of CdO and SnO2 nanostructures in CdO and CdO-SnO2 nanocomposites. It is observed that the optical band gap of CdO first decreases with SnO2 and then increases and therefore exhibits both red and blue shift in the nanocomposites. The strong emissions at 513, 469 and 369 nm were observed in the PL spectra of CdO-SnO2 nanocomposites which belong to green, blue and violet emission spectra, respectively. The Raman spectra confirmed the shift of TO and LO optical modes of CdO and Eg and A1g modes of SnO2 in CdO-SnO2 nanocomposites. The results point out that CdO-SnO2 nanocomposites are a promising candidate for electronic and optoelectronic applications owing to tunable band gap and other optical properties. Further studies on CdO-SnO2 nanocomposites will be carried out to find its more application in other fields.
The authors have declared that no competing interests exist.

 WeChat
/
| 〈 |
|
〉 |