Acta Metallurgica Sinica(English Letters), 2017, 33(5): 461-468
doi: 10.1016/j.jmst.2017.01.021
Plasma electrolytic oxidation of the magnesium alloy MA8 in electrolytes containing TiN nanoparticles
D.V. Mashtalyara,b,*,, S.V. Gnedenkova, S.L. Sinebryukhova, I.M. Imshinetskiya, A.V. Puz’a

Abstract:

The formation of protective multifunctional coatings on magnesium alloy MA8 using plasma electrolytic oxidation (PEO) in an electrolytic system containing nanosized particles of titanium nitride was investigated. Electrochemical and mechanical properties of the obtained layers were examined. It was established that microhardness of the coating with the nanoparticle concentration of 3 g l-1 increased twofold (4.2 ± 0.5 GPa), while wear resistance decreased (4.97 × 10⁻⁶ mm3 N-1 m-1), as compared to respective values for the PEO-coating formed in the electrolyte without nanoparticles (2.1 ± 0.3 GPa, 1.12 × 10⁻⁵ mm3 N-1 m-1).

Key words: Magnesium alloys; Protective coatings; Plasma electrolytic oxidation; Corrosion; titanium nitride; Nanoparticles;
1. Introduction

Recently, the fields of industrial application of magnesium (Mg) alloys have been significantly extended [1-4]. Aerospace industry has been the main consumer of Mg alloys for quite a long time. However, during the last decades, a serious competition for the fuel consumption reduction has been developed in the automobile manufacture. In particular, one of the focuses here is the reduction of vehicle weight. The trend to further reduce automobile parts weight and assemblies forces designers to examine more thoroughly Mg alloys. Mg alloys can be easily produced through casting and mechanical processing, which allows manufacturing parts of complex shapes. As a result, in some cases Mg alloys are capable to replace aluminum and iron alloys from some parts and assemblies. Although engine parts, shock absorbers, and wheel disks made of Mg alloys are already used in presently manufactured vehicles, high corrosion rate and low wear resistance significantly limit their extensive application [5,6].

The main method of improving their corrosion and mechanical resistance of Mg alloys parts is deposition of protective lacquer-paint or galvanic coatings [7,8]. At the same time, it appears reasonable to apply plasma electrolytic oxidation (PEO) in order to eliminate main disadvantages of Mg alloys [9-12]. During PEO process, the working materials, e.g. Mg alloy parts, are treated by applying high voltages, in comparison with conventional anodisation. Plasma discharges occur on the electrode surface at the critical values of the electric field strength (up to 1-10 MV cm-1). The temperature and pressure inside the discharge channel attain up to 10,000 °C and 100 MPa, respectively. During PEO process, an intensive ion and electric transfer is realized. This process promotes the electrochemical and plasma-chemical synthesis of coating materials with electrolyte components [13,14]. After discharge attenuation, a sharp cooling of melt down to the electrolyte temperature is realized. This process affects the physicochemical properties of the formed surface layers [15,16]. The above method enables one to obtain protective coatings on different metals and alloys without requiring thorough surface preparation prior to treatment, and forms anticorrosion and wear-resistant surface layers with high adhesion to substrates [17,25].

One of the advantages of PEO method is the possibility of modifying the obtained coating properties through variation of processing conditions and electrolyte composition, also by embedding various organic and inorganic nanoparticles [26-29]. Nanosized particles enable one to dramatically modify the properties of such coatings or to impart them with new features. Application of this method can yield anticorrosion, antifriction, magnetoactive, catalytic, and other types of coatings, thus significantly extend the fields of application of the treated alloys [30-36].

Addition of nano-alumina into the electrolyte for PEO (micro-arc oxidation) [37] results in improvement of mechanical and corrosion properties of the formed coatings. Microhardness of the coatings containing nanoparticles increases almost twofold as compared to those without nanoparticles. Here, the corrosion current density decreases 7-fold. Use of cerium oxide nanoparticles is possible to increase the protective function of the PEO coatings [38]. Corrosion current density for these layers decreases by 2 orders of magnitude. One of the fields where the PEO-coatings with modified nanoparticles can be applied is biomedicine. Incorporation of silver nanoparticles into the surface layers imposes an antibacterial effect [39]. Bioactive coatings can be produced by oxidation using hydroxyapatite particles as electrolyte additives [40]. The presence of hydroxyapatite particles on the surface increases bone regeneration and enhances adhesion of bone tissue to the implant. However, using of titanium nitride nanoparticles as a component of electrolyte for PEO are not reflected in the scientific literature. Titanium nitride is actively and extensively used in formation of protective coatings on metals and alloys by different methods, such as plasma or magnetron sputtering deposition and physical vapor deposition [41-44].

The present work aims to study the properties of PEO coatings on Mg alloy MA8 obtained in a silicate-fluoride electrolyte with addition of titanium nitride (TiN) nanoparticles. This compound was characterized with hardness, chemical stability, and high melting point (2930 °C). PEO coating modification by such nanoparticles can result in a substantial improvement of the material protective properties.

2. Experimental

Rectangular plates of Mg alloy МА8 (1.5 wt%Mn, 0.15 wt%Ce, Mg balance) with dimensions of 15 mm × 20 mm × 2 mm were used for the present study. Prior to oxidation, surface conditions of all specimens were standardized through mechanical treatment by grinding papers of different grain sizes (600, 800, and 1200), washing with distilled water, and degreasing by alcohol.

Based on our previous study [21], an electrolyte containing sodium fluoride (5 g l-1) and silicate (15 g l-1) was selected for PEO treatment in the present work. Titanium nitride nanopowder (CAS 25583-20-4) with a mean particle size of 20 nm produced by ABCR GmbH company (Germany) was introduced into the electrolyte to produce composite coatings. PEO coatings on Mg alloy MA8 were formed in the working electrolytes containing varying concentration of titanium nitride particles from 1, 2, 3, to 4 g l-1, respectively. During the PEO coating growth, 0.5 g l-1 of an anionic surfactant (sodium dodecylsulfate) was used to stabilize the dispersed system for the maximum embedding of particles into the coatings. Conductivity of the electrolytes (15-16 mS cm-1) over the entire concentration range (0-4 g l-1) was measured by a HI 255 Hanna Instruments conductometer.

The coating process was carried out using a plasma electrolytic oxidation device equipped with a conventional reversible thyristor rectifier as power supply [21]. The frequency of polarizing pulses was 300 Hz and the duty cycle was 50%. All samples were treated in a two-stage bipolar PEO-mode. At the first stage, the anodic component was set galvanostatically at a current density of 0.5 А cm-2; and the cathodic phase was set potentiostatically at -30 V. The duration of the first PEO-stage was 200 s. The anodic voltage attained 300 V at this stage. During the second stage for 600 s the anodic component was reduced potentiodynamically from 300 to 200 V, and the cathodic one was changed from -30 to -10 V.

Electron micrographs of sample surfaces were obtained using a Carl Zeiss EVO 40 electron microscope (Carl Zeiss, Germany). Elemental composition of surface layers was determined by energy dispersive spectroscopy (EDS) using an INCA x-act energy-dispersive analyzer (Oxford Instruments, USA).

Coatings porosity was determined by analyzing SEM images obtained at the same magnification using the ImageJ software. The fraction occupied by pores with respect to the entire visible surface area was calculated.

To provide qualitative and quantitative estimation of the intensity of the embedded nanoparticles in the samples, the samples were studied after the PEO treatment. X-ray diffraction (XRD) analysis of surface layers was carried out using a D8 Advance X-ray diffractometer with Cu Kα radiation (Bruker, Germany) with 2θ angle ranging from 10° to 80° at a scanning rate of 0.02° s-1.

Electrochemical properties of the surface layers formed on Mg alloy MA8 were studied through potentiodynamic polarization and electrochemical impedance spectroscopy (EIS). Measurements were performed using a VersaSTAT MC device (Princeton Applied Research, USA). 3% aqueous solution of NaCl was used as electrolyte. Working area was set as 1 cm2. To attain the electrochemical equilibrium, samples were stabilized in the electrolyte for 30 min. To perform EIS measurements, a sinusoidal signal with a 10 mV (rms) amplitude was used. Spectra were recorded at an open circuit potential in the range of 0.02 Hz-1 M Hz in logarithmic sweep 10 points per decade. During the EIS measurements, the free corrosion potential was stabilized potentiostatically (steady state conditions). The sweep rate of potentiodynamic measurements was equal to 1 mV s-1. Samples were polarized in anodic direction from the potential of E = EC-300 mV up to -0.6 V (EC: corrosion potential). The potentiodynamic polarization and EIS data were analyzed using CorrView/ZView software. The corrosion tests were repeated three times for reliability and reproducibility. The statistic error was less than 5%.

Levenberg-Marquardt (LEV) method was used to fit the measured polarization curves (i.e. values of potential, E, and current density, I) to the following equation:

$$I=I_c(10^{\frac{E-E_c}{\beta_a}}+10^{-\frac{(E-E_c)}{\beta_c}})\ \ (1)$$

where E is potential, I is current density, IC is corrosion current density, βc is the slope of cathodic polarization curve and βa is the slope of anodic polarization curve.

Polarization resistance (Rp) was determined as the inverse of the slope of I vs. E plot recorded at potentiodynamic polarization in the potential range of EC ± 0.015 V at a sweep rate of 0.167 mV s-1 in a separate experiment.

Mechanical property tests, in particular, determination of microhardness and elasticity modulus of the coatings materials were carried out using a DUH-W201 dynamic ultramicrohardness tester (Shimadzu, Japan). Measurements of the universal microhardness (Hμ) were carried out on a cross-section using a Vickers indenter at a load of 50 mN.

Tribological tests were performed using a Tribometer (CSM Instruments, Switzerland) in accordance with the ‘ball-on-plate’ scheme. A ball of a diameter of 10 mm made of silicon nitride was used as counterbody. All the studies were carried out under dry friction and ambient conditions (25 °С and relative humidity of 50%). A normal load (Fn) was 10 N. The linear rotation rate was equal to 50 mm s-1, and the track diameter was 10 mm. The experiment was terminated in the moment of the coating wear. Estimation of the cross-section area S for the wear track upon tribological tests was carried out using a MetekSurtronic 25 precision contact profilometer. Material wear W was calculated using equation W = ΔVsample/(LFn), where ΔVsample is the sample volume loss during the test, L is the distance, and Fn is the applied normal load. The sample volume loss was calculated as ΔVsample = S l, where l is the track length.

Adhesion properties of surface layers were studied by scratch testing, using a Revetest Scratch Tester (CSM Instruments, Switzerland). The experiments were carried out at a preset track length of 5 mm selected empirically and an even load increase from 1 up to 30 N at a rate of 10 N min-1. For scratch testing, a Rockwell diamond indenter was used. The following parameters were determined for each type of coatings: Lc2 is the load at which chippings appeared along the track edges upon indenter passage; and Lc3 is the load at which the coating was scratched down to the substrate.

All experiments were carried out at least on 4 samples. The collected data for each parameter were processed statistically and presented in text as average mean ± standard deviation.

3. Results and Discussion

The external appearance of surface layers obtained in electrolytes containing titanium nitride nanoparticles is substantially different from that of the PEO-layer formed in the silicate-fluoride electrolyte without nanoparticles (base electrolyte). The color of coating formed in the base electrolyte is light beige (Fig. 1(a)). For the coating formed in the electrolytes with TiN, color changes from light gray to dark gray with the increase of particle concentration from 1 g l-1 to 4 g l-1 (Fig. 1(b)-(e)), because TiN nanoparticles have a black color. SEM micrographs reveal the difference in the surface morphology (Fig. 2(a), (c), (e), (g), (i)) and cross-section (Fig. 2(b), (d), (f), (h), (j)) of PEO-layers obtained in electrolytes without and with different contents of TiN nanoparticles. At the concentration of 2 g l-1 and higher, one observes ‘new formations’ on the surface as marked by arrows in Fig. 2(e), (g) and (i), which is attributed to the incorporation of the particle agglomerates into the coating material during PEO treatment. According to the EDS analysis, the formations on the coatings contain titanium (Fig. 3).

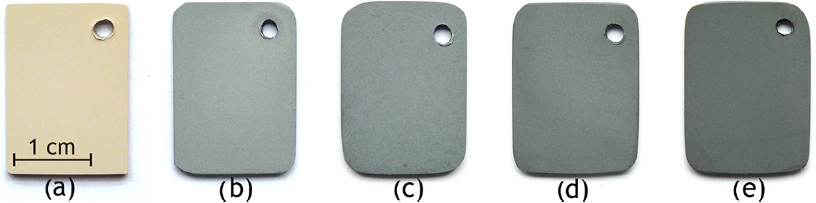
Fig. 1. Optical images of Mg alloy MA8 samples with PEO coatings formed in silicate-fluoride electrolyte without (a) and with TiN nanoparticle concentrations of 1 g l-1 (b), 2 g l-1 (c), 3 g l-1 (d) and 4 g l-1 (e).

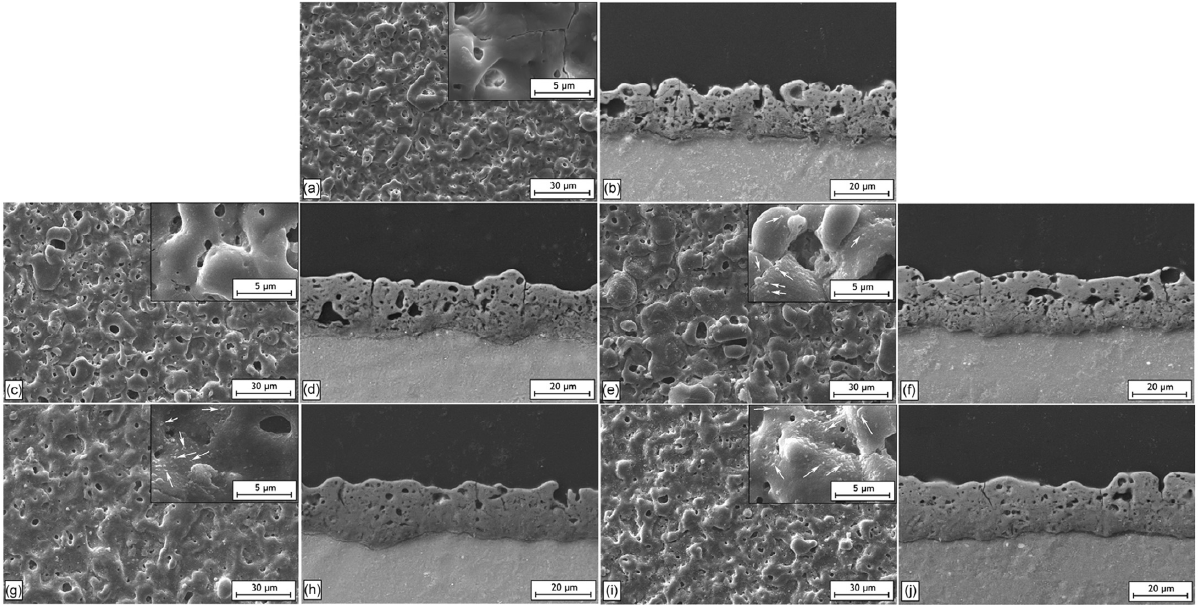
Fig. 2. SEM images of surfaces (a, c, e, g, i) and cross-sections (b, d, f, h, j) of coatings obtained in silicate-fluoride electrolyte without (a, b) and with TiN nanoparticle concentration of 1 g l-1 (c, d), 2 g l-1 (e, f), 3 g l-1 (g, h) and 4 g l-1 (i, j) (The arrows show the particle agglomerates on the coating surface).

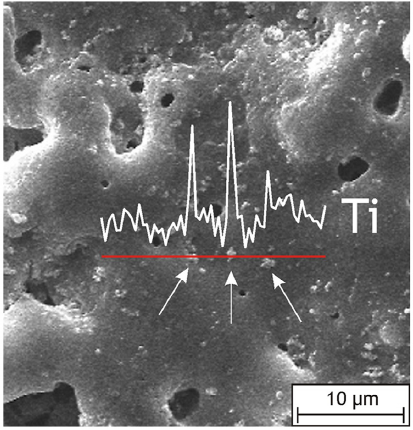
Fig. 3. EDS analysis of coating surface. (The upper line (white) shows the distribution of titanium throughout the line scan (red); data are presented for coating formed in electrolyte with 4 g l-1 of TiN particles.).

The analysis performed using the ImageJ software enables us to estimate the porosity of the formed layers by calculating the ratio of the pore area to the whole visible area on both surface and cross-section SEM images ( Table 1). Due to the nature of PEO-coatings, the porosity measured on coating cross-section is greater than that obtained using the image of surface. The difference in porosity is determined from the features of the PEO-coating morphology. The cross-sectional images allow taking into account a larger number of pores, which are invisible on the SEM-images of the surface. In accordance with the obtained data, the presence of titanium nitride in the silicate-fluoride electrolyte results in the decrease in the apparent porosity of the formed coatings along with the increase inTiN concentration in the electrolyte (Table 1). This tendency is caused by the deposition of individual TiN particles and agglomerates of particles on the walls and bottom of the pores. It results in the decrease in pores size and porosity.


Table 1 Porosity and roughness of PEO coatings in silicate-fluroide electrolytes with different concentrations of TiN nanoparticles.
Concentration (g l-1) Porosity (%) Ra (μm) Thickness (μm) Average pore size (cross-section image) (μm)
Surface Cross-section
0 5.0 ± 0.4 16.8 ± 2.0 1.21 ± 0.11 20 ± 2 1.5
1 4.7 ± 0.4 14.0 ± 1.7 1.56 ± 0.16 19 ± 4 1.6
2 4.5 ± 0.4 13.5 ± 1.9 1.83 ± 0.14 21 ± 3 1.3
3 4.1 ± 0.4 12.2 ± 1.8 2.00 ± 0.20 20 ± 3 1.1
4 3.9 ± 0.3 11.9 ± 1.6 2.13 ± 0.19 21 ± 3 1.1

Table 1 Porosity and roughness of PEO coatings in silicate-fluroide electrolytes with different concentrations of TiN nanoparticles.

The increase in the nanoparticle concentration in electrolyte yields a decrease in average pore size (Fig. 2) and an increase in roughness parameter Ra (Table 1).

According to the X-ray diffraction analysis data (Fig. 4), the main components of the base coating formed on Mg alloy MA8 in the silicate-fluoride electrolyte are magnesium orthosilicate and magnesium oxide [21]. Changes in the coating phase compositions with the increase of the titanium nitride particle concentration were not registered by XRD. For comparison, the pattern of the TiN nanoparticles is presented in Fig. 4. It should be noted that the positions of some peaks for magnesium oxide and titanium nitride are close to each other, but not identical. For magnesium oxide, the most intense peaks are located at 2θ of 37.0°, 43.0°, 62.4°, 74.8° and 78.8°, while for TiN at 2θ of 36.7°, 42.6°, 61.8°, 74.0°, 78.0°, that allows one to reliably identify observed compounds. Therefore, the XRD analysis does not reveal the presence of TiN in investigated samples. Probably, a low level (less than 10%) of TiN nanoparticle concentration does not allow their detection in the coating by this method.

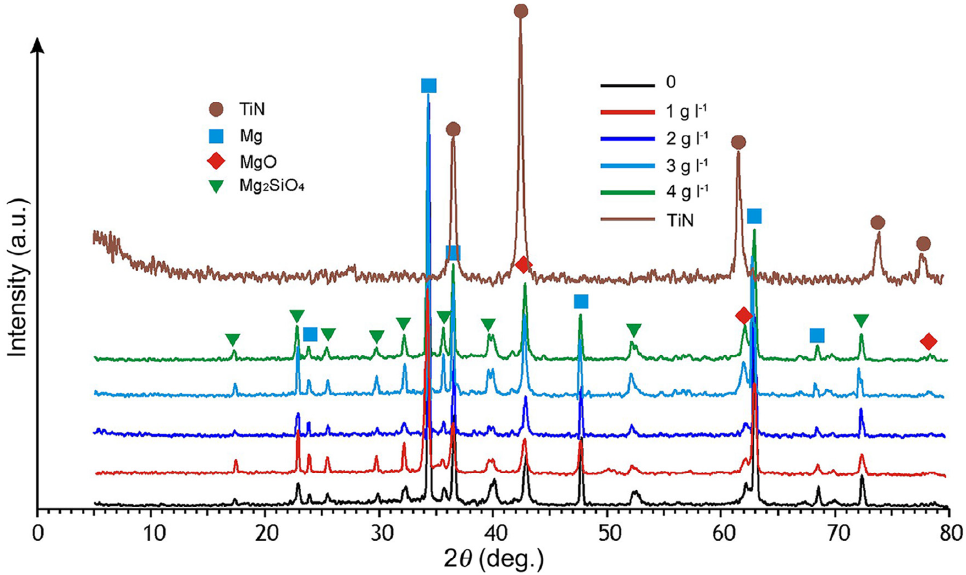
Fig. 4. XRD spectra of TiN powder and PEO coatings obtained in silicate-fluoride electrolyte without and with different concentrations of TiN nanoparticles.

Element analysis of the coatings surface (Table 2) demonstrates that the presence of titanium and nitrogen at the atomic ratio of 1:1 (weight ratio is 3.5) in the composition of PEO-coatings. It was established that the increase in titanium quantity in the coating was proportional to titanium particle concentration in the electrolyte. The data on the element distribution over the coating thickness (Fig. 5) show that the largest amount of nanoparticles are present in the upper part of coating. Incorporation of TiN particles into the PEO-coating occurs due to their negative charge, which is provided by the used surfactant [45]. Under anodic polarization in electric field, the particles move to the working sample and embed into the PEO-coating.


Table 2 Element compositions (wt%) of PEO coatings in silicate-fluroide electrolytes with different concentrations of TiN nanoparticles.
Concentration (g l-1) Element
Mg O Si Ti Na Mn N
0 39.4 38.2 18.3 - 1.2 2.9 -
1 41.9 38.1 15.1 1.0 1.9 1.7 0.3
2 42.5 37.5 14.5 1.1 2.4 1.7 0.3
3 40.1 38.0 15.3 1.8 2.6 1.7 0.5
4 38.6 37.8 16.1 2.2 3.1 1.6 0.6

Table 2 Element compositions (wt%) of PEO coatings in silicate-fluroide electrolytes with different concentrations of TiN nanoparticles.

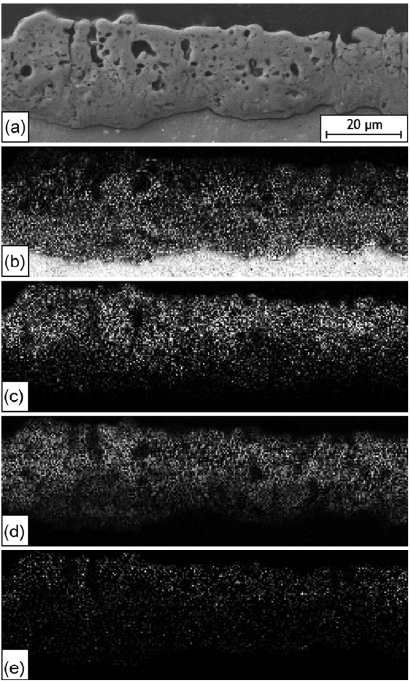
Fig. 5. Cross-sectional SEM image of PEO coating in silicate-fluoride electrolyte with 4 g l-1 TiN nanoparticles and EDS elemental map for Mg (b), Si (c), O (d), Тi (e).

Polarization curves (Fig. 6) demonstrate an insignificant deterioration of electrochemical properties of the coatings formed in the electrolytes with titanium nitride nanoparticles, as compared to those of the base PEO-layer. Corrosion current density (IС) for coatings containing nanoparticles increased from 1.2-fold to 6.6-fold depending on the TiN concentration in comparison with coatings obtained without the nanopowder (Table 3). Polarization resistance (Rp) for the coatings including titanium nitride nanoparticles decreases accordingly. The deterioration of the protective properties of the coatings containing nanoparticles is mainly attributed to the high conductivity of titanium nitride (electrical resistivity is equal to 2 × 10⁻⁷ Ω m [46]). Meanwhile, the coating containing nanoparticles of the conducting material continued to perform protective functions through decreasing corrosion current and increasing polarization resistance by two orders of magnitude, as compared to respective parameters of the Mg alloy without coating (IС = 5.3 × 10⁻⁵ A cm-2, Rp = 1.8 × 10³ Ω cm2[47]).

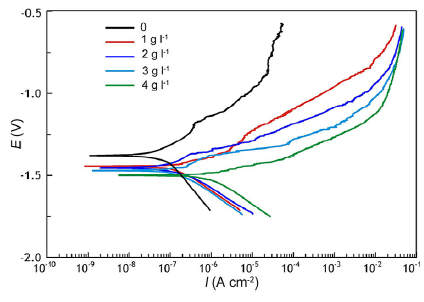
Fig. 6. Polarization curves of PEO coating on Mg alloy MA8 in 3% NaCl formed in silicate-fluoride electrolyte without and with different concentrations of TiN nanoparticles.


Table 3 Corrosion characteristics of PEO coating on Mg alloy MA8 in silicate-fluroide electrolytes with different concentrations of TiN nanoparticles.
Concentration (g l-1) βa (mV dec-1) βc (mV dec-1) Rp (Ω cm2) IС (A cm-2) EС (V vs. SCE)
0 302 ± 23 549 ± 25 (7.1 ± 0.5) × 105 (1.2 ± 0.1) × 10-7 -1.37 ± 0.03
1 114 ± 15 170 ± 9 (2.3 ± 0.3) × 105 (1.4 ± 0.1) × 10-7 -1.44 ± 0.04
2 162 ± 17 157 ± 7 (2.1 ± 0.3) × 105 (1.6 ± 0.1) × 10-7 -1.45 ± 0.03
3 118 ± 11 186 ± 8 (1.7 ± 0.2) × 105 (1.8 ± 0.2) × 10-7 -1.47 ± 0.02
4 61 ± 8 163 ± 6 (6.0 ± 0.4) × 104 (7.9 ± 0.6) × 10-7 -1.50 ± 0.04

Table 3 Corrosion characteristics of PEO coating on Mg alloy MA8 in silicate-fluroide electrolytes with different concentrations of TiN nanoparticles.

In the EIS spectra all the samples (Fig. 7), one observes two clearly expressed time constants (two extrema on the dependence of phase angle on frequency) with insignificant position transformation (shift of phase angle minimum versus frequency) and changes in the shift angle amplitude for the coatings obtained in the electrolytes with different titanium nitride contents. The impedance modulus measured at low frequency |Z|f 0 Hz decreases along with the increase in TiN concentration in the silicate-fluoride electrolyte. Analysis of the EIS spectra (Fig. 7) yields the conclusion that the experimental data can be adequately simulated by an equivalent electrical circuit (EEC) with two R-СРЕ- elements ( Fig. 8). In this circuit, R is resistance, and СРЕ is constant phase element, which is used instead of the capacitance. As a rule, the СРЕ usage is concerned with description of nonideal capacitors (heterogeneous surface layers differing in heterogeneity over composition and thickness, complex morphology, and the presence of charge carriers gradient over the oxide layer cross-section).

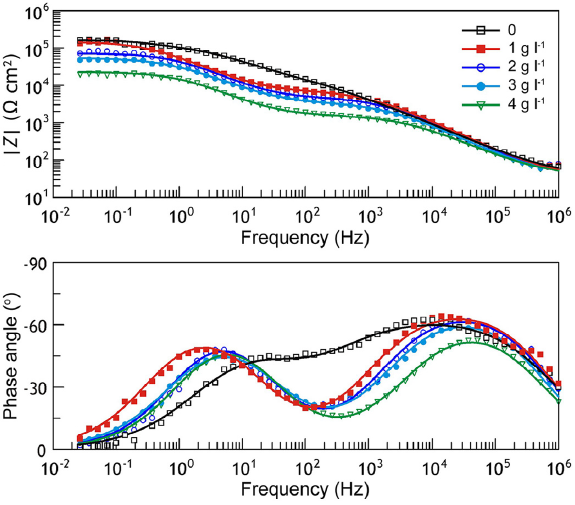
Fig. 7. Bode diagrams of PEO coatings on Mg alloy MA8 in silicate-fluoride electrolyte without and with different concentrations of TiN nanoparticles. (Symbols are the experimental data, while the solid lines are fitting curves).

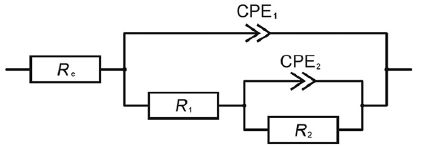
Fig. 8. Equivalent electric circuit used for simulation of charge transfer process at Mg alloy with coating/electrolyte interface, according to the experimental impedance spectra data.

CPE impedance is described by the following equation:

$$Z_{CPE}=\frac{1}{Q(j\omega)^n}\ \ (2)$$

where Q is frequency independent constant, n is exponential coefficient, ω is angular frequency (ω = 2πf, f is the frequency), and j is imaginary unit [48].

The element of the equivalent electric circuit (Re) is the electrolyte resistance. The value of this parameter in our experiments was constant and equal to 29-32 Ω cm2. In the EEC (Fig. 8), CPE1 is geometric capacity of the whole PEO-layer. R1 element that is parallel to CPE1 is responsible for the pore electric resistance to the ionic current. The parallel CPE2-R2 circuit serves to describe the process of charge transfer in the internal nonporous sublayer of the coating. The results of calculations of EEC elements parameters performed by simulation of the experimental EIS spectra using the suggested circuit are shown in Table 4. As seen from Fig. 7, the similarity of the experimental data and the theoretical curves validates the suggested model. In addition, the fitting accuracy is characterized by the chi-square parameter, which did not exceed 10-4.


Table 4 Calculated parameters of equivalent electric circuit elements (R, Ω cm2; Q, Ω-1 cm-2 сn. R1 and R2 are the resistances of porous and nonporous layers of coating, Q1 and Q2 are pre-exponential factors, and n is the exponential coefficient of CPEs) fitting experimental impedance spectra of PEO coating on Mg alloy MA8 in silicate-fluroide electrolytes with different concentrations of TiN nanoparticles.
Concentration (g l-1) |Z|f → 0 Hz (Ω cm2) R1 CPE1
-----------
R2 CPE2
------------
Q1 n Q2 n
0 1.4 × 10⁵ 1.91 × 10⁴ 4.09 × 10⁻⁷ 0.72 1.20 × 10⁵ 9.98 × 10⁻⁷ 0.77
1 1.3 × 10⁵ 7.16 × 10³ 1.60 × 10⁻⁷ 0.78 1.19 × 10⁵ 3.80 × 10⁻⁶ 0.78
2 8.8 × 10⁴ 4.81 × 10³ 1.65 × 10⁻⁷ 0.78 6.73 × 10⁴ 4.72 × 10⁻⁶ 0.80
3 5.2 × 10⁴ 3.42 × 10³ 2.13 × 10⁻⁷ 0.78 4.96 × 10⁴ 5.60 × 10⁻⁶ 0.76
4 2.1 × 10⁴ 1.56 × 10³ 3.82 × 10⁻⁷ 0.74 2.13 × 10⁴ 1.05 × 10⁻⁵ 0.79

Table 4 Calculated parameters of equivalent electric circuit elements (R, Ω cm2; Q, Ω-1 cm-2 сn. R1 and R2 are the resistances of porous and nonporous layers of coating, Q1 and Q2 are pre-exponential factors, and n is the exponential coefficient of CPEs) fitting experimental impedance spectra of PEO coating on Mg alloy MA8 in silicate-fluroide electrolytes with different concentrations of TiN nanoparticles.

According to the SEM micrographs (Fig. 2 and Table 1), the addition of titanium nitride into the base electrolyte produces the formation of a denser PEO-coating containing a small number of defects. According to the data shown in Table 4, the parameters of R1 and R2 characterizing the resistance of porous and nonporous layers, respectively, decrease in the coatings formed in electrolytes with nanoparticles, as compared to those of the coating produced in the base electrolyte. Such behavior results from high electroconductivity of titanium nitride, which affects resistive characteristics of coatings at its incorporation into the PEO-layer. The nonporous layer thickness can be characterized by preexponential factor Q2 taking into account the capacitive character of CPE2 (exponential coefficient n is close to 1). Thickness of this layer decreases along with the increase in the nanoparticles concentration of the electrolyte (the trend of Q2 increase). It is result of the decrease in the intensity of ion transfer at the electrolyte/coating interface and, therefore, the decrease of growth rate of coating.

As follows from the analysis of results obtained by the method of dynamic microhardness measurement (Table 5), the layers containing nanoparticles have microhardness (Hμ) attaining 4.5 ± 0.5 GPa, which is higher than that of the coatings formed in the base electrolyte (Hμ = 2.1 ± 0.3 GPa). The presence of 1 g l-1 of titanium nitride nanoparticles in the silicate-fluoride electrolyte does not virtually increase the hardness of the PEO-layer. The formation of coatings in the electrolyte containing titanium nitride in quantities of 2 g l-1 results in a nearly twofold increase in microhardness, as compared to that of the base coating. Thus, embedding of hard nanoparticles (i.e. titanium nitride) into PEO-layer significantly increases the general coating microhardness. The trend of the decrease of microhardness values at the nanoparticles concentrations above 2 g l-1 can be explained by the decrease in the intensity of the ion transfer at the coating/electrolyte interface and, as a result, the deterioration of the strength of the formed material, due to the formation of a more friable and weakly bound layer.


Table 5 Microhardness and elasticity modulus of PEO coatings formed on magnesium alloy МА8 with different concentrations of TiN nanoparticles.
Concentration (g l-1) Hμ (GPa) Young’s modulus (GPa)
0 2.1 ± 0.3 60 ± 5
1 2.2 ± 0.3 62 ± 7
2 4.5 ± 0.5 102 ± 12
3 4.2 ± 0.5 98 ± 10
4 3.7 ± 0.3 97 ± 10

Table 5 Microhardness and elasticity modulus of PEO coatings formed on magnesium alloy МА8 with different concentrations of TiN nanoparticles.

The external appearance of the scratch made to reveal the mechanism of the coating destruction is shown in Fig. 9 and Table 6. The increase in the nanoparticles concentration up to 3 g l-1 results in a monotonous increase in load LС2, at which the disruption of the coating adhesive strength is observed. The load LС3, at which the coating is wear fully (Fig. 9(b)-(d)), is increased also. Along with the increase in titanium nitride nanoparticle concentration in the silicate-fluoride electrolyte up to 4 g l-1, one observes some decrease in strength characteristics of PEO-coatings.

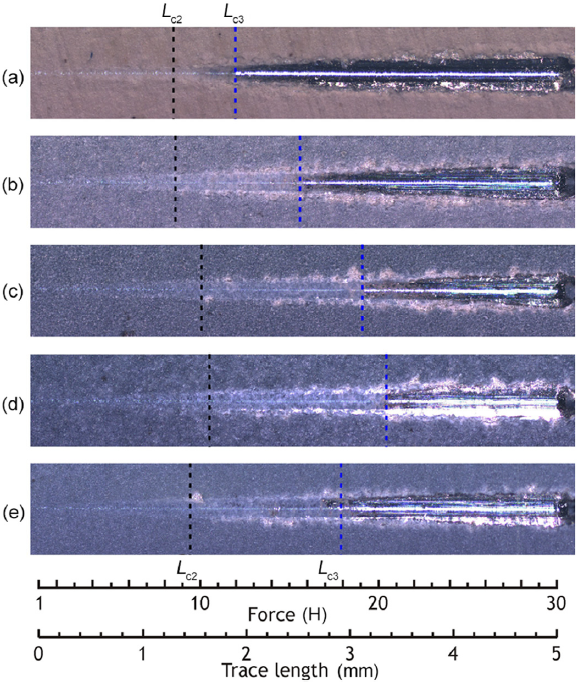
Fig. 9. External appearances of scratch for PEO coatings on Mg alloy MA8 in silicate-fluoride electrolyte without (a) and with TiN nanoparticle concentrations of 1 g l-1 (b), 2 g l-1 (c), 3 g l-1 (d) and 4 g l-1 (e).


Table 6 Critical loads of PEO coatings determined by scratch testing.
Concentration (g l-1) LС2 (N) LС3 (N)
0 8.4 ± 0.9 11.0 ± 1.5
1 8.6 ± 0.8 15.6 ± 1.7
2 10.1 ± 1.1 19.1 ± 1.3
3 10.5 ± 0.9 20.4 ± 1.9
4 9.3 ± 1.0 17.9 ± 1.6

Full-size table

Table 6 Critical loads of PEO coatings determined by scratch testing.

Fig. 10 shows the data of tribological tests as dependence of the friction coefficient (μ) on the number of cycles. In general, one observes the preservation of the trend of a positive effect of titanium nitride nanoparticles incorporated into coatings on their mechanical properties (Fig. 10 and Table 7). The abrasion of the coatings containing nanoparticles is less significant than that of the samples without nanoparticles. One observes a linear increase in the wear resistance parameters (Table 7) of the composite coatings produced in the electrolytes with the TiN nanoparticles concentrations up to 3 g l-1. For the coatings produced at the titanium nitride nanoparticles concentration in the electrolyte equal to 4 g l-1, one observes the deterioration of wear resistance (Table 7) and decrease in cohesion and adhesion strength (Table 6). The concentration of nanoparticles in the electrolyte of 4 g l-1 leads to significant agglomeration, which in turn leads to decrease in adhesive strength and mechanical properties of the coatings. The reason of such behavior could be related to formation of more brittle coating as compared to that formed in the electrolytes with lower TiN concentration. In Fig. 2j for the coating obtained in electrolyte containing 4 g l-1 TiN nanoparticles the crack at coating/substrate boundary was fixed.

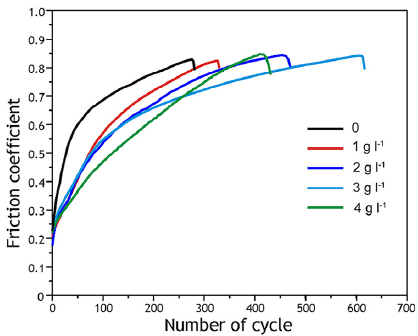
Fig. 10. Dependence of friction coefficient on number of cycles for PEO coating on Mg alloy MA8 in silicate-fluoride electrolyte without and with different concentrations of TiN nanoparticles.e


Table 7 Tribological properties of PEO coatings with different concentrations of TiN nanoparticles.
Concentration (g l-1) Wear
(mm3 N-1 m-1)
Number of cycles until coating abrasion
0 (1.1 ± 0.1) × 10-5 273 ± 21
1 (7.3 ± 0.6) × 10-6 319 ± 25
2 (5.8 ± 0.5) × 10-6 464 ± 34
3 (5.0 ± 0.4) × 10-6 605 ± 53
4 (6.5 ± 0.5) × 10-6 417 ± 32

Table 7 Tribological properties of PEO coatings with different concentrations of TiN nanoparticles.

Coatings morphology and elemental composition of samples were analysed by SEM and EDS methods, respectively, before and after the tribological test. According to the obtained results, the changes of the chemical composition in the wear zone were not identified. XRD studies did not provide additional information as well.

4. Conclusion

PEO coatings containing titanium nanoparticles had better mechanical characteristics in comparison to the surface layers produced without nanoparticles. It was established that titanium nitride is contained in the coating proportionally to its content in the electrolyte used in the PEO process. TiN nanoparticles are homogeneously distributed over the coatings and fill their pores. It was demonstrated that the best microhardness and wearproof are associated with the coatings formed in the electrolyte with a TiN concentration about 2-3 g l-1. In comparison with the PEO coating formed in the base electrolyte, microhardenss of the coating with nanoparticles increases almost twofold, while its wear resistance decreases. Incorporation of titanium nitride into PEO coatings results in a decrease in their polarization resistance proportionally to the particles content, which is attributed to the high conductivity of titanium nitride particles. At the same time, the coating containing conducting nanoparticles realizes protective functions through the decrease in corrosion current and the increase in polarization resistance (almost two orders of magnitude), in comparison with the Mg alloy without coating.

Acknowledgements:The work was financially supported by the Russian Science Foundation (Project No. 14-33-00009) and the Russian Federation Government (Federal Agency of Scientific Organizations).

The authors have declared that no competing interests exist.

References

[18] H. Luo, Q. Cai, B.Wei, B. Yu, J. He, D. Li, J. Alloys Compd. 474(2009) 551-556.
[Cited within:]
[19] L.Wang,W. Fu, S.Wang, J. Li, J. Alloys Compd. 594(2014) 27-31.
[Cited within:]
[20] Y.G. Ko, E.S. Lee, D.H. Shin, J. Alloys Compd. 586(2014) S357-S361.
[Cited within:]
[21] S.V. Gnedenkov, O.A. Khrisanfova, A.G. Zavidnaya, S.L. Sinebryukhov, V.S.Egorkin
[Cited within:3]
M.V. Nistratova, Surf. Coat. Technol. 204(2010) 2316-2322.
[22] S.Y. Chang, Y.L. Kim, J. Mater.Sci.Technol. 24(2008) 37-40.
[Cited within:]
[23] Y. Yang, H.Wu, J. Mater.Sci.Technol. 26(2010) 865-871.
[Cited within:]
[24] Y. Wang, X. Wang, T. Zhang, K. Wu, F. Wang, J. Mater.Sci.Technol. 29(2013)1129-1133.
[Cited within:]
[25] S.V. Gnedenkov, S.L. Sinebryukhov, Russ. J. Electrochem. 41(2005) 858-865.
[Cited within:1]
[1] H. Westengen, Oxford, 2001, pp. 4746-4753.
[Cited within:1]
[2] M.P. Staiger, A.M. Pietak, J. Huadmai, G. Dias, Biomaterials 27 (2006) 1728-1734.
[Cited within:]
[3] C. Blawert, N. Hort, K.U. Kainer, Trans. Indian Inst.Met. 57(2004) 397-408.
[Cited within:]
[4] G. Song, Adv. Eng. Mater. 7(2005) 563-586.
[Cited within:1]
[5] M.K. Kulekci, Int. J. Adv. Manuf. Technol. 39(2008) 851-865.
[Cited within:1]
[6] H. Friedrich, S. Schumann, J. Mater. Process.Technol. 117(2001) 276-281.
[Cited within:1]
[7] J. Tang, K. Azumi, Electrochim. Acta 56 (2011) 8776-8782.
[Cited within:1]
[26] S.V. Gnedenkov, S.L. Sinebryukhov, D.V. Mashtalyar, I.M. Imshinetsky, A.S. Gnedenkov, A.V. Samokhin, Y.V. Tsevtkov, Vacuum 120 (2015) 107-114.
[Cited within:1]
[27] V. Shoaei-Rad, M.R. Bayati, H.R. Zargar, J. Javadpour, F. Golestani-Fard, Mater.Res. Bull. 47(2012) 1494-1499.
[Cited within:]
[28] W. Zhu, Z. Zhang, B. Gu, J. Sun, L. Zhu, J. Mater.Sci.Technol. 29(2013) 237-244.
[Cited within:]
[29] S.V. Gnedenkov, S.L. Sinebryukhov, D.V. Mashtalyar, I.M. Imshinetskiy, Surf. Coat.Technol. 283(2015) 347-352.
[Cited within:1]
[30] I.M. Imshinetskiy, S.V. Gnedenkov, S.L. Sinebryukhov, D.V. Mashtalyar, A.V.Samokhin, Y.V. Tsvetkov, Solid State Phenom. 213(2014) 125-130.
[Cited within:1]
[31] K.M. Lee, Y.G. Ko, D.H. Shin, Curr. Appl. Phys. 11(2011) S55-S59.
[Cited within:]
[32] R. Arrabal, E. Matykina, P. Skeldon, G.E. Thompson, J. Mater. Sci. 43(2008)1532-1538.
[Cited within:]
[8] C.A. Huang, T.H.Wang, T.Weirich, V. Neubert, Corros. Sci. 50(2008) 1385-1390.
[Cited within:1]
[9] J.E. Gray, B. Luan, J. Alloys Compd. 336(2002) 88-113.
[Cited within:1]
[10] R. Arrabal, E. Matykina, F. Viejo, P. Skeldon, G.E. Thompson, Corros. Sci. 50(2008)1744-1752.
[Cited within:]
[11] P. Bala Srinivasan, J. Liang, R.G. Balajeee, C. Blawert,M. Störmer,W. Dietzel, Appl.Surf. Sci. 256(2010) 3928-3935.
[Cited within:]
[12] H. Duan, C. Yan, F.Wang, Electrochim. Acta 52 (2007) 3785-3793.
[Cited within:1]
[13] A. Nemcova, P. Skeldon, G.E. Thompson, S. Morse, J. Cizek, B. Pacal, Corros. Sci.82(2014) 58-66.
[Cited within:1]
[14] A.S. Gnedenkov, S.L. Sinebryukhov, D.V. Mashtalyar, S.V. Gnedenkov, Corros. Sci. 102(2016) 269-278.
[Cited within:1]
[33] S.V. Gnedenkov, S.L. Sinebryukhov, D.V. Mashtalyar, V.S. Egorkin, M.V. Sidorova,A.S. Gnedenkov, Corros. Sci. 85(2014) 52-59.
[Cited within:]
[34] M. Daroonparvar, M.A.M.Yajid, N.M. Yusof, H.R.Bakhsheshi-Rad, J. Alloys Compd.688(2016) 841-857.
[Cited within:]
[35] Y. Yang, Y. Liu, J. Mater.Sci.Technol. 26(2010) 1016-1020.
[Cited within:]
[36] S.V. Gnedenkov, V.S. Egorkin, S.L. Sinebryukhov, I.E. Vyaliy, A.S. Pashinin,A.M. Emelyanenko, L.B. Boinovich, Surf. Coat. Technol. 232(2013) 240-246.
[Cited within:1]
[37] Y.Wang, D.Wei, J. Yu, S. Di, J. Mater.Sci.Technol. 30(2014) 984-990.
[Cited within:1]
[38] T.S. Lim, H.S. Ryu, S.H. Hong, Corros. Sci. 62(2012) 104-111.
[Cited within:1]
[39] B.S. Necula, L.E.Fratila-Apachitei,A. Berkani, I. Apachitei, J. Duszczyk, J. Mater.Sci. Mater.Med. 20(2008) 339-345.
[Cited within:1]
[40] D. Sreekanth, N. Rameshbabu, Mater. Lett. 68(2012) 439-442.
[Cited within:1]
[41] J.C.Avelar-Batista Wilson,S.Wu, I. Gotman, J. Housden, E.Y. Gutmanas, Mater.Lett. 157(2015) 45-49.
[Cited within:1]
[42] J. Ma, D.Q. Yan, J.W. Hu, X. Zhang, Y. Li, Trans. Nonferrous Met. Soc. China (Eng.Ed.) 23(2013) 1011-1018.
[Cited within:]
[43] X. Li, Q. Cai, B. Zhao, Y. Xiao, B. Li, J. Alloys Compd. 675(2016) 201-210.
[Cited within:]
[44] F. Zhang, M. Yan, J. Mater.Sci.Technol. 30(2014) 1278-1283.
[Cited within:1]
[45] S.V. Gnedenkov, S.L. Sinebryukhov, D.V. Mashtalyar, I.M. Imshinetskiy, A.V.Samokhin, Y.V. Tsvetkov, J. Nanomater. 2015 (2015) 1-12.
[Cited within:1]
[46] H.O. Pierson,New Jersey, 1996, p.187.
[Cited within:1]
[15] R. Arrabal, E. Matykina, T. Hashimoto, P. Skeldon, G.E. Thompson, Surf. Coat. Technol. 203(2009) 2207-2220.
[Cited within:1]
[16] T.Wei, F. Yan, J. Tian, J. Alloys Compd. 389(2005) 169-176.
[Cited within:1]
[17] C.S. Dunleavy, J.A. Curran, T.W. Clyne, Appl. Surf. Sci. 268(2013) 397-409.
[Cited within:1]
[47] A.S. Gnedenkov, S.L. Sinebryukhov, D.V. Mashtalyar, S.V. Gnedenkov, Corros.Sci. 102(2016) 348-354.
[Cited within:1]
[48] E. Barsoukov, J.R. Macdonald, New Jersey, 2005, p.37.
[Cited within:1]
Downloaded    
RichHTML Viewed    
Abstract Viewed    

Share
Export

Related articles:
Key words
Magnesium alloys
Protective coatings
Plasma electrolytic oxidation
Corrosion
titanium nitride
Nanoparticles

Authors
D.V. Mashtalyar
S.V. Gnedenkov
S.L. Sinebryukhov
I.M. Imshinetskiy
A.V. Puz’