
 , Zhenghua Fan
Gear-shape CeO2 microstructures have been synthesized via a facile hydrothermal method with Ce(NO3)3⋅6H2O as the cerium source, NH4HCO3 as both the precipitator and the carbon source, and cetyltrimethyl ammonium bromide (CTAB) as the surfactant. X-ray diffraction (XRD) inferred that the synthesized CeO2 microstructures exhibited a fluorite structure. The band gap (
Shape-selective synthesis of inorganic nanomaterials is of scientific and technological importance due to their unique shape-dependent material properties and promising applications in catalysis, optics, microelectronics, and magnetic devices[1,2,3,4,5]. So far, a number of precipitants including sodium hydroxide, ammonium hydroxide, hydrazine hydrate, urea, and ammonium hydrogen carbonate have been used to synthesis such shape-controlled nanomaterials. For example, Mai et al.[6] reported that single-crystalline nanopolyhedra, nanorods, and nanocubes of CeO2 were selectively prepared by a hydrothermal method using sodium hydroxide as precipitants. Wei et al.[7] reported that urchin-like CeO2 hierarchical structures were prepared using ammonia solution as precipitant, while coral-like CeO2 hierarchical structures were prepared using ammonium hydrogen carbonate as precipitant. Lu et al.[8] reported that CeO2 nanoparticles were synthesized by a novel hydrothermal synthesis process using hydrazine hydrate as mineralizer. Wu et al.[9] reported that fractal dendrites have been successfully obtained via trisodium phosphate, ammonium hydroxide, and urea as precipitant. Meng et al.[10] reported that monocrystalline CeO2 tablet-like nanostructures and triangular prism-like nanotubes were synthesized by a simple template-free hydrothermal method using urea as precipitant. It still remains a significant challenge to synthesize CeO2 crystallites using novel precipitants. Ammonium hydrogen carbonate could be hydrolyzed to produce ammonium and bicarbonate ions, but its involvement as a precipitant in preparing nanomaterials was seldom reported.
Ceria (CeO2), an important rare earth compound, has been widely used in various fields due to its oxygen storage capacity[11,12], catalytic[1,13], optical[14,15], and magnetic properties[5,16]. CeO2 nanomaterials have exhibited unique physical and chemical properties which are significantly different from their bulk counterparts. Therefore, nano-CeO2 materials have attracted much attention recently. Various synthetic methods including microemulsion[17,18], Sol-gel[19,20], sonochemical[21,22], electrochemical[23,24], solvothermal[7,25], and hydrothermal synthesis[9,16] have been applied to synthesizes CeO2 nanostructures. Among all these synthetic methods, the hydrothermal approach has shown its extraordinary ability in structural control of CeO2 nanostructures. It has produced various morphologies of CeO2. Lu et al.[26] obtained nanopolyhedra and square-like CeO2 using Ce(NO3)3⋅6H2O as cerium resource and N2H4⋅H2O as mineralizer. Meng et al.[27] synthesized CeO2 nanopoles using CeCl3⋅7H2O as cerium resource, NaOH as mineralizer, and ethylenediamine as complexant. Zhou et al.[28] obtained nanotubes using Ce2(SO4)3⋅9H2O as cerium resource, NaOH as mineralizer. Li et al.[29] synthesized CeO2 nanosheets using Ce(NO3)3⋅6H2O as cerium resource, urea as both precipitator and carbon source. Sun et al.[30] synthesized flower-like CeO2 microspheres using Ce(NO3)3⋅6H2O as cerium resource and NH3⋅H2O as mineralizer. A hydrothermal process is simple, cost-effective, and environmentally friendly. It has become an important method for preparation of CeO2 nanostructures.
In this paper[31], we report a morphology-selective synthesis method of gear-like CeO2 microstructures and their magnetic properties. Here, we further report on hydrothermal growth mechanism of gear-shape CeO2 microstructures and their room temperature ferromagnetism. The structure and properties were characterized by various techniques, including X-ray diffraction (XRD), scanning electron microscopy (SEM), UV-vis absorption spectroscopy, Raman spectra, and vibrating sample magnetometer (VSM). Interestingly, the saturation magnetization (
The growth of sample was performed dissolving 4 mmol cetyltrimethyl ammonium bromide and 40 mmol NH4HCO3 in 20 mL distilled water under vigorous stirring, followed by respectively dissolving 2 mmol, 4 mmol, 6 mmol, 8 mmol Ce(NO3)3⋅6H2O in 20 mL distilled water under vigorous stirring. And then, 20 mL Ce(NO3)3⋅6H2O aqueous solution with different concentrations was put to 20 mL cetyltrimethyl ammonium bromide and NH4HCO3 aqueous solution under continuous stirring. And then obtained solution was put into a 50 mL Teflon-lined autoclave and heated for 12 h at 180 °C. After being cooled to room temperature, the precipitate was collected with centrifugation, washed for three times using distilled water and ethanol, followed by drying in air for 10 h at 80 °C. CeO2 was prepared by calcinating for 5 h at 400 °C.
The X-ray diffractometer (XD-3) with Cu
Fig. 1 shows the XRD patterns of the as-synthesized products. It can be seen that they are the mixtures of hexagonal Ce(CO3)(OH) (JCPDS Card No. 52-0352) and face centered cubic CeO2 (JCPDS Card No. 34-0394) with the hexagonal Ce(CO3)(OH) as the dominant phase. The sharp diffraction peaks of hexagonal Ce(CO3)(OH) in the XRD patterns demonstrate that the as-synthesized Ce(CO3)(OH) have a good crystallinity.
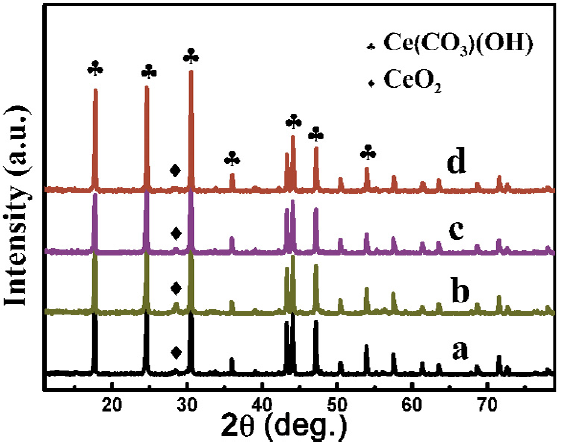
Fig. 1. XRD patterns of the as-synthesized samples prepared with different dosages of Ce(NO3)3⋅6H2O: (a) 2 mmol, (b) 4 mmol, (c) 6 mmol, (d) 8 mmol.
Fig. 2 shows the overall SEM images of the as-synthesized Ce(CO3)(OH) prepared with different dosages of Ce(NO3)3⋅6H2O. It can be seen that the size of Ce(CO3)(OH) particles decreases with the increase of Ce(NO3)3⋅6H2O from 2 to 8 mmol. The size distribution of the as-synthesized Ce(CO3)(OH) particles is uniform under all growth conditions. And the morphologies show little change as the concentration of Ce(NO3)3⋅6H2O increases.
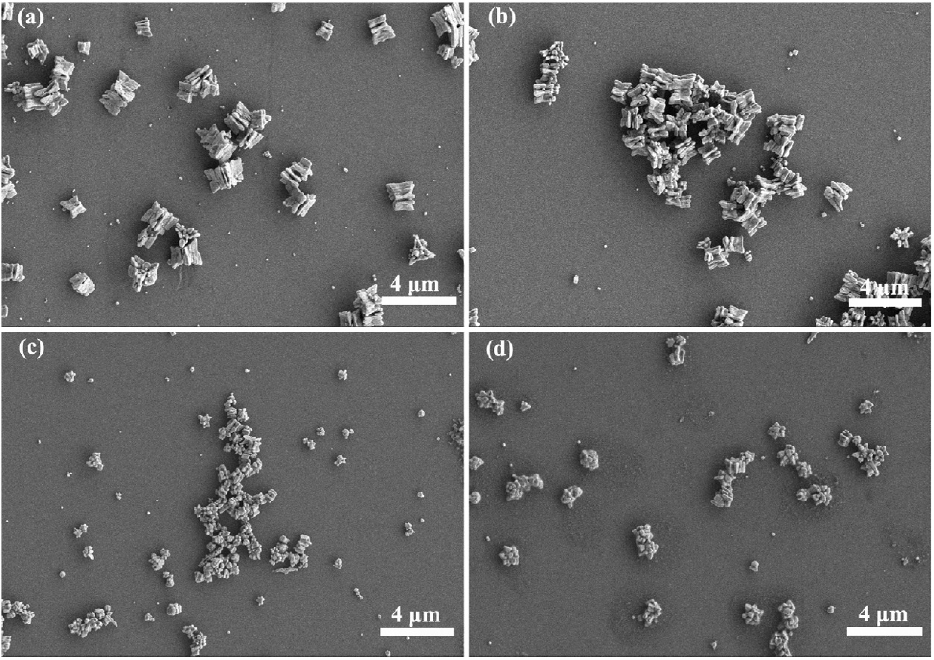
Fig. 2. Overall SEM images of as-synthesized Ce(CO3)(OH) prepared with different dosages of Ce(NO3)3⋅6H2O: (a) 2 mmol, (b) 4 mmol, (c) 6 mmol, (d) 8 mmol.
Fig. 3 shows the high-magnification SEM images of as-synthesized Ce(CO3)(OH) prepared with different dosages of Ce(NO3)3⋅6H2O. With increasing the dosages of Ce(NO3)3⋅6H2O, an obvious morphology change in Ce(CO3)(OH) from triangle gear to hexagon gear is observed. It indicates that Ce(NO3)3⋅6H2O plays an important role in controlling the morphology and size of the particles.
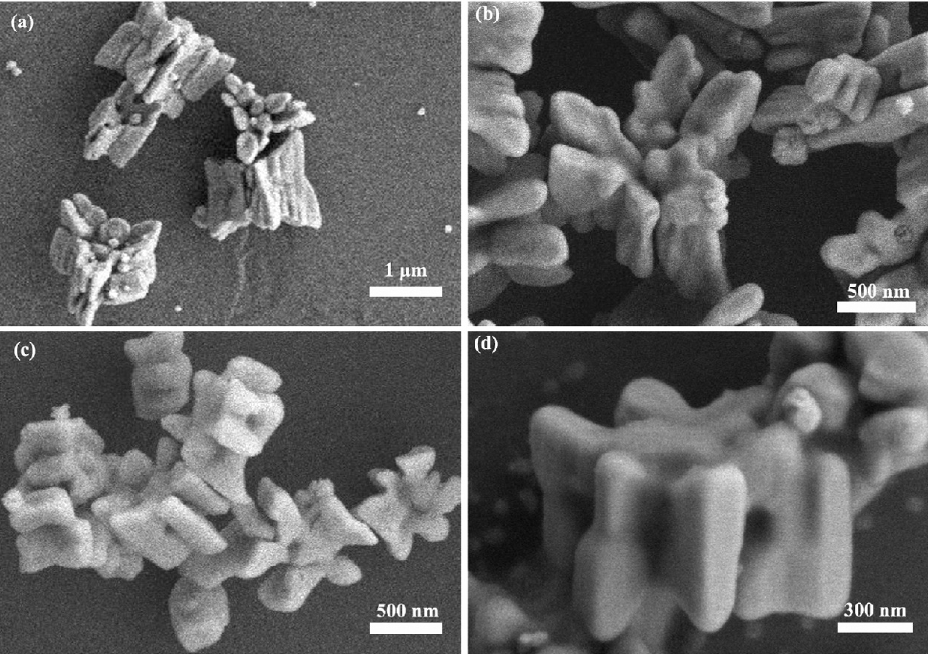
Fig. 3. High-magnification SEM images of as-synthesized Ce(CO3)(OH) prepared with different dosages of Ce(NO3)3⋅6H2O: (a) 2 mmol, (b) 4 mmol, (c) 6 mmol, (d) 8 mmol.
The thermal stability of the as-synthesized sample prepared with 4 mmol Ce(NO3)3⋅6H2O was investigated by thermogravimetric/differential thermal analysis (TG/DTA) analysis as shown in
4Ce(CO3)(OH)+O2→4CeO2+4CO2+2H2 (1)
Fig. 4. TG/DTA curves of as-synthesized gear-shape sample prepared with Ce(NO3)3⋅6H2O of 4 mmol.
The DTA curve (curve b) shows that an endothermic peak is observed to have maxima at about 313 °C. This sharp and strong endothermic peak confirms the thermal decomposition of Ce(CO3)(OH), which is well corresponding to that of the rapid weight loss in the TG curve. This conclusion is corroborated by XRD studies which show the appearance of Ce(CO3)(OH). It suggests that an endothermic reaction involving the thermal decomposition of Ce(CO3)(OH) to CeO2 occurs by the post-heat-process. Based on the TG-DTA curves, it is reasonable that the calcination temperature for Ce(CO3)(OH) precursors was chosen at 400 °C.
Fig. 5 shows the XRD patterns for those annealed gear-shape samples. All diffraction peaks in these patterns can be perfectly indexed to the face-centered cubic structure with space group

Fig. 5. XRD patterns of annealing gear-shape samples prepared with different dosages of Ce(NO3)3⋅6H2O: (a) 2 mmol, (b) 4 mmol, (c) 6 mmol, (d) 8 mmol.
Fig. 6 shows SEM images of the annealed gear-shape samples. The post-heat-treatment process does not ruin the morphology of the products, and the CeO2 microstructures almost keep the same morphology as its counterpart.
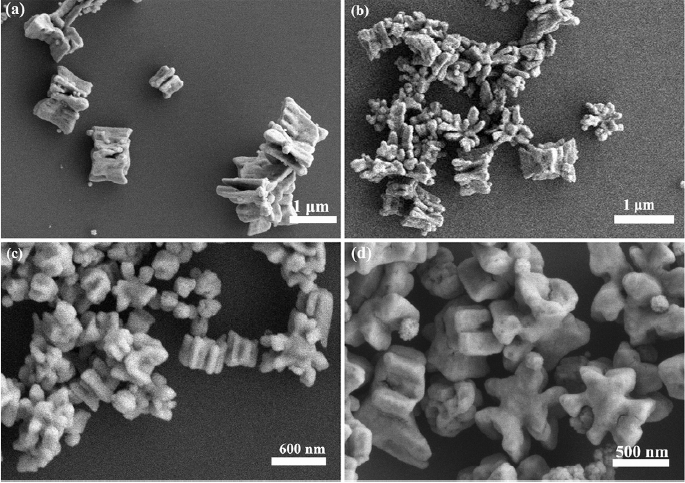
Fig. 6. SEM images of annealing gear-shape samples prepared with different dosages of Ce(NO3)3⋅6H2O: (a) 2 mmol, (b) 4 mmol, (c) 6 mmol, (d) 8 mmol.
Fig. 7 schematically illustrates the morphology-selective formation mechanism of Ce(CO3)(OH) gear-shape microstructures. At the very beginning, ammonium hydrogen carbonate (NH4HCO3) provides ammonium (NH+4), hydroxyl (OH-OH-), and carbonate anions (CO2-3), and the Ce(CO3)(OH) nanocrystals with irregular shapes are formed. The main reactions in the system can be expressed as follows (reactions (2)-(5)):
NH4HCO3+H2O→NH3⋅H2O+H2CO3 (2)
NH3⋅H2O⇌NH+4+OH- (3)
H2CO3⇌2H++CO2-3 (4)
Ce3++OH-+CO2-3→Ce(CO3)(OH) (5)
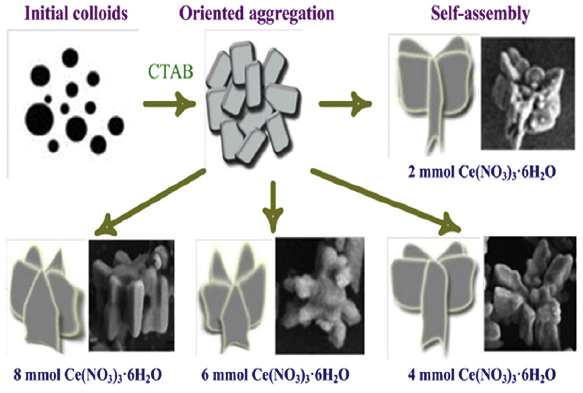
Fig. 7. Schematic illustration of the formation process of Ce(CO3)(OH) microstructures with different morphologies.
While the reaction is carried out without the aid of any surfactant, the as-synthesized particles tend to share common faces in order to maximize the packing density[35]. In the presence of CTAB, CTAB molecules would be selectively adsorbed on certain facets, resulting in the changes of the growth rate of different crystal faces and the formation of nanosheets. In addition, as mentioned above, increasing dosages of Ce(NO3)3⋅6H2O could increase the rate of nucleation of Ce(CO3)(OH). At the same time, the concentration of nanosheets would increase and the size would decrease. So the different morphologies are formed just like being assembled under the function of CTAB micelles. And CeO2 microstructures are produced by thermal decomposition of Ce(CO3)(OH) as reaction (1).
To investigate oxidation state of Ce in the obtained CeO2 microstructures, XPS analyses were carried out.
$$[Ce^{3+}]=\frac{A_u^{’}+A_v^{’}}{A_u^{’’’}+ A_u^{’’}+ A_u^{’}+ A_u+ A_v^{’’’}+ A_v^{’’}+ A_v^{’}+A_v} \ \ (6)$$
$$[Ce^{4+}]=\frac{ A_u^{’’’}+ A_u^{’’}+ A_u^{’}+ A_v^{’’’}+ A_v^{’’}+ +A_v }{A_u^{’’’}+ A_u^{’’}+ A_u^{’}+ A_u+ A_v^{’’’}+ A_v^{’’}+ A_v^{’}+A_v} \ \ (7)$$
where
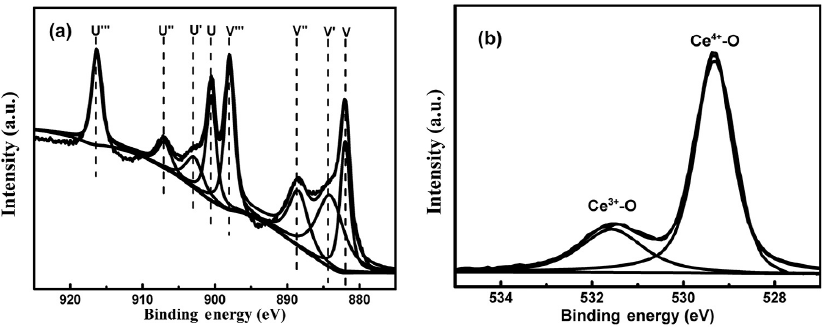
Fig. 8.
XPS of Ce3
Table 1 shows the integrated area of Ce3
$$x=\frac{[o]}{[Ce]}=\frac{3}{2}\times[Ce^{3+}]+2\times[Ce^{4+}] \ \ (8) $$
Table 1.
Integrated areas of individual XPS peaks of the Ce 3
$$x^{’}=\frac{O_{lS}}{Ce_{sd}}=\frac{A_o}{A_{Ce}}\times \times \frac{S_{Ce}}{S_o}\ \ (9)$$
where
Table 2 shows the stoichiometry variations with the concentration of Ce3+ (requiring O to fully oxidize Ce3+ and Ce4+ and direct comparison of the O 1
Table 2. Concentrations of Ce3+ and Ce4+ ions and stoichiometry
The Ce3+ ions and oxygen vacancies exist in CeO2 sample as proven by XPS, while XRD identified only CeO2 phase. Therefore, the Ce2O3 phase is likely amorphous and cannot be seen in XRD. The amorphous character of Ce2O3 is an indication that this phase is located at the grain surface and at the grain boundaries[5,40].
Raman spectroscopy is a very important characterization tool to investigate the change in the local structure. In order to better understand the gear-shape CeO2 structure, Raman scattering of the samples prepared under different conditions was carried out and is shown in

Fig. 9. Room temperature Raman spectra of gear-shape CeO2 samples prepared with different dosages of Ce(NO3)3⋅6H2O: (a) 2 mmol, (b) 4 mmol, (c) 6 mmol, (d) 8 mmol.
As shown in
The second-order features at 1170 cm-1 are very prominent for all samples, which can be attributed to the second-order Raman mode of surface superoxide species (O-2), and has little additional contributions from F2
The UV-vis absorption spectra of the CeO2 samples are shown in
αhν=ED (hν-Eg)1/2
where
Fig. 11 shows magnetic hysteresis loops of CeO2 samples prepared with different dosages of Ce(NO3)3⋅6H2O at room temperature. The curve exhibits very nice magnetic hysteresis with a lower coercivity, but the curve behaves like paramagnetic at higher field. Room temperature ferromagetism (RTFM) has been observed for the gear-shape CeO2 samples.
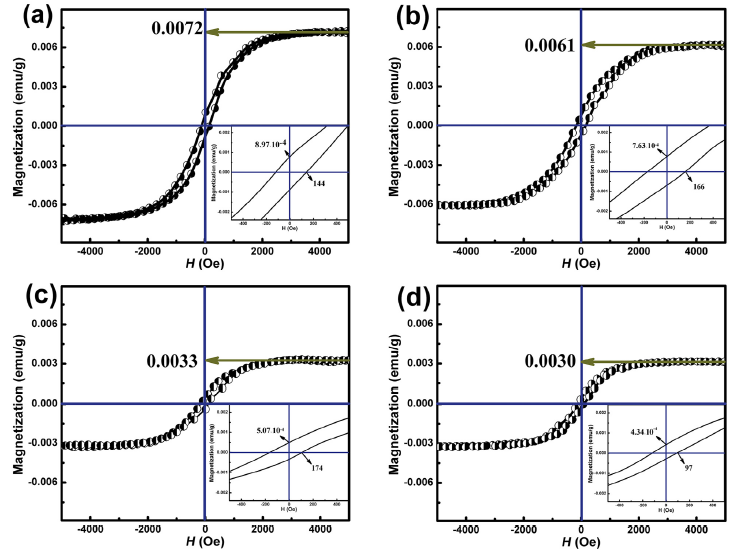
Fig. 11. Magnetic hysteresis loops of CeO2 samples prepared with different dosages of Ce(NO3)3⋅6H2O: (a) 2 mmol, (b) 4 mmol, (c) 6 mmol, (d) 8 mmol.
Table 3. Parameters of
In summary, the gear-shape CeO2 microstructures were synthesized via a facile hydrothermal method. The dosages of Ce(NO3)3⋅6H2O play a key role in the morphology of the as-prepared Ce(CO3)(OH) and therefore the properties of the final product CeO2. The XRD indicated that the synthesized CeO2 samples have a fluorite structure. The
The authors have declared that no competing interests exist.

| Related articles: |
