Search for articles:
Copyright: 2017 Editorial board of Acta Metallurgica Sinica(English Letters) Copyright reserved, Editorial board of Acta Metallurgica Sinica(English Letters)
More
Abstract
In this study, high- and low-grade grain-oriented electrical steels were used as the initial materials to produce 0.08-mm-thick sheet with one-step cold-rolling method. Electron backscattering diffraction analysis technique and X-ray diffraction texture analysis technique were adopted to investigate the effect of initial Goss texture sharpness on texture evolution and magnetic properties of ultra-thin grain-oriented electrical steel. The results showed that primary recrystallization and secondary recrystallization were the main processes that occurred during annealing. The induced factors for secondary recrystallization of two grades samples were not consistent. The high-grade samples presented texture induction mechanism, while the low-grade samples revealed strong surface-energy induction mechanism. The initial Goss texture sharpness had a great impact on texture evolution and magnetic properties of ultra-thin grain-oriented electrical steel. The Goss texture component formed after primary recrystallization was stronger, and better magnetic properties were obtained at low frequencies. For low-grade samples, secondary recrystallization enhanced the intensity of Goss texture, and both grain size and texture contributed to better high-frequency magnetic properties after secondary recrystallization. By controlling the annealing process, the magnetic properties of low-grade products could be significantly improved, thus achieving conversion from low-grade to high-grade products.
Keywords:
As one of the most important materials in military and electronic industries, ultra-thin grain-oriented electrical steel sheets (0.08-0.15 mm) are mainly used for electrical devices, such as high-frequency transformer, impulse transformer, impulse generator, and large-power magnetic amplifier with a working frequency higher than 400 Hz [1]. Iron loss is closely related to the sheet thickness. Within a certain thickness range, the eddy current loss decreases [2], as the steel thickness reduces. For this reason, the development and manufacturing of ultra-thin grain-oriented electrical steel have become a major trend in the field of grain-oriented electrical steel production in twenty-first century [3, 4].
Ishiyama et al. [5] produced ultra-thin grain-oriented electrical steel with excellent soft magnetic properties in vacuum furnace by controlling surface energy. Since then, research and production of ultra-thin grain-oriented electrical steel have attracted wide interests from scholars [6, 7]. Lobanov et al. [8] investigated the effect of Goss orientation on magnetic properties of ultra-thin grain-oriented electrical steel by primary recrystallization method. According to their study, grain-oriented electrical steel with larger Goss deviation could store higher energy after cold rolling, consequently forming sharper Goss texture after primary recrystallization annealing. However, their view is different from the experimental results of this paper, and the structure and texture evolution in secondary recrystallization are not clear.
From the perspective of developing new magnetic materials with low iron loss, thin strips exhibit super soft magnetic properties [9, 10]. In addition, the magnetic properties of some industrial products are unstable due to improper rolling process and annealing system. Therefore, conversion from low-grade products to high-grade ones through process-controlled magnetic properties optimization provides critical cost-effectiveness required for industrial production. From this sense, it is highly necessary and important to investigate the effect of initial Goss texture sharpness on magnetic properties of ultra-thin grain-oriented electrical steel.
In this work, both high-grade and low-grade grain-oriented electrical steels were selected as the initial materials to produce ultra-thin grain-oriented electrical steel with one-step cold-rolling and recrystallization annealing process. The effect of initial Goss texture sharpness on texture evolution and magnetic properties of ultra-thin grain-oriented electrical steel during annealing was studied to provide theoretical basis for production of ultra-thin grain-oriented electrical steel.
0.27-mm-thick high-grade (H) and low-grade (L) grain-oriented electrical steels were selected as the initial materials. The original magnetic properties of H sample are B8 = 1.917 T and P1.5/50 = 1.032 W/kg, while those for L sample are B8 = 1.831 T and P1.5/50 = 1.387 W/kg. The samples received pickling in 10% dilute hydrochloric acid to remove glass film and insulating film, and then were rolled to 0.08 mm by a four-roller mill with 70% cold-rolling reduction. The chemical compositions of both samples are shown in Table 1. The cold-rolled samples were subjected to recrystallization annealing at temperature of 700, 800, 900, 1000, and 1100 °C, respectively, followed by 5-min temperature maintenance at each temperature and held at 1200 °C for 2 h.
Table 1 The chemical compositions of the samples (wt%)
| Sample | C | Si | Mn | S | N |
|---|---|---|---|---|---|
| H | 0.005 | 2.99 | <0.001 | 0.001 | 0.001 |
| L | 0.006 | 2.99 | <0.001 | 0.001 | 0.002 |
The magnetic flux densities at 800 (B8) A/m along the rolling direction (RD) and typical iron losses including P1.0/50, P1.0/400 and P1.0/1000 (P1.0/50 is determined at a magnetic flux density of 1.0 T and 50 Hz; the rest of the P values can be deduced by analogy) along the rolling direction (RD) were measured by an electrical steel tester (MPG 200D). The micro-textures were measured and analyzed by using a Zeiss ULTRA55 scanning electron microscope equipped with an Oxford Instruments HKL-Channel 5 EBSD system with the measured area of 1 mm (RD) × 1 mm (TD). Macro-textures were measured by using a D5000 X-ray diffractometer, and the measured area is 24 mm (RD) × 14 mm (TD).
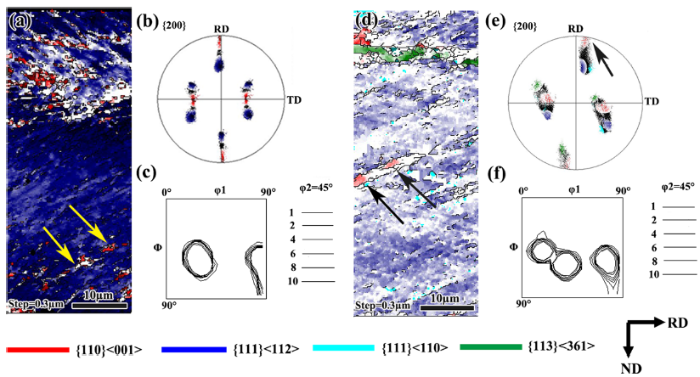
The electron backscattering diffraction data of two samples after cold rolling are shown in Fig. 1. It can be seen that in spite of different initial Goss orientations, both of the two samples formed a rolling texture dominated by γ-fiber texture after 70% cold-rolled reduction. The H samples revealed {111} < 112 > rolling texture, while L samples exhibited rolling texture between {111} < 110 > and {111} < 112 > , as shown in Fig. 1(c) and (f). The {111} < 112 > texture is a typical result of Goss orientation rotating around TD axis, which is the same as Goss single-crystal deformation behaviors [11, 12]. For low-grade samples, as the magnetic properties (B8 = 1.831 T, P1.5/50 = 1.387 W/kg) are not well, there is a small proportion of original grains deviated from ideal Goss orientation [13, 14]. The cold-rolled textures were laying between {111} < 110 > and {110} < 112 > . Appearance of {111} < 110 > texture is related to initial deviated Goss orientation from {110} axis. A transitional orientation {113} < 361 > also appeared, marked with green grains in Fig. 1(d). Such an orientation is related to shearing behaviors of the cold-rolled surface of the thin strips [15]. Obviously, during deformation of thin sheets, the number of rolling passes is higher than the conventional rolling and the shear deformation of cold-rolled strip is more apparent [16, 17]. Therefore, the thin strips had a different compressive deformation process from traditional cold-rolling and featured strong surface shearing, which causes the strain state deviating from plane strain and changes the crystal rotation route. Our previous study has calculated the crystal rotation path during deformation under VPSC models [18]. It is believed that {110} < 229 > grains can rotate to near {113} <uvw> orientation under the surface shear, which is in coincidence with the appearance of {113} < 361 > component in this work. According to the deformation path of grains in Fig. 1(e), it is reasonable to conclude that {113} < 361 > grains result from initial deviated Goss grains with specific deformation behavior in cold-rolled surface, marked with black arrows in Fig. 1(d). For H samples, a number of Goss grain nuclei were presented inside the shear zone, marked with yellow arrows in Fig. 1(a). For L samples, in addition to the γ-fiber texture, a small number of deviated Goss grains remained in the center, marked with black arrows in Fig. 1(c). Obviously, after 70% cold rolling, not all the Goss grains or deviated Goss grains rotate to γ-fiber texture, and there are still a small amount of Goss grains or deviated Goss grains remained in the center zone.
Fig. 1 Orientation maps in lateral planes, {200} pole figures and ODF displayed at φ2 = 45° section: a Orientation maps of H sample; b {200} pole figures of H sample; c ODF of H sample; d Orientation maps of L sample; e {200} pole figures of L sample; f ODF of L sample
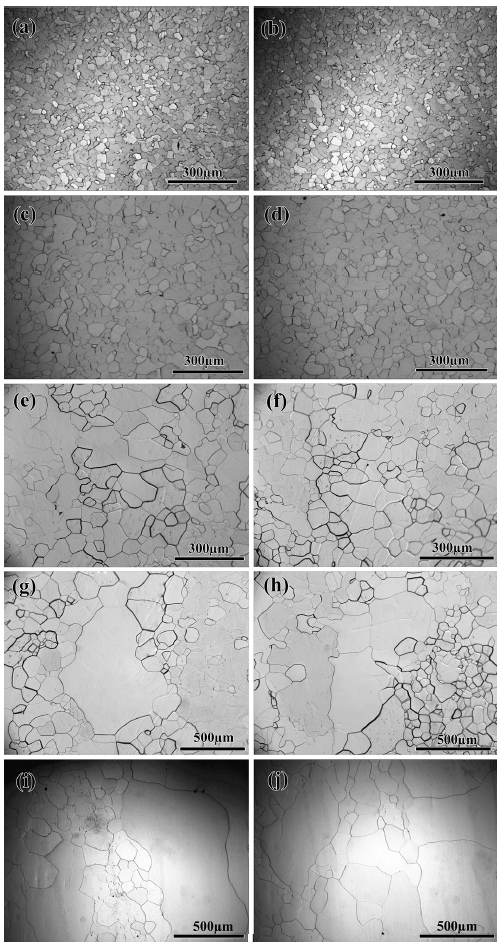
The evolution of microstructure of two samples during annealing is shown in Fig. 2. At 700 and 800 °C, both types of samples experienced complete recrystallization and formed tiny and uniform grains. The primary recrystallization was completed, as shown in Fig. 2(a) and (b). When the temperature increased to 900 °C, heterogeneous recrystallization structure began to appear. It can be seen from Fig. 2(e) and (f) that some grain boundaries are clear, and some other blurry boundaries correspond to small-angle grain boundaries, indicating that grains with certain orientations merged other grains. With the increase in annealing temperature, the uneven grains were held down, but the heterogeneous degree changed. At 1000 °C, the size of abnormal grains exceeded 500 µm, and 70-100-µm grains were distributed around them. Secondary recrystallization has already occurred at this point. As the annealing temperature continued to rise, grain sizes became even more heterogeneous. At 1100 °C, the abnormal grown grains gradually changed to elongated shapes. After annealing at 1200 °C for 2 h, it can be seen that both types of samples have homogenous grains, with an average size of 2 mm, as shown in Fig. 2(k-l).
Fig. 2 Microstructures evolution of two samples in rolling planes: a H-700 °C; c H- 800 °C; e H-900 °C; g H-1000 °C; i H-1100 °C; k H-1200 °C; b L-700 °C; d L-800 °C; f L-900 °C; h L-1000 °C; j L-1100 °C; l L-1200 °C
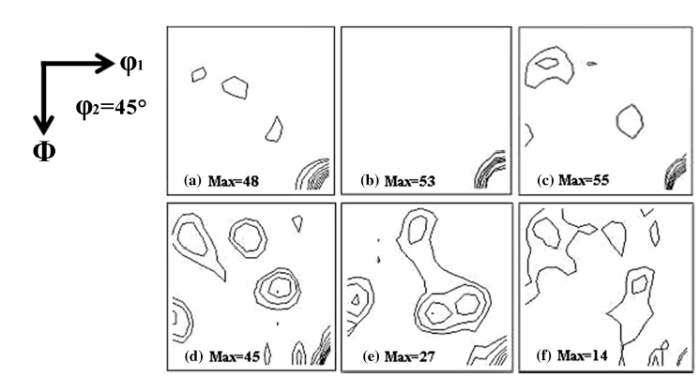
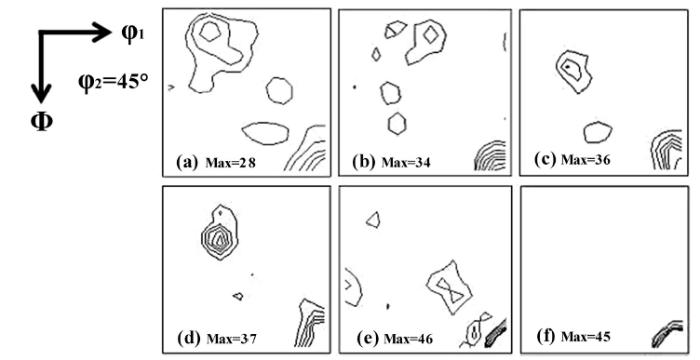
The variations of recrystallization texture of H and L samples during annealing are shown in Figs. 3 and 4. A general analysis of orientation distribution function on φ2 = 45° section shows that both types of samples formed a recrystallization structure dominated by Goss texture during annealing. The difference between the two samples lies in the way that Goss texture intensities change with annealing temperature. It can be seen from Fig. 3(a-f) that for H samples, with the increase in annealing temperature, the intensity of Goss texture firstly increased and then decreased. At 800 °C, the Goss grains exhibited a very strong growth advantage, which correspond to the sharpest of Goss texture. Based on Fig. 3(c) and (d), this stage is still generally considered as primary recrystallization. Upon further annealing (i.e., 1100-1200 °C), the texture experienced dispersion and the intensity of Goss texture dropped gradually, resulting in the change of texture types. Based on Fig. 3(g-j), secondary recrystallization occurred in this stage. Compared with Goss grains, {113} <uvw> and γ grains had significant growth advantages [19]. Therefore, at the annealing temperature of 1200 °C, the mixed component of {113} <uvw> , γ-fiber texture and Goss textures were formed. For L samples, the intensity of Goss texture gradually increased with the raise of temperature, while intensity of {113} <uvw> and γ-fiber texture gradually decreased, as shown in Fig. 4(a-f).
Fig. 3 Texture evolution of H sample at different annealing temperature: a 700 °C; b 800 °C; c 900 °C; d 1000 °C; e 1100 °C; f 1200 °C
Fig. 4 Texture evolution of L sample at different annealing temperature: a 700 °C; b 800 °C; c 900 °C; d 1000 °C; e 1100 °C; f 1200 °C
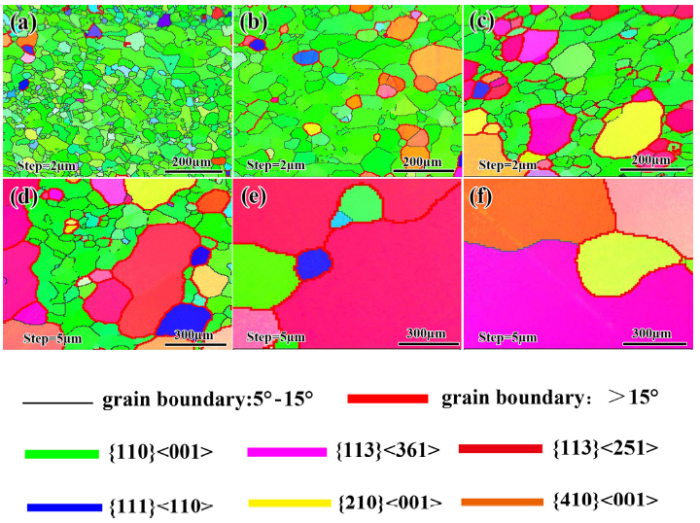
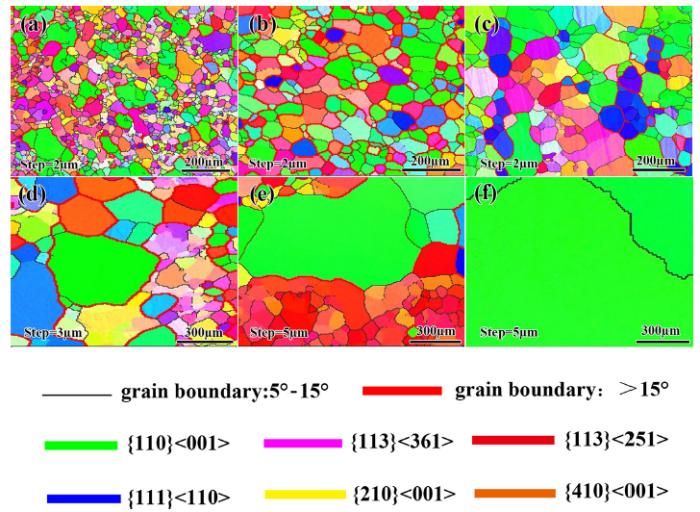
The micro-textures evolution of H and L samples are shown in Figs. 5 and 6, respectively. During recrystallization, the evolution of texture is similar to Goss single-crystal, and both poly-crystal grain boundaries and initial Goss texture sharpness play a crucial role in this process. At primary recrystallization stage (from 700 to 900 °C), H samples formed a recrystallization structure dominated by Goss texture, indicating the heredity of Goss texture [20]. In general, when grain-oriented electrical steel with a (110)[001] orientation is rolled and then annealed under appropriate conditions, grains with (110)[001] orientation can be obtained and the intensity of Goss texture after recrystallization annealing is related to the sharpness of initial Goss texture [21]. Therefore, at primary recrystallization stage, the intensity of Goss texture in H samples is higher than that in L samples. The small number of {111} < 112 > grains is originated from deformed γ-fiber grains. In low-grade samples, in addition to a certain amount of Goss grains, a number of {113} <uvw> grains are generated, marked with pink grains in Fig. 6(a). The original of {113} <uvw> grains has been discussed and analyzed above. {113} <uvw> as the transitional orientation existed in L samples. Upon annealing, the primary recrystallization texture is characterized by medium Goss and {113} <uvw> texture. The Goss texture is originated from “Goss nucleation” in deformed {111} < 112 > grains. The volume fraction of {113} <uvw> texture component and Goss texture component is 31 and 46%, respectively (15° misorientation angle), while the corresponding fractions are 11 and 82% for H samples. The intensity of Goss texture formed at primary recrystallization has a significant effect on secondary recrystallization. As annealing temperature increases, the grain size becomes larger, and the ability of grain growth is closely associated with the grain orientations. In H samples, the grain boundary characters are mainly small-angle grain boundaries (5°-15°) between in Goss grains and large-angle grain boundaries(>15°) between {113} < 361 > grains and Goss grains, as shown in Fig. 5(c and d). It is generally believed that the factors to inhibit normal growth and induce abnormal growth mainly include [22]: surface energy, inhibitors and grain boundary energy that induced by material textures. Because the inhibitor does not exist in this paper, the surface energy and grain boundary energy are the two factors to induce abnormal growth. The small-angle boundaries between Goss grains with only one type textures inhibit the abnormal growth of Goss grains, while the large-angle grain boundaries between {113} <uvw> grains and Goss grains promote the secondary recrystallization of {113} <uvw> island grains by absorbing Goss grains, leading to degradation of Goss texture formed at primary recrystallization, as shown in Fig. 5(d-f). For L samples, the intensity of their Goss texture was far lower than that of H samples; after primary recrystallization, the type of grain boundaries is given priority to large-angle grain boundaries, as shown in Fig. 6(a-c). The large-angle grain boundaries make {113} <uvw> grains difficult to grow up due to texture restriction. In the meanwhile, the grain size had exceeded sheet thickness, triggering significant surface effect [23]. Goss grains have stronger growth ability compared with other oriented grains, leading to the secondary recrystallization dominated by Goss texture.
Fig. 5 Micro-textures evolution of H sample during annealing: a 700 °C; b 800 °C; c 900 °C; d 1000 °C; e 1100 °C; f 1200 °C
Fig. 6 Micro-texture evolution of L sample during annealing: a 700 °C; b 800 °C; c 900 °C; d 1000 °C; e 1100 °C; f 1200 °C
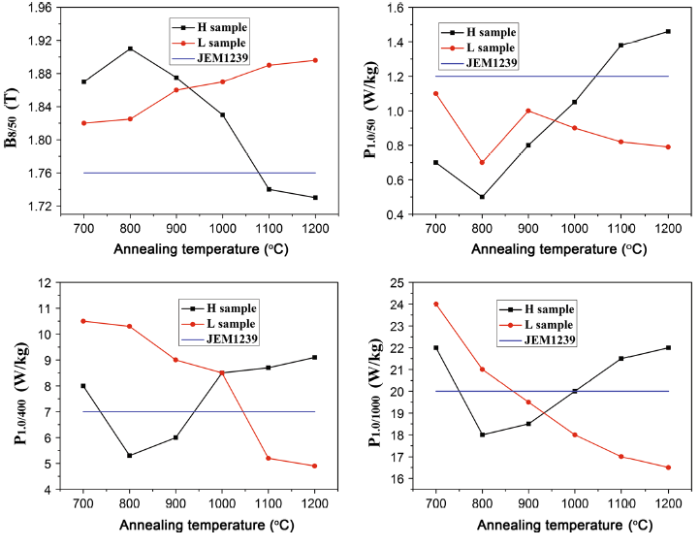
The magnetic properties of ultra-thin grain-oriented electrical steel at different frequencies are shown in Fig. 7. As the recrystallization textures were always dominated by Goss texture contributing to magnetic properties, the magnetic properties of most samples in both types met JEM1239 (GT100) standard. For H samples, with the increase in annealing temperature, the variation of magnetic properties is similar to the intensity of Goss texture. That is to say, the value of magnetic properties of H samples firstly increased and then decreased. At 800 °C, the Goss texture reached the highest intensity and other texture components, especially unfavorable {111} <uvw> textures, were very weak. Therefore, the samples exhibit an excellent magnetic property. B8/50 could reach up to 1.908 T and the iron losses at different frequencies are the lowest. Upon further annealing (i.e., 900-1200 °C), the intensity of Goss texture is rapidly decreased and magnetic properties are corresponding declined. The B8/50 value rapidly decreased and the P1.0/50, P1.0/400, P1.0/1000 are sharply rising. The magnetic properties at 1100 and 1200 °C were lower than those in JEM1239 (GT100) standard.
Fig. 7 The magnetic performance of two samples
For L samples, due to the enhanced of Goss texture after cold rolling and annealing, the magnetic properties are greatly improved. The magnetic induction gradually increased with annealing temperature. The intensity of Goss texture reached the maximum value at 1200 °C and B8/50 reached up to 1.901 T, far higher than the initial steel strips (1.831 T) and JEM1239 (GT100) standard (1.76 T). The variation of iron loss at 50 Hz firstly decreased and then increased. At 800 °C, the iron loss is the lowest, which shows the combined effects of Goss texture sharpness and grain size homogeneity. At medium and high frequencies, the variation of iron loss of L samples was not significantly different from those at low frequencies. Due to the increase in grain size and enhancement in Goss texture, the iron loss decreased steadily. It should be noted that compared to H samples, L samples had a lower iron loss at medium and high frequencies at 1100 and 1200 °C.
To further investigate the effect of grain size and texture on iron loss, iron loss could be decomposed by classical loss separation theory. It is well known that the total iron loss (Pt) mainly consists of hysteresis loss (Ph), classical eddy current loss (Pe), and anomalous loss (Pa). According to the theory presented by Bertotti [24], the total iron loss can be expressed by:
$P_{\text t} = P_{\text h} + P_{\text e} + P_{\text a} = k_{\text h} fB^{\alpha } + k_{\text e} f^{2} B^{2} + k_{\upalpha } f1.5B^{\beta }$,(1)
where f is the frequency, B is the magnetic flux density, and the values of kh, ke, kα, α, and β are assumed to be constants. When B = 1.0 T,
$P_{\text t} = P_{\text h} + P_{\text e} + P_{\text a} = k_{\text h} f + k_{\text e} f^{2} + k_{\upalpha } f^{1.5}$ (2)
Equation (2) is divided by the frequency to yield.
$P_{\text t} /f = k_{\text h} + k_{\text e} f + k_{\upalpha } f^{0.5}$.(3)
The coefficient of kh can be calculated by fitting the values of P1.0/50, P1.0/400, and P1.0/1000 to Eq. (3); the Ph for each sample is then obtained by Eq. (2). According to the classical expression of eddy current loss deduced from the Maxwell equation,
$P_{\text t} /f = k_{\text h} + k_{\text e} f + k_{\upalpha } f^{0.5}$ (4)
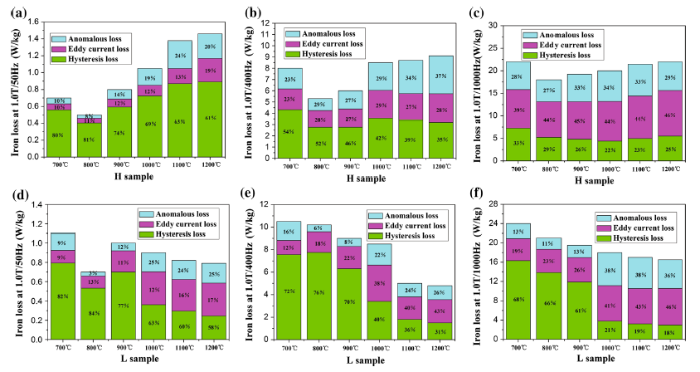
where t is the thickness of sheets, f is the frequency, Bm is the maximum flux density, ρ is the resistivity, γ is the density of the material, k is the waveform factor, and k = 1.11 for the sinusoidal waveform. Pe can be calculated by Eq. (4) and combined with Eq. (1) to obtain Pa. The results of loss separation at 50-1000 Hz and at a magnetic flux density of 1.0 T of H and L samples are shown in Fig. 8.
Fig. 8 Results of loss separation: a 50 Hz of H sample; b 400 Hz of H sample; c 1000 Hz of H sample; d 50 Hz of L sample; e 400 Hz of L sample; f 1000 Hz of L sample
These loss separation results indicate that the percentage of hysteresis loss display an overall decreasing trend as measured frequency increases, that is to say, at low frequency, hysteresis loss is the main component of the total loss, and the intensity of Goss texture is related to hysteresis loss, which indicates that the variation trend of hysteresis loss of H samples is similar to the intensity of Goss texture at low frequency. With the increase in annealing temperature, the average grain size increases and the proportion of hysteresis loss decreases. The anomalous loss displays an overall increasing trend as annealing temperature increases because of the increasing width of the magnetic domain resulting from the increasing grain size.
In summary, both of grains size and texture have significant effects on iron loss. But in comparison, the effect of texture on iron loss at low frequency is more significant, while the effect of grain size on high frequency core loss is complicated. On the one hand, the larger average grain size, the smaller grain boundaries area, coercive force and hysteresis loss. On the other hand, when the grain size increases, the magnetic domain becomes larger, leading to a higher eddy current loss. So there should be an appropriate critical size (dc). For grain-oriented electrical steel, on the premise of high orientation, the iron loss is the lowest when dc = 0.8-1.0 mm [25]. It should be noted that as the intensity of Goss texture varies too much in different annealing temperatures, the effect of texture on iron loss at high frequency cannot be ignored.
Industrial grain-oriented electrical steel products were used to prepare for ultra-thin grain-oriented electrical steel. Due to the fact that Goss texture, after cold rolling and annealing, mainly came from the original products, the intensity of Goss texture in high-grade samples was lower than that in initial samples. However, for low-grade samples, the inferior initial magnetic properties and Goss texture provide further room for optimizing magnetic properties by controlling rolling and annealing processes. This also creates possibilities for conversion from low-grade to high-grade products.
The effect of initial Goss texture sharpness on magnetic properties of ultra-thin grain-oriented electrical steel is due to the fact that Goss grains and deviated Goss grains have different deformation and recrystallization behaviors. Lobanov et al. [26] have investigated the effect of Goss orientation on magnetic properties of ultra-thin grain-oriented electrical steel by primary recrystallization method, indicating that at a fixed cold-rolling reduction, deformation stored energy would be dependent on initial grain orientation. According to his study, grain-oriented electrical steel with larger Goss deviation could store higher energy after cold rolling, consequently forming sharper Goss texture after primary recrystallization and providing better low-frequency magnetic properties. The test results in this paper are different from the above-mentioned findings. On the one hand, as Goss textures formed during primary recrystallization resulted from Goss grains in the initial strips, the high-grade grain-oriented electrical steel with high intensity of Goss texture generated sharper Goss textures after recrystallization annealing. On the other hand, low-grade samples with inferior initial Goss texture had a transitional {113} <uvw> orientation after cold rolling, which significantly impacted the intensity of Goss textures after primary recrystallization. In summary, after primary recrystallization, the high-grade samples exhibited better magnetic properties. However, as the annealing temperature rose, the grain size increased. Grain size and sharpness of Goss texture during primary recrystallization had a great impact on subsequent secondary recrystallization. For high-grade samples, after secondary recrystallization, the Goss texture formed during primary recrystallization almost vanished, and textures dominated by {111} < 112 > and {113} <uvw> were formed, leading to the magnetic properties severely degraded. For low-grade samples, during secondary recrystallization, Goss grains grew up abnormally by absorbing other grains with scattered orientation and finally formed a secondary recrystallized structure dominated by Goss texture, which significantly improved the magnetic properties of low-grade samples.
It is well known that ultra-thin grain-oriented electrical steel may experience primary, secondary, and tertiary recrystallization during annealing [27]. However, as tertiary recrystallization only occurred in very strictly controlled annealing conditions [28], this study failed to capture the completion of secondary recrystallization and abnormal growth of tertiary grain nuclei through consumption of secondary grains. It can be concluded from the variation of grains size and texture type that no tertiary recrystallization occurred during annealing in this study. Only primary and secondary recrystallization took place.
Gao et al. [29] have investigated the evolution of microstructure and texture in ultra-thin grain-oriented electrical steel prepared by cross-shear rolling methods during annealing. Primary and secondary recrystallization took place during annealing, which is similar to the results in this work. However, the texture components of secondary recrystallization are different, and the abnormal growth behaviors of H and L samples during secondary recrystallization are different. Due to the fact that cross-shear rolling in above-mentioned literature is beneficial to the nucleation of η-fiber grains (RD∥ < 001 >) [30], {210} < 001 > and {310} < 001 > are the main components during secondary recrystallization in their research, which is significantly different with {113} <uvw> component in this work. The origin of {113} < 361 > grains and their impact on secondary recrystallization have been investigated and analyzed in above. It is obvious that, for different samples, the effect of {113} <uvw> grains on secondary recrystallization is different. For high-grade samples, the small-angle boundaries between Goss grains with only one type texture prevent further growth of Goss grains. In contrast, {113} <uvw> grains formed in large-angle grain boundaries surrounding Goss grains. It is well known that during secondary recrystallization of traditional grain-oriented steel, island grains will be consumed by large surrounding Goss grains, resulting in secondary recrystallization texture dominated by Goss texture [31, 32]. In this test, however, in spite of the fact that all Goss grains have small-angle boundaries between them, these small Goss grains are not equivalent to a large Goss grain. The energy of grain boundaries between small Goss grains makes it difficult to consume {113} <uvw> island grains. On the contrary, the high energy grain boundaries enabled {113} <uvw> grains grow up abnormally by sweeping Goss grains, leading to degradation of Goss texture formed at primary recrystallization. For low-grade samples, as the intensity of Goss texture formed during primary recrystallization was not sharp as that of high-grade samples, no secondary recrystallization occurred due to texture restriction. As annealing temperature rose, the grain size exceeded the sheet thickness. In this case, the structure was actually a two-dimensional one, and almost all grains were exposed on the sample surface. At this point, surface energy would become one of the main driving forces. High-grade samples were impacted by high-angle grain boundaries and surface energy at the same time. However, as the scattered grains such as those in {113} <uvw> orientation had certain grain size advantage over Goss grains, these grains would grow up abnormally due to high-energy grain boundaries and grain size advantage. In low-grade samples, the grains in different orientations did not have obvious size advantage, and the surface energy played a more important role than grain boundary energy. Goss grains grew up abnormally by taking advantage of surface energy [33] and finally led to a secondary recrystallization structure dominated by Goss texture.
Magnetic properties are dependent on many factors, including sample surface quality, sample thickness, silicon content, texture, and grain size [34]. The magnetic properties of samples measured in this study are closely associated with grain size and texture. Magnetic inductions of most samples met JEM1239 (GT100) standard at different annealing temperatures were highly related to stronger Goss texture and weaker γ-fiber texture [35]. The iron loss is related to both texture and grain size. According to the iron loss separation results, as shown in Fig. 8, hysteresis loss is the main form of iron loss at lower frequencies, while eddy current loss dominates at higher frequencies. At low frequencies, iron loss is closely related to intensity of Goss texture. High-grade samples show the sharpest Goss textures at 800 °C, which correspond to the lowest iron loss. For low-grade samples, the iron loss also reached the lowest at 800 °C and experienced fluctuations thereafter (rising before dropping) with temperature rising, which was mainly associated with texture and grain size homogeneity.
At a higher frequency, eddy current loss had a higher proportion in total iron loss, meaning that the grain size was more influential on iron loss. As the appropriate critical size (dc) for the lowest iron loss is 0.8-1.0 mm [25], for low-grade samples, iron loss dropped significantly with increasing annealing temperature at medium and high frequencies, which was attributed to both grain size (close to dc) and stronger Goss texture. Both the stronger Goss texture and proper grain size enable low-grade samples to have lower high-frequency iron loss. That is to say, controlling of the annealing process can make the high-frequency iron loss of low-grade samples be lower than that of high-grade samples.
For preparation of ultra-thin grain-oriented electrical steel, from the perspective of magnetic induction, samples with higher initial Goss orientation can be selected for production in the annealing conditions corresponding to primary recrystallization, i.e., at around 800 °C. From the perspective of high-frequency iron loss, samples with larger initial Goss orientation can be selected for production at a high temperature for a longer time. Besides, as the thin strips made of low-grade samples have better magnetic properties than the initial samples, theoretically low-grade products can be converted into high-grade ones on industrial scale. As all thin strips are used at medium or high frequencies, low-grade grain-oriented electrical steel products can be selected to produce ultra-thin grain-oriented electrical steel with excellent magnetic properties.
In this study, the high-grade and low-grade grain-oriented electrical steels were cold rolled and annealed to investigate the effect of initial Goss texture sharpness on texture evolution and magnetic properties of ultra-thin grain-oriented electrical steel. The main conclusions can be drawn as follows:
(1)The induced factors for recrystallization texture of two grades samples during recrystallization annealing are different. The high-grade samples show texture induced mechanism while the low-grade samples present a strong surface-energy-induced mechanism.
(2)Initial Goss texture sharpness has a great impact on magnetic properties of ultra-thin grain-oriented electrical steel. The ultra-thin strips made of high-grade grain-oriented electrical steel products exhibited better low-frequency magnetic properties at primary recrystallization temperature, while those made of low-grade grain-oriented electrical steels exhibited better high-frequency magnetic properties at secondary recrystallization temperature.
(3)Magnetic properties of electrical steel strips made from low-grade products can be significantly improved by controlling the annealing process, thus achieving conversion from low-grade grain-oriented electrical steel products to high-grade products.
This work was financially supported by the National High Technology Research and Development Program of China (Grant No. 2012AA03A505).
The authors have declared that no competing interests exist.

 WeChat
/
| 〈 |
|
〉 |