Search for articles:
Chi Zhang
Corresponding authors:
Received: 2017-02-11
Revised: 2017-02-11
Online: 2017-02-11
Copyright: 2017 Editorial board of Acta Metallurgica Sinica(English Letters) Copyright reserved, Editorial board of Acta Metallurgica Sinica(English Letters)
More
Abstract
The galvanic corrosion behavior of carbon fiber reinforced polymers (CFRPs) GM-CFRP and Tepex-CFRP in contact with a Zn-coated DP590 steel in solution containing 0.9 wt% NaCl + 0.1 wt% CaCl2 + 0.075 wt% NaHCO3 was investigated. The results showed that the GM-CFRP/steel couple was initially more resistant to galvanic corrosion, but its galvanic corrosion activity gradually became higher than the Tepex-CFRP/steel couple. The different galvanic behaviors of these two couples were discussed based on the electrochemical performance of GM-CFRP, Tepex-CFRP and DP590 coupons in the testing solution.
Keywords:
Carbon fiber reinforced polymer (CFRP) is one of the most important composite materials, which has many advantages, such as lightweight, high strength and high modulus, and has various applications in industry [1, 2, 3, 4, 5, 6, 7, 8]. In practice, CFRP is often used together with engineering metals, such as steels, aluminum alloys and magnesium alloys. The galvanic effect between CFRP and metals has been a big concern for engineers, as these two types of materials have different electrochemical properties. Many investigations on galvanic corrosion damage have been reported [9, 10, 11, 12, 13, 14, 15, 16]. According to the well-known galvanic series in seawater [17, 18, 19], graphite has the noblest open-circuit potential (OCP). Thus, it is always a cathode if in contact with an engineering metal. Previous studies on galvanic corrosion damage of various CFRP/metal couples have enabled engineers to design better CFRP/metal joints, which has to some extent reduced the galvanic corrosion risk, and facilitated the application of CFRP in practice.
Although the measurement and evaluation of galvanic effect between metals and different types of CFRPs [10, 11, 13, 20, 21, 22, 23, 24] have clearly shown that engineering metals, including steel, aluminum, magnesium and their alloys, when coupled with carbon fiber or CFRP, can be preferentially corroded in aggressive environments due to the well-known galvanic effect, some fundamental issues remain unaddressed, such as the influence of the CFRP microstructure and environment factors on galvanic corrosion of metals in contact. It is unclear whether the traditional galvanic theory can be directly applied when CFRP is in contact with an engineering metal, as CFRP may not be a good electronically conducting material like metal.
In this study, the conductivity of two types of CFRPs was measured to examine the applicability of the traditional galvanic principle. After that, the galvanic currents from a Zn-coated DP590 steel caused by the two different types of CFRP were recorded in 0.9 wt% NaCl + 0.1 wt% CaCl2 + 0.075 wt% NaHCO3 solution to understand the influence of CFRP microstructure on galvanic corrosion.
The CFRP composite materials in this study were obtained from two different sources. The samples from GM R&D, denoted as GM-CFRP, were composed of carbon fiber and epoxy resin, while those named as Tepex-CFRP obtained from Tepex Company were made of carbon fiber and nylon. Steel DP590 with a Zn coating was also provided by GM R&D. Such a galvanized steel is widely used in the auto industry. All the samples had dimensions of 100 mm × 40 mm × 2 mm. Their compositions are shown in Table 1.
Table 1 Compositions of test materials
| Sample | Component |
|---|---|
| DP590 | Fe (Bal.), C (0.095 wt%), Cr (0.03 wt%), Ni (0.035 wt%), Si (0.31 wt%); Mn (1.75 wt%), Ti (<0.002 wt%), P (0.011 wt%), S (0.005 wt%) |
| GM-CFRP | Made at GM R&D (50 wt% carbon fiber) |
| Tepex-CFRP | Bond Laminates TEPEX Dynalite 201-C200(6)/45 vol% [45 vol% carbon fiber in nylon 6, 6 (200 g/m2 fabric, 6 layers)] |
The CFRP samples after cleaning with ethanol and distilled water were used directly. Tests were carried out on their original surfaces. For comparison, the surfaces of some CFRP samples were sanded/ground with 80# sandpaper to remove their surface polymer layers to expose the inside carbon fiber. The ground samples were also cleaned with ethanol and distilled water before test.
A GM standard test solution 0.9 wt% NaCl + 0.1 wt% CaCl2 + 0.075 wt% NaHCO3 (GM WORLDWIDE ENGINEERING STANDARD) was used in this study.
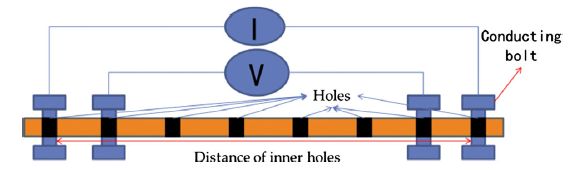
To measure the bulk resistance of a CFRP sample, four holes with diameters of 2 mm were drilled in the sample. Bolts were screwed in the holes tightly. A constant current (0.2 A) was applied to the CFRP sample through the bolts in the outer two holes, and the potential drop between the bolts in the two inner holes was measured. Several inner holes with different distances between each other were made. According to the Ohm’s law, the measured resistance value should be linearly dependent on the distance between two inner holes, and thus, the resistivity of the CFRP can be estimated if the cross-sectional area of the sample is known. The setup for the measurement is schematically illustrated in Fig. 1.
Fig. 1 Schematic illustration of bulk resistance measurement with a constant current (0.2 A) applied to the bolts in the outer holes. The distances between the inner holes used for voltage drop measurement are 2, 4 and 6 cm, respectively
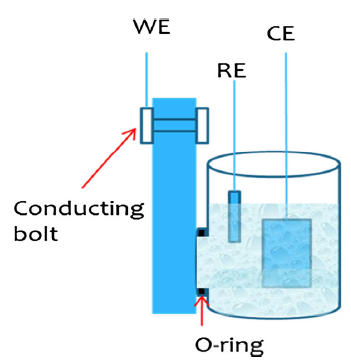
A three-electrode conventional electrolytic cell as shown in Fig. 2 and an electrochemical measurement system AUTOLAB were used to measure the open-circuit potentials (OCP), electrochemical impedance spectra (EIS) and polarization curves of the steel and CFRP samples. In the cell, the counter electrode was a platinum plate and the reference was an Ag/AgCl/saturated KCl electrode. The measured surface area of the CFRP sample was around 0.78 cm2. In polarization curve measurement, the potentiodynamic scanning rate was 0.001 V/s. EIS measurement was carried out at the OCP. The AC potential amplitude was 10 mV, and the frequency range was from 10 mHz to 100 kHz with 10 frequency points per logarithmic decade.
Fig. 2 Schematic illustration of the electrolyte cell setup for open-circuit potential, EIS and polarization curve measurements. The electrolyte volume in the cell is 100 ml
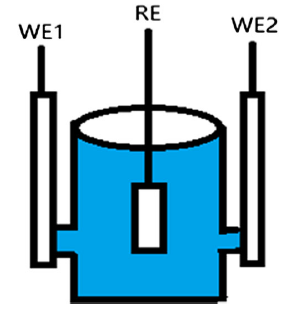
The galvanic currents between CFRP samples and steel were measured in a different electrolytic cells as shown in Fig. 3, in which W1 represents the CFRP sample (a GM or Tepex coupon), W2 is the Zn-coated DP590 steel and RE is an Ag/AgCl reference electrode. The distance between W1 and W2 is 6 cm, and the exposed areas of the CFRP and steel samples are 0.20 cm2.
Fig. 3 Schematic illustration of the setup for galvanic current measurement. The electrolyte volume in cell is 100 ml
The surface morphology and cross-sectional microstructure of CFRP were observed by scanning electron microscopy (SEM, SU70 Hitachi and TM3000).
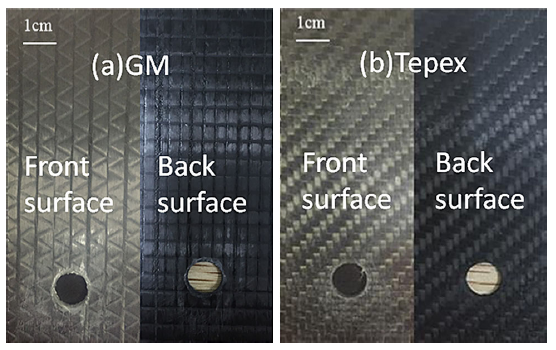
Figure 4 shows the macroscopic morphologies of the two types of CFRP samples, in which the distribution of fiber bundles can be clearly seen. In the GM-CFRP sample, carbon fiber bundles are perpendicularly crossing each other on one side, while on the other side some carbon fiber bundles have a zip-zap distribution between two longitudinally parallel strands. The fiber bundles in the Tepex-CFRP are vertically knitted on both sides, just like the texture of a “woven bag.”
Fig. 4 Macroscopic morphologies of CFRP samples
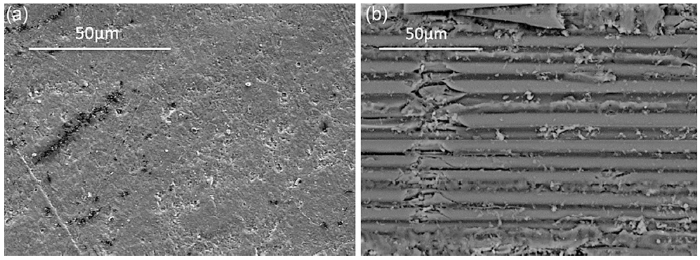
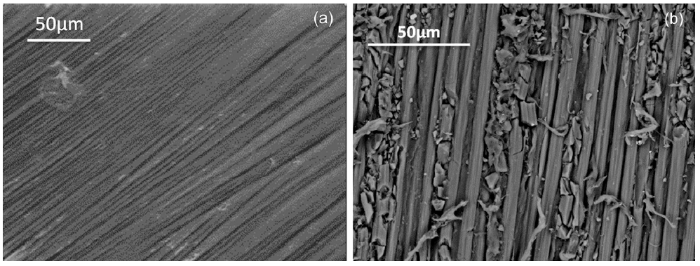
The surface micromorphologies are shown in Figs. 5 and 6. The surface of GM-CFRP is smooth, covered by epoxy. The carbon fiber in the sample can be better revealed after surface grinding (Fig. 5). The diameter of single carbon fiber is about 5 μm. In the Tepex-CFRP sample, the carbon fiber texture can be clearly seen on the original surface (Fig. 6). The nylon layer covering over the fiber on the sample surface appears to be too thin to conceal the fiber texture. Surface grinding led to carbon fiber exposed completely.
Fig. 5 Surfaces of GM-CFRP sample before a, after b surface grinding
Fig. 6 Surfaces of Tepex-CFRP sample before a, after b surface grinding
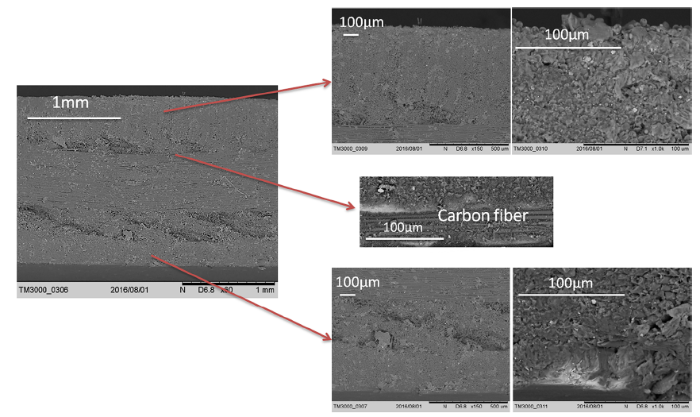
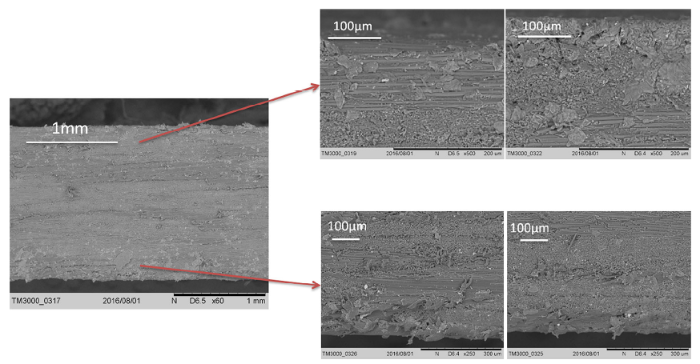
The SEM cross-sectional images clearly show the microstructures of these two types of CFRP samples (Figs. 7, 8). The GM sample is like a “sandwich” with different directions of carbon fiber bundles in different layers. The thickness of these layers can be roughly measured in Fig. 7. The fiber bundles in Tepex sample displayed in Fig. 8 appear to be “knitted” (vertically overlapped) together in nylon matrix.
Fig. 7 Cross-sectional images of a GM-CFRP sample
Fig. 8 Cross-sectional images of a Tepex-CFRP sample
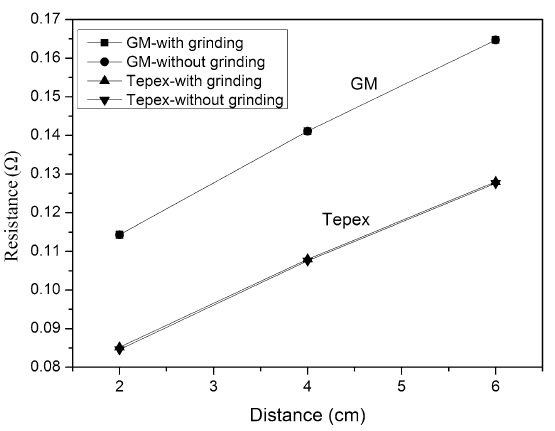
Figure 9 shows a linear dependence of the bulk resistance on measuring distance for GM-CFRP and Tepex-CFRP samples. All the repeatedly measured resistance values are completely overlapped in the figure, indicating high reproducibility of the measurement. The bulk resistivity of GM-CFRP and Tepex-CFRP samples can be estimated to be (0.93-3.12) × 10-3 and (1.20-1.94) × 10-3 Ω/cm-1, respectively, suggesting that the CFRPs are as conductive as metals [25]. There is no difference in bulk resistance before and after surface grinding.
Fig. 9 Bulk resistances for the CFRP samples before and after surface grinding
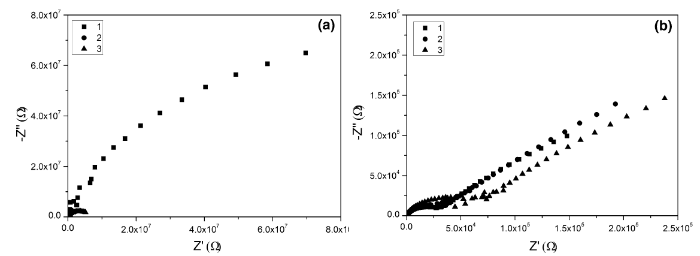
The differences in EIS between GM and Tepex samples measured at their OCPs are shown in Fig. 10. These results represent the impedance behavior of the surface layers of the GM and Tepex samples. They can be summarized as follows. First, the reproducibility of the EIS measurements on GM-CFRP samples was much worse than that on Tepex samples. Second, the EIS of the Tepex-CFRP sample has a Warburg diffusion characteristic, while that of the GM sample does not. Third, the resistance of GM-CFRP estimated from EIS measurement is much higher than that of Tepex-CFRP, indicating that the coverage and thickness of the surface polymer layer could be larger on the GM sample than on the Tepex.
Fig. 10 Repeatedly measured EISs of CFRP samples: a GM-CFRP, b Tepex-CFRP
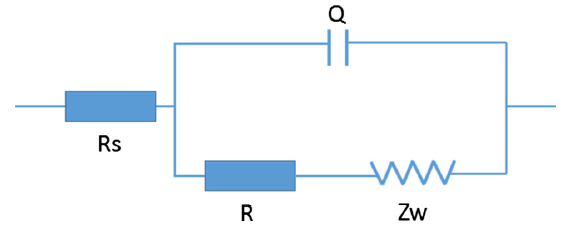
An equivalent circuit as shown in Fig. 11 can be employed to estimate the resistance (R) of the surface polymer layer. In fact, the R value should also include the electrochemical reaction resistance on the carbon fiber surface in contact with solution, although it is negligible compared with that of the surface polymer layer. It should be noted that the Warburg impedance Zw was set at zero when the circuit was used to simulate the EIS of GM-CFRP. The estimated results using the equivalent circuit are listed in Table 2.
Fig. 11 Equivalent circuit for simulating the measured EISs shown in
Table 2 Surface resistance (R) of CFRPs
| Sample | GM-CFRP (Ω/cm-2) | Tepex-CFRP (Ω/cm-2) |
|---|---|---|
| 1 | 1.22 × 10⁵ | 6.41 × 10⁴ |
| 2 | 5.69 × 10⁷ | 4.02 × 10⁴ |
| 3 | 4.81 × 10⁶ | 2.03 × 10⁴ |
| Average | 2.06 × 10⁷ | 4.15 × 10⁴ |
In Table 2 both GM-CFRP and Tepex-CFRP have a high surface resistance, but the former (2.06 × 10⁷ Ω/cm-2) is nearly 3 orders of magnitude higher than the latter (4.15 × 10⁴ Ω/cm-2). The large resistance difference suggests that the GM and Tepex samples should have different surface layers. The former surface could be fully covered by an electrically insulating layer, whereas the surface layer on the latter could be relatively thin and carbon fiber may be exposed in some areas on its surface.
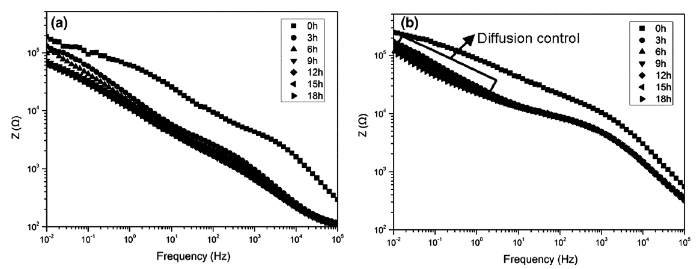
Figure 12 shows the variation of EIS with time for CFRPs under -1 V/Ag/AgCl polarization. The impedance of both CFRPs in low frequencies decreased with immersion time, but their decreasing trends were slightly different; the low-frequency impedance of the GM sample gradually decreased with time, whereas that of the Tepex at the beginning decreased rapidly and then became relatively steady. Finally the resistance of GM-CFRP was even lower than that of Tepex-CFRP.
Fig. 12 Variation of EIS with immersion time for CFRPs under a polarizing voltage of -1 V/Ag/AgCl: a GM-CFRP sample, b Tepex-CFRP sample
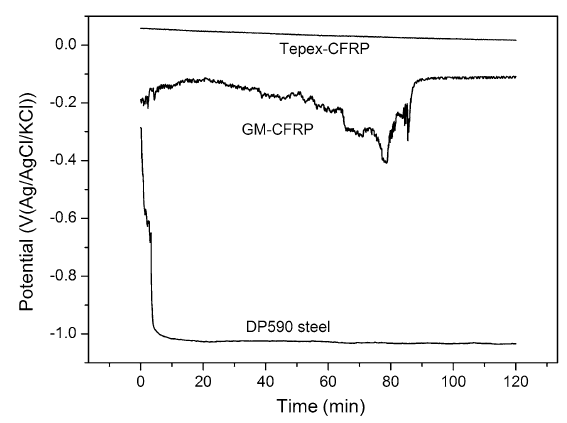
Figure 13 shows the variation of open-circuit potentials (OCPs) of galvanized DP590 steel and the two CFRPs with immersion time. Except the initial few minutes of negatively shifting, the OCP of DP590 steel was relatively steady around -1.03 VAg/AgCl/Cl. The OCPs of GM-CFRP and Tepex-CFRP were around -0.11 VAg/AgCl/Cl- and +0.02 VAg/AgCl/Cl-, respectively, more positive than that of DP590 steel. This is because the electrochemical behavior of carbon fiber in CFRP is similar to a noble metal such as gold or platinum [26]. As reported by Schneider et al. [27], if the potential difference between two materials is <0.05 V, the galvanic corrosion can be ignored. In this study, the potential difference between the CFRPs and steel is about 1 V. It means that the galvanic corrosion will be severe if the CFRPs are coupled with the steel. The OCP measurements also indicated that the Tepex-CFRP/steel couple had a higher driving force for galvanic corrosion than the GM/steel couple.
Fig. 13 OCPs of DP590 steel, GM-CFRP and Tepex-CFRP samples versus immersion time
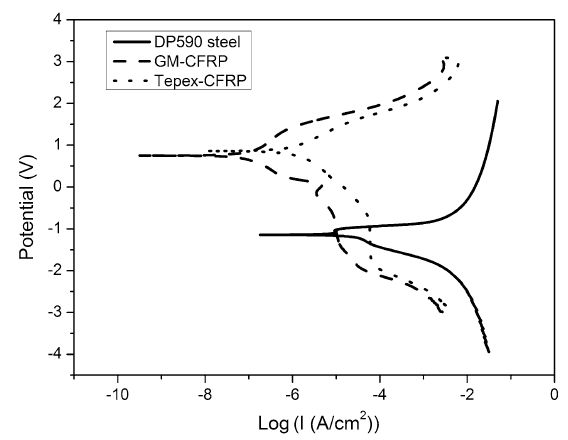
Figure 14 shows the polarization curves of galvanized DP590 steel, GM-CFRP and Tepex-CFRP. The Tepex has the highest OCP while the DP590’s OCP is the most negative. The intersections of their polarization curves are around -1 V Ag/AgCl/Cl-.
Fig. 14 Polarization curves of different samples
An important finding from this figure is that the cathodic current densities of the Tepex sample are higher than those of the GM sample, and the cathodic process on the Tepex sample is completely controlled by diffusion, while the diffusion characteristic on the curve of GM sample appears to be relatively less evident. This explains why the Warburg impedance appeared during the EIS measurement of the Tepex sample, whereas the EIS of the GM sample did not exhibit a diffusion feature (see Fig. 12). The diffusion characteristic appears on Tepex-CFRP sample under -1 V/Ag/AgCl polarization in the initial stage of immersion. The polarization curve predicts that at the beginning the galvanic corrosion of the steel/GM-CFRP couple is less significant than that of the steel/Tepex-CFRP couple, as the anodic polarization curve of the steel intersects at a low current density with the cathodic polarization curve of the GM sample than with Tepex. As the polarization curves of these samples can change with immersion time, the galvanic corrosion of these couples cannot be accurately predicted simply from these polarization curves. The monitoring of real galvanic current densities of couples is thus important and essential.
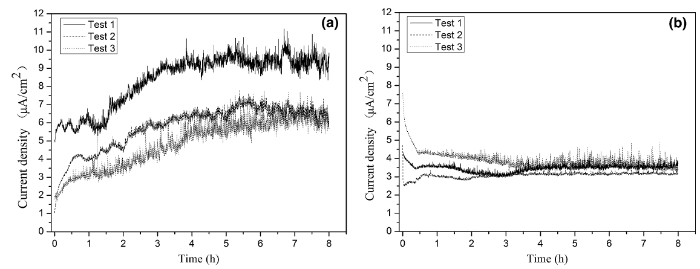
Figure 15 shows the variation of the galvanic corrosion current densities of GM-CFRP and Tepex-CFRP in electric connection with galvanized DP590 steel. In Fig. 15a, the GM-CFRP/steel couple has relatively low initial galvanic current densities (ca. 1-5 μA/cm2), which continuously increases with time in the first 6 h. After that the current densities become relatively stable in the range of 5-9 μA/cm2. In Fig. 15b, the initial galvanic current densities of the Tepex-CFRP/steel couple start at relatively high values (4-7.5 μA/cm2), but they rapidly decrease. The galvanic current densities quickly stabilize around 4 μA/cm2. The time required for the Tepex-CFRP/steel couple to reach the steady current density is considerably shorter than that for the GM-CFRP/steel. In addition, the reproducibility of the galvanic current measurement of the Tepex-CFRP/steel couple was much better than that of the GM-CFRP/steel couple.
Fig. 15 Galvanic current densities of CFRP/steel couples: a GM-CFRP/steel, b Tepex-CFRP/steel
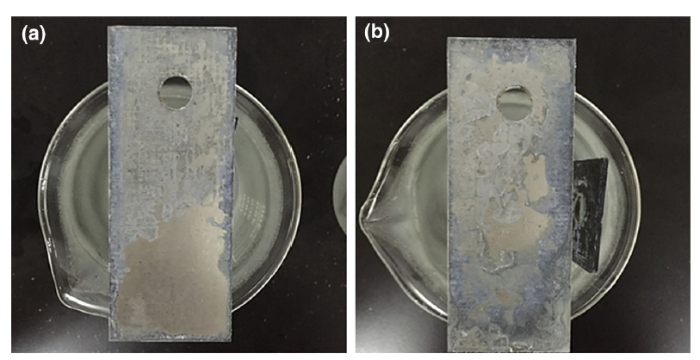
The galvanic current results (Fig. 15) verify the polarization curve prediction that at the beginning the galvanic corrosion of the Tepex-CFRP/steel is more severe than that of the GM-CFRP/steel, and the galvanic corrosion damage of the latter may eventually become more significant than that of the former. This was confirmed by observation of the corrosion damage on the steel surfaces in the steel/GM-CFRP and steel/Tepex-CFRP couples after galvanic current measurements (see Fig. 16). The galvanic corrosion of the steel coupled with the GM-CFRP sample was slightly more localized and with slightly thicker corrosion products on the corroded areas than that with the Tepex-CFRP.
Fig. 16 Galvanic corrosion damage of DP590 steel coupled with a Tepex-CFRP and b GM-CFRP after 8 h of galvanic current measurements
The bulk resistivity of GM-CFRP and Tepex-CFRP is very low (see Fig. 9), which means that they are very electrically conductive. Therefore, the traditional galvanic theory, in which the resistance of the anode and cathode is normally ignored [28, 29, 30], can be directly applied to the metal/CFRP couples. The difference in bulk resistivity between the two CFRPs is relatively small, because both the CFRPs have a similar content of carbon fiber (Table 1). The small resistivity difference (<3.6 × 10⁻⁴ Ω/cm-1) could be ascribed to the different arrangements of the carbon fiber bundles in GM-CFRP and Tepex-CFRP; the fiber bundles in the latter are more tightly knitted than those in the former, which can be seen from their cross sections in Figs. 7 and 8. Surface grinding did not affect the bulk resistance of the CFRPs (see Fig. 9). This is apparently due to the fact that the carbon fiber is the only component conducting electrons in the CFRPs. It also means that the carbon fiber strands distributed in the CFRP samples are very well electrically connected. Since the surface polymer layers are insulating, they cannot have a contribution to the conductivity of the composites and, thus, grinding did not affect their conductivity.
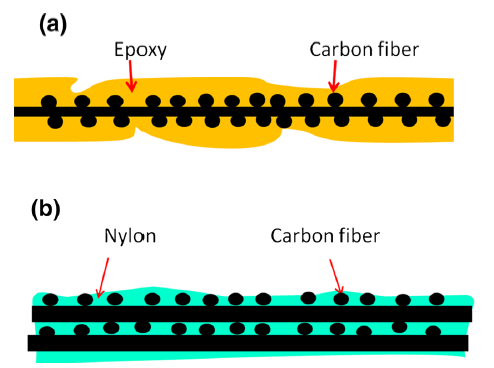
The obvious difference in surface layer resistance between GM-CFRP and Tepex-CFRP (Table 2) could result from their different microstructures or surface states (see Figs. 5, 6). The epoxy layer over the GM-CFRP surface must be relatively permeable and thick (see Fig. 4), and the thickness and permeability may vary from area to area. The nylon layer on the Tepex-CFRP surface could be relatively thin, and some carbon fiber bundles could be exposed through micropores in the thin layer on the original sample surface. The surface polymer layers on these two CFRPs are schematically presented in Fig. 17.
Fig. 17 Schematic illustration of different surface layers of a GM-CFRP, b Tepex-CFRP
The relatively thick surface epoxy layer on the GM sample can more effectively inhibit the electrochemical reactions on the carbon fiber in the initial stage of immersion, and thus, the surface resistance is very high (see Table 2). In other words, the cathodic reaction over the sample surface is very slow, controlling the whole cathodic process. Therefore, no Warburg impedance can be clearly detected in the EIS (Fig. 11). On the contrary, the electrochemical reactions on the Tepex sample, which has a relatively thin, are much fast, i.e., the measured surface resistance is low (Table 2). In this case, the diffusion of oxygen from the bulk solution to the carbon fiber through the micropores in the surface layer is relatively slow, becoming a reaction determining step limiting the cathodic process. Therefore, the EIS is dominated by Warburg diffusion impedance (Fig. 11).
The difference in galvanic current variation with time between the GM-CFRP/steel and Tepex-CFRP/steel couples (Fig. 15) could be caused by different breakdown behaviors of the surface polymer layers. The epoxy layer on GM-CFRP after being penetrated by corrosive solution could gradually break down, resulting in a larger surface area of carbon fiber exposed. The surface layer breakdown process was gradually accelerated, and surface area of carbon fiber in contact with the solution also gradually increased with immersion time. Thus, the galvanic corrosion became faster and current increased with immersion time (Fig. 15a). In Tepex-CFRP, some carbon fiber had already been exposed on the original surface. Thus, immersion could not further worsen the surface layer’s coverage, resulting in a relatively stable galvanic current with immersion time (Fig. 15b).
The EIS measurements (Fig. 12) under -1 V/Ag/AgCl polarization condition also support the postulation regarding the different deterioration behaviors of the surface layers on GM-CFRP and Tepex-CFRP. The gradually decreasing low-frequency impedance of GM-CFRP was obviously caused by the breakdown of the surface epoxy layer, which resulted in an increased surface area of the carbon fiber in the sample exposed to solution. The quickly dropped low-frequency impedance of Tepex sample could result from rapid establishment of steady electrochemical reactions on the carbon fiber exposed to the solution through the micropores in the surface layer, since the carbon fiber in the sample was in contact with solution quickly after immersion. As the nylon matrix in the Tepex sample could not significantly break down under the immersion condition as that on the GM sample, the low-frequency impedance was stably maintained at a relatively high value. This is different from GM-CFRP. In GM-CFRP, more and more carbon fiber was exposed to the solution after the surface epoxy layer broke down. Hence, the final impedance becomes much lower.
1. Both the GM-CFRP and Tepex-CFRP are as conductive as a metal. The traditional galvanic effect theory can be directly applied to a CFRP/metal couple.
2. The open-circuit potentials (OCPs) of GM-CFRP and Tepex-CFRP samples are more positive than that of galvanized DP590 steel. There is a big concern about galvanic corrosion if the CFRPs are used together with the steel.
3. The galvanic corrosion activity can vary with immersion time. The galvanic corrosion of a GM-CFRP/steel couple is initially slower than that of a Tepex-CFRP couple, but the galvanic corrosion of the former can gradually accelerate with immersion time, while the latter process keeps relatively stable, and eventually the Tepex-CFRP/steel becomes slightly more galvanic corrosion resistant than the GM-CFRP/steel.
4. The galvanic corrosion behavior of a CFRP/steel couple is critically dependent on the CFRP’s surface polymer layer. The presence of a resistant surface polymer layer is helpful in inhibiting the galvanic corrosion of a CFRP/steel couple.
This work was supported by GM R&D Center.
The authors have declared that no competing interests exist.

 WeChat
/
| 〈 |
|
〉 |