Search for articles:
Ke-Chang Han , Chuang Dong
Corresponding authors:
Received: 2017-08-18
Revised: 2017-08-18
Online: 2017-08-18
Copyright: 2017 Editorial board of Acta Metallurgica Sinica(English Letters) Copyright reserved, Editorial board of Acta Metallurgica Sinica(English Letters)
More
Abstract
To study the influence of the nitrogen vacancy (VN) on mechanical and electrical properties of zirconium nitride deeply, ZrNx films with different VN concentrations were synthesized on the Si (111) substrates by enhanced magnetic filtering arc ion plating. The morphologies, microstructures, residual stresses, compositions, chemical states, mechanical and electrical properties of the as-deposited films were characterized by field-emission scanning electron microscopy, X-ray diffraction, X-ray photoelectron spectrometry, Nanoindenter and Hall effect measurements. The results showed that ZrNx films exhibited rocksalt single-phase structure within a VN concentration ranging from 26 to 5%. The preferred orientation, thickness, grain size and residual stress of the ZrN x films kept constant at different VN concentrations. Both the nanohardness and elastic modulus first increased and then decreased with the decrease in VN concentration, reaching the peaks around 16%. And the electric conductivity of the ZrN x films showed a similar tendency with nanohardness. The underlying atomic-scale mechanisms of VN concentration-dependent hardness and electric conductivity enhancements were discussed and attributed to the different electronic band structures, rather than conventional meso-scale factors, such as preferred orientation, grain size and residual stress.
Keywords:
Transition-metal nitrides (TMNs) are well known as a class of fascinating and technologically important ceramic materials which crystallize normally in the rocksalt (B1) structure [1, 2]. The close-packed rocksalt structure hinders the migration of species, with the result of excellent thermal and chemical stability against, for example, oxidation or self-diffusion [3]. As a typical one of TMNs, zirconium nitride (ZrN) has been widely used as a coating material, ranging from hard and protective coatings on mechanical tools, wear resistant and decorative layers on optical components, to the diffusion barriers in microelectronics owing to its exceptional thermal and mechanical properties, and electrical conductivity [4, 5, 6]. And intriguingly, ZrN x has the wide solid solution region, i.e., retains the rocksalt structure within large composition range [7, 8]. This provides the possibility to tailor its material properties by selecting specific stoichiometric ratio.
Nitrogen vacancy (VN) normally exists in substoichiometric ZrN x phases and is regarded as the primary defect that controls the stoichiometric ratio [7]. Therefore, VN engineering has been the focus of some experimental studies attempting to tailor the properties of ZrN x . Several studies have revealed that its mechanical properties strongly depend on the VN concentration and the tendency does not follow the monotonous rule that vacancies reduce the number of chemical bonds and hence the strength of materials [9, 10, 11]. For instance, Abdallah et al. [10] reported that the maximal hardness was obtained at VN concentration of 9% and Huang et al. [11] got the maximal hardness at VN concentration of 20%. Similarly, the resistivity of ZrN x film was also reported to reach its bottom at the specific substoichiometric point such as VN concentration of 21% by Khan et al. [12]. However, the unusual mechanical and electrical properties behaviors were often attributed to the influence of conventional microstructural features, such as preferred orientation, residual stress and grain size [10, 11, 12]. The underlying atomic-scale mechanisms and pathways leading to the development of mechanical and electrical properties are still concealed by the conventional meso-scale factors and not properly understood.
In this work, more delicate experiments were carried out to further study the influence of VN concentration on mechanical and electrical properties of the rocksalt ZrN x films and explore the underlying atomic-scale mechanisms. The enhanced magnetic filtering arc ion plating (MFAIP) was used to synthesize high-quality ZrN x films with different VN concentrations by varying the nitrogen flow rate. And other deposition parameters were precisely controlled to weaken the influence of conventional meso-scale factors as possible.
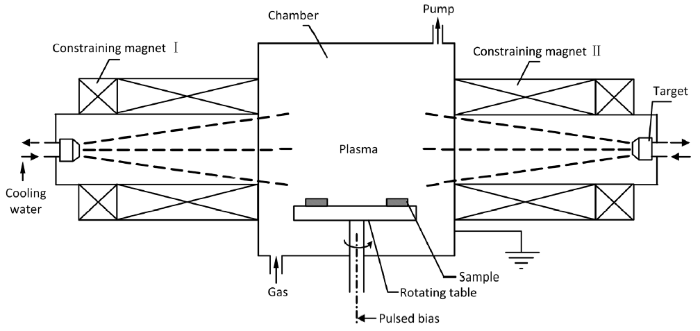
ZrN x films were deposited on the Si (111) substrates with a size of 15 mm × 15 mm by the enhanced MFAIP system. Figure 1 shows the schematic diagram of the enhanced MFAIP system. Two high-purity (99.99%) Zr targets with a size of 55 mm in diameter were positioned symmetrically on two opposite sides of the chamber. A rotating sample holder was set in the center of the chamber. The straight magnetic filtering system consisted of two grade magnetic coils was placed before the targets and used to stream the plasma to the chamber utilizing plasma guiding by magnetic fields.
Fig. 1 Schematic diagram of enhanced magnetic filtering arc ion plating system
Before loading into the deposition chamber, the Si (111) substrates were cleaned in acetone and ethanol for 10 min, respectively. When the base pressure in the chamber was down to 5.0 × 10⁻³ Pa, the substrates were preheated and then maintained at 200 °C. Ar plasma at 1.6 Pa pressure was used to clean the surface of the substrates with a pulsed bias voltage of 850 V × 30 kHz × 50% for 10 min. During the deposition process, argon and nitrogen gases were fed into the chamber by mass flow controller and total working pressure was kept constant at 0.6 Pa. The target currents were maintained at 90 A, and the pulsed bias voltage was down to 300 V × 30 kHz × 30%. The total deposition time was 80 min. Seven groups of ZrN x films with different VN concentrations (S1-S7) were prepared by only varying the nitrogen flow rate from 60 to 270 sccm. Detailed nitrogen flow rates and percent of nitrogen in the plasma of ZrN x films are listed in Table 1.
Table 1 Nitrogen flow rate of ZrN x films deposited by arc ion plating
| Sample | S1 | S2 | S3 | S4 | S5 | S6 | S7 |
|---|---|---|---|---|---|---|---|
| Nitrogen flow rate (sccm) | 60 | 120 | 150 | 180 | 210 | 240 | 270 |
| Percent of nitrogen in plasma (%) | 16 | 30 | 37 | 43 | 49 | 55 | 60 |
The field-emission scanning electron microscope (Zeiss Supera55) was utilized to observe the surface and cross-sectional morphologies. The Bragg-Brentano X-ray diffraction (Bruker D8) was utilized to study the crystallographic structure of the ZrN x films by using Cu K α radiation (wavelength λ = 0.154 nm). Chemical states and compositions of the as-deposited films were examined by the X-ray photoelectron spectrometer (VG ESCALAB 250) with a monochromatic Al K α source (1486.6 eV). The residual stress was determined by modified XRD sin2ψ (ψ is the angle between stress direction and surface normal direction) method using a four-circle diffractometer with psi-goniometer geometry [13]. Nanoindentation tests were carried out on a nano-indenter system (MTS XP) fitting with a Berkovich indenter under the continuous stiffness measurement mode, and the values were evaluated at about 10% of the film thickness to avoid the substrate effect. The electrical conductivity, carrier concentration and mobility were determined by Hall effect measurement system (Ecopia HMS-5000) at room temperature.
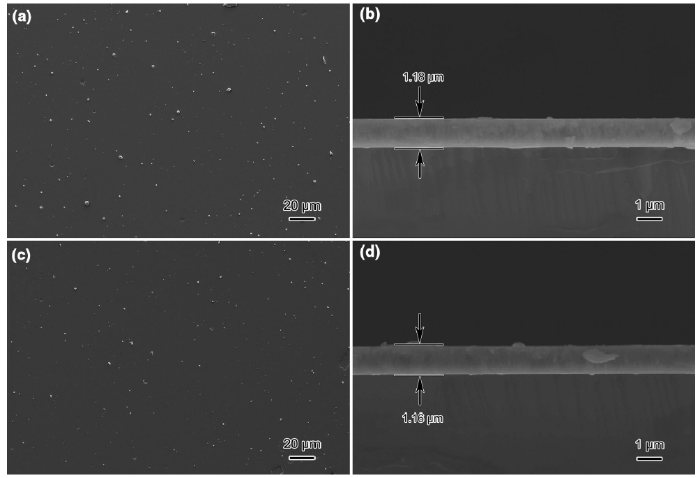
The typical surface and cross-sectional SEM images of ZrN x films at different nitrogen flow rates are shown in Fig. 2. The surface is uniform, dense and fewer macroparticles are observed compared with traditional DC bias arc ion plating [14, 15]. The reasons for the improvement of film deposition quality mainly come from the adoption of enhanced magnetic filtering system and pulsed bias. The enhanced magnetic filtering system with two grades magnetic coils can effectively restrain the macroparticles from reaching the substrates. And the introduction of pulsed bias can form the oscillating plasma sheath above the substrates and induce more negative charging in the macroparticles and then improve the films deposition quality ulteriorly by coulomb repulsive effect between negatively charged macroparticles and substrate [15, 16]. The thicknesses of ZrN x films were determined by the cross-sectional images and found to be stable at around 1.17 μm with the increase in nitrogen flow rate.
Fig. 2 Surface a, c and cross section b, d SEM images of ZrN x films deposited at nitrogen flow rates of 60 sccm a, b and 270 sccm c, d
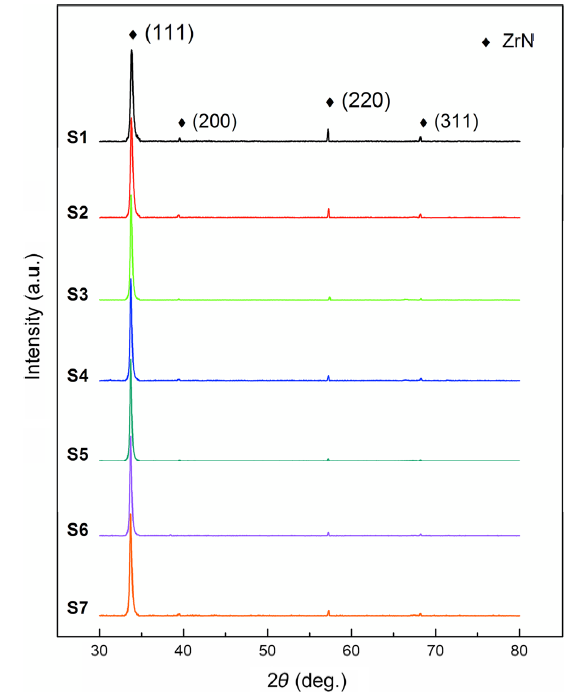
X-ray diffraction patterns of the ZrN x films deposited at different nitrogen flow rates are presented in Fig. 3. The strongest peak corresponds to (111) crystal plane of the rocksalt structure ZrN (JCPDS#35-0753). Other weak peaks corresponding to diffractions from ZrN (220), ZrN (200) and ZrN (311) are also observed. The patterns indicate that all the ZrN x films perform the stable rocksalt structure and show the preferential growth along (111) orientation.
Fig. 3 XRD patterns of ZrN x films deposited at different nitrogen flow rates
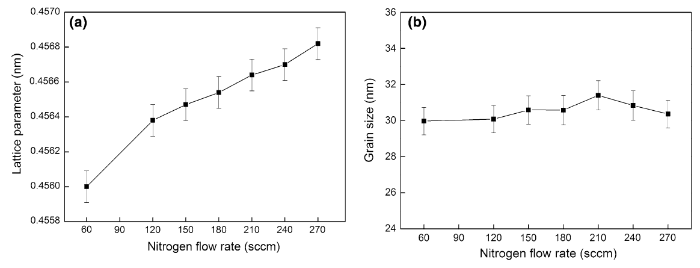
Figure 4a shows the lattice parameters of ZrN x films deposited at different nitrogen flow rates. It can be seen that the lattice parameter increases monotonously with the increase in nitrogen flow rate. This may be attributed to the effect of VN in the substoichiometric ZrN x films. For the TMN x films deposited at low nitrogen flow rate, VN is believed to be formed in the crystal lattice as mentioned before, leading to the shrinkage of lattice parameter [7, 17, 18]. As the nitride flow rate increases, VN concentration decreases and the shrinkage develops. And the rocksalt structure can be preserved maybe benefit from the suppression of migration and clustering of VN by the large VN diffusion barrier [7].
Fig. 4 Lattice parameters a and grain sizes b of ZrN x films deposited at different nitrogen flow rates
The position of the ZrN (111) diffraction peak and the corrected full width at half maximum (FWHM) are used to estimate the grain size by the Scherrer equation. The grain size changes within a small range from 30.0 to 31.4 nm, maintaining nearly constant within the error ranges as shown in Fig. 4b. The grain size of thin film was reported to be controlled by the mobility of adatoms during growth, which were mainly determined by incident energy of atom, substrate temperature and ion impingement [19]. As the deposition pressure, substrate temperature and pulsed bias all keep constant in this study, the mobility of the adatoms during growth stays the same level and then the grain size can thus remain stable.
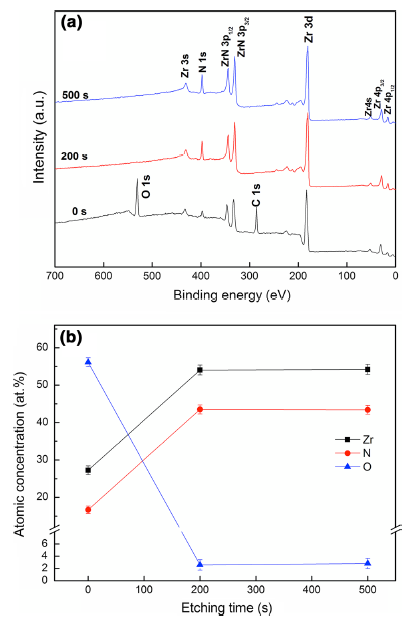
To further confirm the composition and chemical states of ZrN x coatings, the XPS spectra are investigated. The adventitious carbon C 1s peak with the binding energy of 284.6 eV is utilized to calibrate the binding energies. Figure 5a is the representative XPS spectra of ZrN x film showing the photoelectron peaks from Zr, N, O and C after Ar plasma etching for 0s, 200s and 500s. It can be seen that the peaks from O and C disappear after etching for 200s and the spectrum after etching for 500s is same with the 200s.
Fig. 5 XPS wide scan spectra a and atomic concentration versus etching time b of ZrN x film deposited at a nitrogen flow rate of 120 sccm
High-resolution spectra are recorded for each individual photoelectron peak, and the atomic concentration is calculated by the relative ratio of the peaks area in the high-resolution XPS spectra, using the standard atomic sensitivity factors of the instrument (N: 0.477, O: 0.78 and Zr: 2.576). Figure 5b is the typical atomic concentration of ZrN x film (S3) at different etching times. The results agree well with the analysis of the wide scan spectra above. Up to 56.6 at.% of the oxygen was found in the ZrN x film without Ar plasma etching and then down to 2.6 at.% after etching for 200s and 500s. The atomic concentrations of Zr and N show the similar tendency with the increase in etching time. They both increase from 0s to 200s and then keep consistent at 500s. This indicates that surface contaminants have been removed significantly after Ar plasma etching for 200s. And the 2.6 at.% of oxygen may be introduced by the residual oxygen gas in the chamber during deposition.
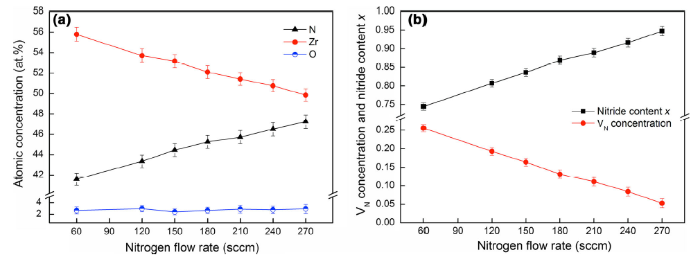
The atomic concentrations calculated after Ar plasma etching for 500s are selected as the compositions of ZrN x films. Figure 6a shows the chemical compositions of the ZrN x films deposited at different nitrogen flow rates. It can be seen that Zr content decreases from 55.7 to 49.8 at.%, N content increases from 41.6 to 47.3 at.%, and O content keeps at about 2.5 at.% with the increase in nitrogen flow rate. And the nitrogen content x can thus be adjusted over a range from 0.74 to 0.95, as shown in Fig. 6b. According to the reports and analysis of XRD results above, VN is believed to be formed in the rocksalt crystal lattice of substoichiometric ZrNx films. And the VN concentration can be calculated by comparing the nitrogen content x with the standard stoichiometry ratio. Figure 6b shows the variation of VN concentration versus nitrogen flow rate. It can be seen that the VN concentration changes from 26 to 5% with the increase in nitrogen flow rate.
Fig. 6 Atomic concentration a, nitrogen content x and VN concentration b of ZrN x films versus nitrogen flow rate
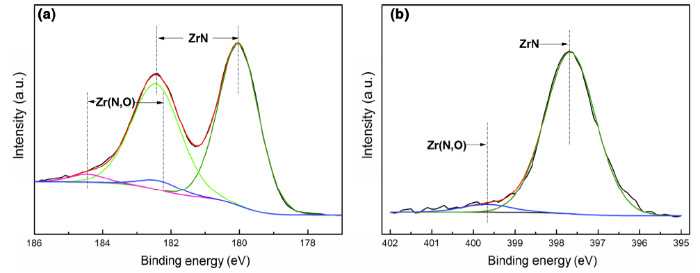
To confirm the chemical states of ZrN x films, the deconvolution of high-resolution XPS spectra corresponding to Zr 3d and N 1s after etching for 500s is studied. Figure 7 shows the representative high-resolution XPS Zr 3d (a) and N 1s (b) spectra of ZrN x film deposited at 120 sccm. The Zr 3d peak is found mainly to consist of individual peaks corresponding to ZrN: Zr 3d5/2 at 179.9 eV and Zr 3d3/2 at 182.33 eV [4]. The smaller peaks are attributed to Zr(O, N) formed by the residual oxygen gas in the chamber during deposition, which can be assigned to Zr 3d5/2 at 182.2 ± 0.2 eV and Zr 3d3/2 at 184.45 eV [4, 20]. High-resolution N 1s spectra are found to be with contribution from nitrogen peaks corresponding to ZrN at 397.6 eV and Zr(O, N) at 399.7 eV [20]. The XRD and XPS results confirm that the substoichiometric ZrN x films with different VN concentrations perform the stable rocksalt structure and chemical states.
Fig. 7 High-resolution XPS Zr 3d a and N 1s b spectra of ZrN x film deposited at a nitrogen flow rate of 120 sccm
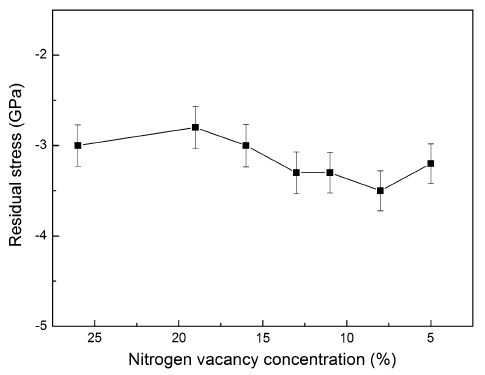
Residual stress of the ZrN x films is obtained by modified XRD sin2ψ method [13]. X-ray is incident at an angle of 2° to increase the diffraction volume of the thin film specimen, and the (220) diffraction is selected to derive the variation of lattice spacing among different ψ angles. With Young’s modulus of 460 GPa and Poisson’s ratio of 0.186 [21, 22], the residual stresses of ZrN x films are then calculated from the XRD data and shown in Fig. 8. It can be seen that the residual stress remains stable at around -3.2 GPa, showing no significant dependence on the VN concentration. Because the pulsed bias, deposition temperature and working pressure are constant, the plasma sheath above the substrates keeps stable. The energy of nitrogen and zirconium ions can thus keep constant at different nitrogen flow rates. So the same growth state and deposition rate of ZrN x films are observed. And also because ZrN x has the wide solid solution region, the films with different nitrogen content x all perform the stable rocksalt structure and lattice distortion in this work. So the residual stress can thus keep constant.
Fig. 8 Residual stress of ZrNx films versus VN concentration
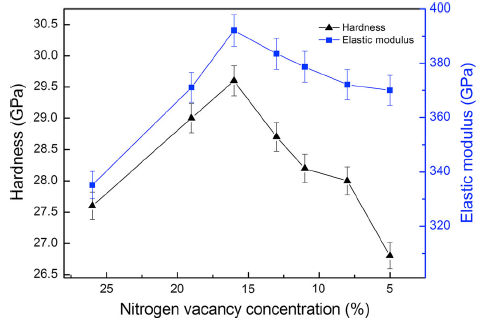
The nanohardness and elastic modulus of ZrN x film versus VN concentration are demonstrated in Fig. 9. The hardness first increases from 27.6 GPa at 26% to the maximum of 29.6 GPa at 16% and then gradually decreases to 26.8 GPa at 5% with decrease in VN concentration. The elastic modulus shows the similar variation tendency with the hardness, reaching the top of 392.1 GPa at VN concentration of 16%. The variation tendency is similar with many studies of other researchers and also our previous work about TiN x [9, 10, 23], while the reasons for higher hardness compared to 25.0 GPa reported by Singh et al. [9] and 26.5 GPa by Huang et al. [11] may be from the excellent deposition quality and strong preferential growth along (111) orientation in this work.
Fig. 9 Hardness and elastic modulus of ZrN x films versus VN concentration
It is well known that several conventional meso-scale factors may contribute to the material strength of hard thin films marked with hardness and elastic modulus, such as crystallographic texture, grain size, roughness and the lattice distortion (residual stress) [24, 25, 26]. In this study, the test results show that all the ZrN x films have excellent deposition qualities and similar morphologies. And within the large VN concentration range (26-5%), ZrN x films perform the stable rocksalt single-phase structure and keep the preferred orientation unchanged. In addition, the film thicknesses, grain sizes and residual stresses are also almost constant. Therefore, it is confirmed that the influences of conventional meso-scale factors on the hardness variation have been significantly controlled and the VN concentration-dependent peak values may be originated only from the atomic-scale factors, such as different energy band states and electronic structures caused by the change in VN concentration. This is also the reason why the hardness variation is not so large.
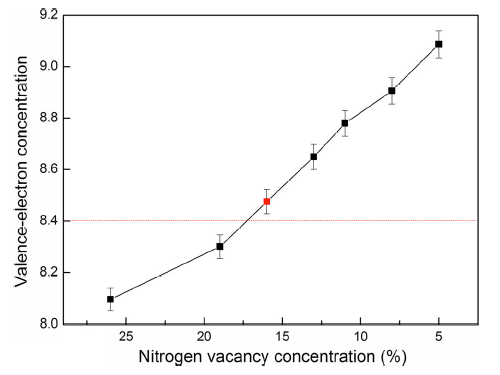
The theory simulation about atomic-scale strengthening mechanism of transition-metal carbonitrides TMC x N1-x has been reported by Jhi et al. [27], which may be an important reference to how to understand and explain the phenomenon in this work. It was reported that the highly directional coupling between transition-metal electrons and non-metal electrons can result in a strongly shear resistive covalent pdσ energy band and such band will give a positive contribution to the hardness, while the metallic σ band state derived from d-d interactions is unstable against shear deformations and will give a negative contribution. In our work, more valence electrons are brought in with the decrease in VN concentration and most of them gradually fill the covalent pdσ band formed by Zr 4d and N 2p states and few fill the metallic σ band formed by Zr 4d states at first, which give a rise to the hardness and elastic modulus. And the following decrease in hardness and elastic modulus is attributed in large part to the rapidly filling into metallic σ band after the covalent pdσ band was completely filled. The greatest hardness of transition-metal carbonitrides TMC x N1-x reported by Jhi et al. [27] was expected at the stoichiometry point which gives a valence electron concentration (VEC) of 8.40 per cell. In this work, the best performances of the ZrN x films are obtained at VN concentration of 16%. Considering the contribution of residual oxygen, the VEC of ZrN x film at VN concentration of 16% is 8.48 as shown in Fig. 10 (outermost electron configuration of Zr, N and O are 4d25s2, 2s22p3 and 2s22p4), which agrees well with the calculated value of 8.40 reported by Jhi et al.
Fig. 10 Valence-electron concentration of ZrN x films versus VN concentration
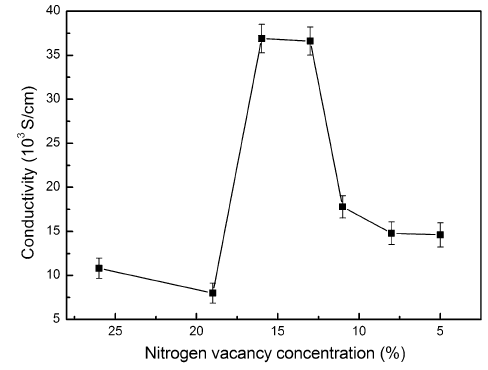
Electric conductivity (σe), carrier concentration (n) and mobility (μ) of the ZrN x films with different VN concentrations are investigated by Hall measurements system using the van der Pauw configuration under 0.558 T magnetic field at room temperature. The dependence of conductivity on VN concentration is illustrated in Fig. 11. It can be observed that the conductivity is sensitive to the variation of VN concentration. It keeps stable around 9.0 × 10³ S/cm at first and then increases to 3.7 × 10⁴ S/cm suddenly around VN concentration of 15% and decreases gradually to 1.5 × 10⁴ S/cm finally.
Fig. 11 Conductivity of ZrN x films versus VN concentration
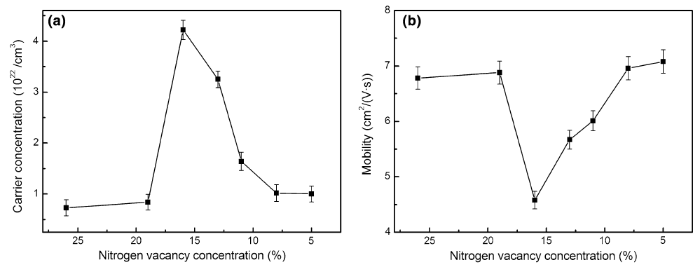
The conductivity is a little higher than that of the standard nitride semiconductor materials such as gallium nitride and indium nitride [28], but the VN formed in crystal lattice could act as the donor-like defect which makes the behavior of electrical properties of substoichiometric ZrN x films be very similar to the semiconductor [29, 30]. So the electric conductivity of ZrN x films can be regarded as a product of carrier concentration and mobility by the formula: σe = nqμ (q is charge quantity of carrier) [31]. Figure 12 shows the carrier concentration and mobility of ZrN x films versus VN concentration. The carrier concentration shows a similar tendency with conductivity while the mobility changes in an opposite way. So the carrier concentration is perhaps the most critical variable in determining the tendency of electric conductivity. With respect to the analysis above, more valence electrons are brought in with the decrease in VN concentration and most of them gradually fill the covalent pdσ band and few fill the metallic σ band before VEC of 8.40. The covalent pdσ band is below the Fermi level which contributes little to the conduction electron, and the metallic σ band is above the Fermi level which can increase the conduction electron [32, 33]. So before VEC of 8.40, the valence electrons brought by the filling of VN contribute little to the carrier concentration and thus it keeps stable, while the sudden increase in carrier concentration at VEC of 8.48 can be ascribed to the rapid filling of metallic σ band after the covalent pdσ band is completely filled at VEC of 8.40. And the reason for the following gradual decrease in carrier concentration may come from the negative contribution of the vanish of VN. The VN could act as donor-like defects and add extra free electrons to the conduction band [30]. As the VN is filled gradually with the increase in nitrogen content, the negative contribution to the carrier concentration becomes more apparent, so the decreasing tendency is observed.
Fig. 12 Carrier concentration a and mobility b of ZrN x films versus VN concentration
The carrier mobility of ZrN x films versus VN concentration shows an opposite way with carrier concentration. This tendency can be regarded as the combined effect of electron scattering due to the carrier and VN defects. With the increase in carrier concentration, the electron scattering due to the carrier will be heightened and so the mobility will decrease. This is the major factor that determines the opposite tendency with carrier concentration. And the gradual vanish of VN will accelerate the weakening of the electron scattering of VN defects, which also contribute to the tendency of mobility.
High-quality ZrN x films with different VN concentrations were successfully synthesized on the Si (111) substrates by varying the nitrogen flow rate using the method of enhanced magnetic filtering arc ion plating. The ZrN x films all exhibited stable rocksalt single-phase structure and kept the preferred orientation unchanged within the large VN concentration range (26-5%). The thickness, grain size and residual stress of ZrN x films with different VN concentrations were not changed so much. Both the nanohardness and elastic modulus of ZrN x films first increased and then decreased with the decrease in VN concentration, and the maximums were obtained at 16%: 29.6 GPa and 392.1 GPa. The electric conductivity was also found highly dependent on the VN concentration and showed a similar tendency with nanohardness. The VN concentration-dependent mechanical and electrical enhancement of the ZrN x films in this work was found from the different atomic-scale electronic band structure, rather than the conventional meso-scale factors, such as crystallographic texture, grain size and residual stress.
This work was supported financially by the National Natural Science Foundation of China (No. 51271047).
The authors have declared that no competing interests exist.

 WeChat
/
| 〈 |
|
〉 |