Search for articles:
Chi Zhang , Li-Wen Zhang
Corresponding authors:
Received: 2016-04-29
Revised: 2016-06-19
Online: 2017-01-20
Copyright: 2017 Editorial board of Acta Metallurgica Sinica(English Letters) Copyright reserved, Editorial board of Acta Metallurgica Sinica(English Letters)
More
Abstract
A mesoscale model of plastic deformation of ferritic stainless steels (FSSs) is formulated by combining a crystal plasticity finite element model with 3D cellular automaton algorithm. The actual grain orientations of FSS cold rolling and annealing sheet have been detected by electron backscatter diffraction and selected to be assigned to the polycrystal model. The simulation results have been validated by comparing the calculated true stress-strain response with the experimental one. For the lack of considering the interactions of dislocations with impurities, there are no upper and lower yield points in the simulation stress-strain curves. However, the calculated yield strength and the stress-strain response after yielding agree well with the real material. The local stress and strain fields show inhomogeneous at mesoscale. The plastic deformations of the grains with typical orientations have been characterized. The analysis reveals that the grains with α fiber texture show higher thickness reduction ratio as compared to others. The deformation behaviors of the grains in polycrystal are not only related to the orientations but also to the interactions from adjacent grains.
Keywords:
Ferritic stainless steels (FSSs), which are one kind of nickel-saving stainless steels, have been widely used for kitchen equipments, automotive exhaust manifolds, house wares, chemical industries, and so on [1]. To improve the deep drawing formability and corrosion resistance, some high purified FSSs were recently developed by decreasing the contents of C and N and addition of micro-alloying elements, such as Nb and Ti [2-4]. However, most of FSSs still show inferior formability as compared to austenitic stainless steel. Besides, FSSs tend to develop an undesirable surface corrugation known as surface ridging when subjected to tension or deep drawing [5]. In particular, for the high purified FSSs, the surface ridging tendency is more severe. The deep drawing formability and surface ridging tendency of FSSs are supposed to be closely related to the texture of the sheets [6]. At the macro-texture level, two typical fiber textures, {111}//ND-γ fiber texture and {110}//RD-α fiber texture, are usually formed in FSSs after cold rolling and annealing. The γ fiber texture is thought to be beneficial for the increasing of formability. And the α fiber texture is deteriorative for the formability. From the point of micro-texture analysis, the arrangements of grain colonies along rolling direction with similar orientations accumulate together are supposed to be the reasons for the occurrence of surface ridging [7].
Slip of the dislocations is the main plastic deformation mechanism for FSSs. Due to the existence of texture, the FSS polycrystals show anisotropic properties during processing. Detailed experimental studies have been conducted to investigate the relationships between the texture and formability of FSSs [1, 6]. But, few studies have been done to calculate or simulate the plastic deformation of FSS polycrystals. Modeling the plastic deformation of FSS polycrystals is beneficial for understanding the effects of orientations on the deformation behavior as well as the anisotropic mechanical behaviors. Besides, Yazawa et al. [8] estimated that the slip of \(\{ 112\} < 111 >\) systems is suppressed by the Cr atoms, which is the reason for FSSs possess higher Lankford value than interstitial free (IF) steels with the same {111}//ND texture intensity. But, this is difficult to be observed by experimental investigation. Maybe using simulation technique can testify this.
In the past two decades, the crystal plasticity finite element method (CPFEM) becomes one of the effective methods to study the plastic deformation behavior of single crystal and polycrystal [9]. Various constitutive formulations for plastic flow and hardening are incorporated into the finite element (FE) model [10-12]. Based on the continuum mechanics, the CPFEM can solve the interactions between grains at grain boundaries [13, 14]. For the FSSs, Shin et al. [5] have used CPFEM to model the effect of texture on ridging. They compared three typical models for the occurrence of surface ridging for FSSs, i.e., Chao’s model [15], Takechi’s model [16] and Writgh’s model [17]. Their simulated results indicate that ridging is well simulated by CPFEM. Wu et al. developed an FEM based on crystal plasticity to directly incorporate the measured electron backscatter diffraction (EBSD) data to modeling surface ridging [18, 19]. Tikhovskiy, Raabe and Roters simulated the texture evolution of a 17%Cr FSS during cold rolling using the texture component CPFEM [20]. The main task of the texture component CPFEM is to represent sets of spherical Gaussian orientation components on the integration points of an FE mesh for crystal plasticity simulation. Raabe et al. [21] also simulated the occurrence of earing after drawing which is an anisotropic mechanical property at large scale. However, these previous studies mainly focused on the macro-anisotropic properties of FSSs. The morphology of the grains is simplified to cubic. And the grain boundaries are significantly different from the real ones. A few attentions have been paid on modeling of the polycrystal structure. The analysis of the stress-strain response of grains with different orientations is also rare.
In this work, a 3D polycrystal grain structure was established using 3D cellular automaton (CA) method. The initial orientations of the grains were assigned through the analysis of the measured EBSD data of actual FSS sheets. Then, the plastic deformation behavior of FSSs based on the slip of dislocations was investigated using CPFEM.
Generally, Voronoi tessellation is preferred to be used for generating the polycrystal microstructure. However, Ardeljan et al. [22] pointed that the Voronoi tessellation has some limitations. The domains (or grains) generated by Voronoi tessellation are near-equiaxed. And Voronoi tessellations almost yield perfectly planar boundaries. These are quite different from those real grain structures.
CA has been extensively used to model the grain growth and recrystallization of materials [23, 24]. In this work, a 3D-CA approach is utilized to construct the polycrystal geometry. In the initial period, the nucleation sites are randomly chosen from the cells. RAND()∈(0,1) which is a uniformly distributed stochastic function in the FORTRAN program is used to generate the nucleation sites. The grain numbers (GN) are assigned to the nucleation sites to track the grains. During the growth period, the probability switching rule is defined depending on the state of the neighboring cell. The Moore neighborhood which includes the nearest (6 cells) and second-nearest (12 cells) neighbors was taken into account for the state switching rule. A color state variable with the total number of 64 was used to define the color of the grains for visualization. The adjacent cells that belong to different grains form the grain boundaries.
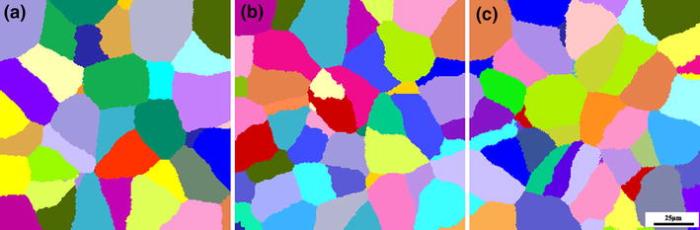
Based on the microstructure observation, 400 grains in total were generated in a cubic sample. The CA simulation mesh is composed of 300 × 300 × 300 cells, which is corresponding to a cubic sample with the length of 150 μm. Figure 1 shows the three typical surfaces of the polycrystal model generated by 3D-CA. The microstructure is mainly composed of equiaxed grains. It should be noted that the grains are 3D geometry. Different grain sizes and morphologies may be presented from the section view with different depths.
Fig. 1 3D microstructure of polycrystal generated by 3D-CA: a-c are the three typical surfaces of the polycrystal
If the grains are assumed to be sphere, the average grain size (\(d_{0}\)) can be calculated as follows:
$$d_{0} = 2L_{\text{cell}} \cdot \sqrt[3]{{{{({3 \mathord{\left/ {\vphantom {3 4}} \right. \kern-0pt} 4}) \cdot N_{\text{cell}} } \mathord{\left/ {\vphantom {{({3 \mathord{\left/ {\vphantom {3 4}} \right. \kern-0pt} 4}) \cdot N_{\text{cell}} } {\pi \cdot N_{\text{grain}} }}} \right. \kern-0pt} {\pi \cdot N_{\text{grain}} }}}},$$ (1)
where Lcell is the length of the cell, Ncell is the total number of cells, Ngrain is the number of grains. Thus, the average grain size is calculated to be about 25 μm.
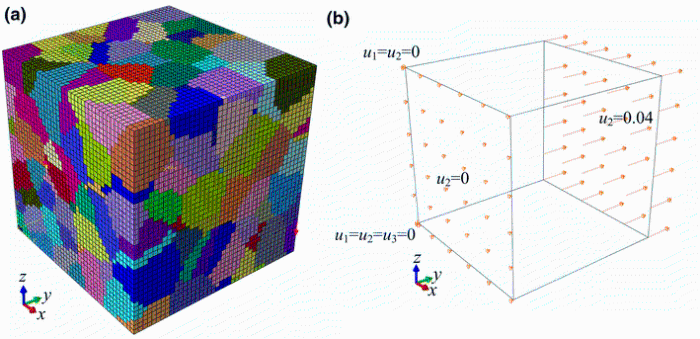
The polycrystal model generated by 3D-CA is then converted into ABAQUS using a script to modify the INP file, as shown in Fig. 2a. It can be seen that the surfaces of FE model are exactly the same as to the surfaces generated by CA (Fig. 1). The dimensions of the work piece are 150 μm × 150 μm × 150 μm. The FE model contains 40 × 40 × 40 C3D8 type (8 nodes full integration solid elements) elements. To simulate the tensile deformation process, boundary conditions are applied to the model referring to works conducted by Choi et al. [25] and Phan et al. [26] and deformation along the y axis is applied, as shown in Fig. 2b.
Fig. 2 3D FE mesh of the polycrystal microstructure: a the applied boundary conditions, b in the simulation
Intense texture is usually formed in FSS sheets after processing. To model the texture characterization more accurately, the actual orientations of the grains are being assigned to the model. The material used in this work is commercial 17%Cr FSS sheet with the thickness of 0.59 mm. The sheet is in cold rolling and annealing state. After mechanical and electrical polishing, the micro-texture of the specimen was detected at the center plane using EBSD.
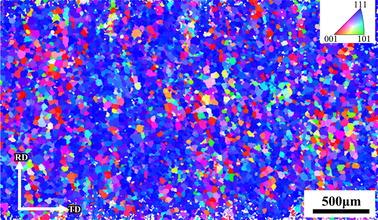
Figure 3 shows the distribution of micro-texture in the center layer of the FSS specimen analyzed by EBSD with a step of 5 μm in the large area of 3000 μm × 2000 μm. The individual orientations are color coded according to their crystallographic direction along the ND. And the color code (standard triangle) is given as an inset.
Fig. 3 EBSD orientation maps of the FSS sheet at the center layer
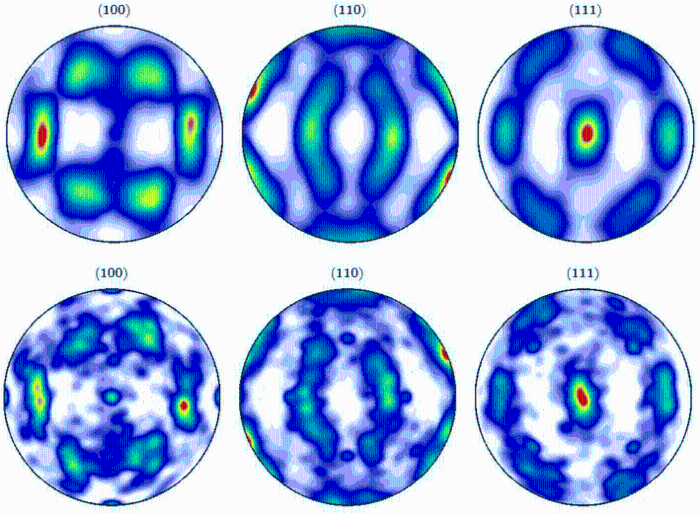
A program was established to select the orientations from the EBSD data. Four hundred orientations are selected from the EBSD data. The pole figures of the original EBSD data and the selected 400 grain orientations are calculated using a MATLAB toolbox MTEX, as shown in Fig. 4. Intense {111}//ND-γ fiber texture was formed after cold rolling and annealing with a few fraction of {110}//RD-α fiber texture. By comparison, it can be seen that the original EBSD data and the selected 400 orientations have similar texture characterizations. This illustrates that the selected 400 orientations can represent the texture characterization of the FSS sheet. Then, these orientations were assigned to the polycrystal geometry model serving as the initial orientations according to the GN.
Fig. 4 Comparison between the texture of the original EBSD data and the texture of the selected grain orientations: a original EBSD data; b the selected 400 grain orientations
An elasto-plastic crystal plasticity model based on the assumption that plastic deformation is the sum of crystalline slip in all activated slip systems was used to investigate the deformation behavior of FSS polycrystals. The crystal plasticity constitutive model is implemented into the implicit finite element code ABAQUS/Standard by using the user material subroutine (UMAT). The functions of the UMAT are to provide the material Jacobian matrix, \({{\partial \Delta \sigma } \mathord{\left/ {\vphantom {{\partial \Delta \sigma } {\partial \Delta \varepsilon }}} \right. \kern-0pt} {\partial \Delta \varepsilon }}\), for the constitutive model and to update the stresses and solution dependent state variables (SDVs).
The total deformation gradient (F) is decomposed into a plastic deformation (Fp) and a combination of elastic deformation and rigid body motion of the crystal lattice (Fe) [9], i.e.,
$${{F}} = {{F}}^{\text{p}} {{F}}^{\text{e}} .$$ (2)
The plastic part (Fp) represents the cumulative effect of dislocation motion on active slip systems. In case of dislocation slip as the only deformation process, the evolution of the plastic velocity gradient (Lp) can be formulated as sum of the shear rates on all slip systems [10].
$${{L}}^{\text{p}} = \dot{{F}}^{\text{p}} {{F}}^{{\text{p} - 1}} = \sum\limits_{\alpha = 1}^{n} {\dot{\gamma }^{\alpha } {{m}}^{\alpha } \otimes {{n}}^{\alpha } } ,$$ (3)
where vectors \({{m}}^{\alpha }\) and \({{n}}^{\alpha }\) are unit vectors describing the slip direction and the normal direction to the slip plane of the slip system \(\alpha\), respectively, \(\dot{\gamma }^{\alpha }\) is the shear rate on the same slip system, and \(n\) is the number of active slip systems.
For a rate-dependent slip, the plastic shear rate on the \(\alpha th\) slip system, \(\dot{\gamma }^{\alpha }\), subjected to the resolved shear stress \(\tau^{\alpha }\) at a slip resistance \(\tau_{c}^{\alpha }\) can be obtained as follows [9]:
$$\dot{\gamma }^{\alpha } = \dot{\gamma }_{0} \left| {\frac{{\tau^{\alpha } }}{{\tau_{c}^{\alpha } }}} \right|^{{\frac{1}{m}}} \text{sgn} (\tau^{\alpha } ),$$ (4)
where \(m\) represents the rate sensitivity of slip. The influence of any set of slip system, index \(\beta\), on the hardening behavior of a (fixed) slip system \(\alpha\) is given by [5]:
$$\tau_{c}^{\alpha } = \sum\limits_{\beta = 1}^{n} {h^{\alpha \beta } \left| {\dot{\gamma }^{\beta } } \right|} ,$$ (5)
where \(h^{\alpha \beta }\) is n × n hardening matrix. Several phenomenological models have been developed to calculate the hardening matrix. Pierce et al. used the following simple form for the hardening law [27].
$$h^{\alpha \beta } = [q + (1 - q)\delta^{\alpha \beta } ]h^{\beta } ,$$ (6)
where \(h^{\beta }\) is the self-hardening rate and the parameter \(q\) is the latent hardening parameter. The self-hardening rate, \(h^{\beta }\), can be obtained by [27]
$$h^{\beta } = h(\gamma ) = h_{0} \text{sech}^{2} \left| {\frac{{h_{0} \gamma }}{{\tau_{s} - \tau_{0} }}} \right|,$$ (7)
where \(h_{0}\) is the initial hardening modulus, \(\tau_{0}\) is the yield stress, \(\tau_{\text{s}}\) is the stage I stress, and \(\gamma\) is the cumulative shear strain on all slip system.
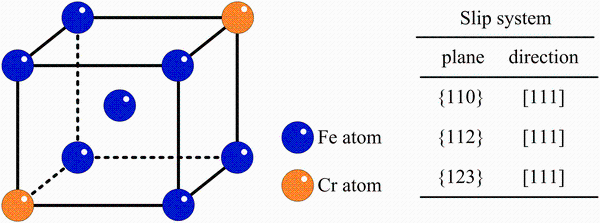
The slip of dislocation is the main plastic deformation mechanism for FSSs. As body-centered cubic (bcc) crystal, FSS crystal has 48 slip systems as compared to the 12 slip systems of face-centered cubic (fcc) crystals. The slip planes in bcc structure are the {110},{112},{123} planes, and the slip directions are <111> in all cases. Figure 5 shows the slip systems in FSSs. The plastic slip is generally occurred in {110} and {112} slip planes. The {123}[111] slip systems is only promoted with substitution impurities [5, 19, 20, 28, 29]. Thus, the {110} and {112} slip planes are considered as the potential slip systems in the crystal plasticity analysis.
Fig. 5 Reduced-sphere bcc unit and slip system for the FSSs with bcc structure
In FSSs, iron contains about 10%-30% substitution Cr atoms. It is reported that the Cr atoms would affect some of the slip planes in bcc metals, resulting in the increment of the slip resistance for certain slip planes. Yazawa et al. have reported that the addition of Cr would suppress the slip on {112} planes, i.e., the slip resistances for the different slip plans are different [8].
Standard tensile specimens according to the JIS-5 were machined from the 17%Cr FSS sheets. The thickness of the sheet is 0.59 mm. The gage length and the width of the specimen are 50 and 25 mm, respectively. True strain-stress curves are obtained.
The material parameters used for the CPFEM analysis are listed in Table 1. The elastic constants, hardening matrix parameters, strain rate sensitivity are referred to the CPFEM simulations of 17%Cr FSS conducted by Raabe and Roters [20, 21]. As mentioned earlier, the addition of Cr atom suppress the movement of {112}[111] slip systems. Thus, the initial hardening modulus, yield stress and the stage I stress in the {112}[111] slip systems are supposed to be higher than those in the {110}[111] slip systems. \(\dot{\gamma }_{0}\) = 0.001 s-1 was used as reference value for the slip rate in the formulation.
Table 1 Material parameters used in the CPFEM constitutive model
| Parameters | \(C_{11}\) (GPa) | \(C_{12}\) (GPa) | \(C_{44}\) (GPa) | \(h_{0}\) (MPa) | \(\tau_{\text{s}}\) (MPa) | \(\tau_{0}\) (MPa) | \(q\) | \(q_{1}\) | \(m\) | \(\dot{\gamma }_{0}\) (s-1) |
|---|---|---|---|---|---|---|---|---|---|---|
| {110}[111] | 230.1 | 134.6 | 116.6 | 180 | 148 | 65 | 1 | 1.4 | 0.1 | 0.001 |
| {112}[111] | 230.1 | 134.6 | 116.6 | 300 | 150 | 100 | 1 | 1.4 | 0.1 | 0.001 |
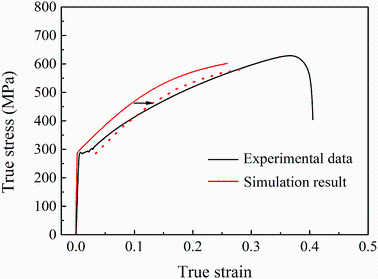
To evaluate the validity of the established model, the true stresses and strains along the tension direction of the top surface of the geometry model (1600 elements in total) were exported and averaged. And the calculated stress-strain response is compared to the experimental one, as shown in Fig. 6. The yield stress calculated by CPFEM is almost equal to the experimental value. But the upper and lower yield phenomena observed in the experiments were not reproduced in the simulations.
Fig. 6 Comparisons between the stress-strain responses of the simulation result and experimental one
The origin of the yield stage is known to be associated with the interstitial atoms and their interactions with dislocations. Liu et al. [30] have reported that the correlation between yielding behavior and precipitation in ultra purified FSSs. Even for the high purified FSSs, there still exist dissociative C and N interstitial atoms. These interstitial atoms form the Cottrell atmosphere, causing the yielding during plastic deformation. By addition of Nb and proper adjusting the cooling rates after annealing, the precipitations Nb(C,N) can be formed to eliminate the dissociative C and N atoms, resulting in continuous hardening behavior instead of Lüders elongation yielding phenomenon for FSSs during tensile test.
The simulation is based on continuum assumptions and does not consider the interactions of dislocations with impurities. As a result, there are no upper and lower yield points in the simulation stress-strain curve. Nevertheless, the calculated stress-strain behavior after yield agrees relatively well with the measured data. So, it is believed that the established CPFEM polycrystal model represents the deformation behavior of FSSs properly. The simulation results confirmed that the slip resistance of {112}[111] slip systems is higher than that in the {110}[111] slip system.
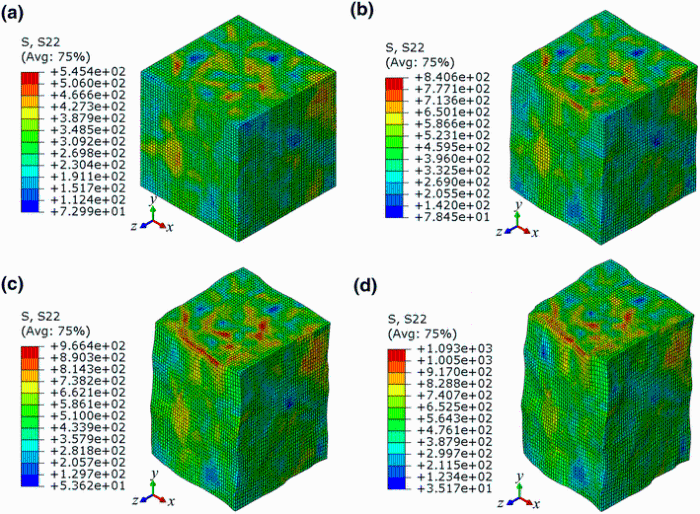
Figure 7 shows the evolution of stress component along the tensile axis at different strains. It can be seen that the distribution of stress is inhomogeneous at grain scale. At the initial tensile period, the stress is mainly accumulated at grain boundaries. With increasing deformation strain, the stress increases. But, the maximum stress increases slightly after the strain higher than 9%. This is caused by multi-slip mechanisms of bcc crystals. When the slip resistance reaches a critical value for certain slip systems, another set of slip system can be activated. And some areas with relatively lower stresses also still exist.
Fig. 7 Evolution of stress along the longitudinal direction at different elongation states: a 1%, b 9%, c 18%, d 26.7%
Regarding the value of stress in Fig. 7, some regions with the max stress in red color mainly accumulate at the top surface. This is likely caused by the constraints of the boundary conditions. However, the stresses in most of the regions, which is colored in blue or green, are less than 740 MPa. In the investigation of deformation behavior of iron single crystals conducted by Keh., it is reported that the max resolved shear stress of iron single crystals can reach 800 kg/cm2 (about 80 MPa) [31]. Patra et al. [32] and Lim et al. [33] also reported that the stress of α-Fe at room temperature is less than 160 MPa. It indicates that due to the solution strengthening effect of Cr atoms, the strength of FSSs is higher than α-Fe. This result is consistent with the tensile results (see Fig. 6).
Figure 8 shows the evolution of plastic strain at different strains. The grains possess different strains after tensile deformation, making the surface morphology unflattened . This illustrates the formation of surface ridging at some extents. Just due to the different plastic strains of the grains during plastic deformation, when a certain quantity grains with similar orientations accumulate together, the surface ridging formed. Compared with Fig. 7, it is found that the areas with low plastic strains possess low Mises stresses.
Fig. 8 Evolution of plastic strain at different elongation states: a 1%, b 9%, c 18%, d 26.7%
The inhomogeneous distributions of stresses and strains are related to the Schmid factor of the grains. The ferrite grains have orientations that assigned before the calculation. The Schmid factor can be calculated by \(S = \user2{m} \otimes \user2{n}\). The vectors m and n have been illustrated in Eq. 3. During the tensile deformation process, the grains with big \(S\) have higher resolved stress \(\tau\), making these grains easy to slip. On the contrast, the grains with small \(S\) are more difficult to slip. This makes the FSS polycrystal show inhomogeneous stress and strain distributions after deformation.
After cold rolling and annealing, the FSS sheets preserve intense γ fiber texture and α fiber texture, as shown in Figs. 3 and 4. Four grains with typical orientations were selected to investigate the relations between the orientations and the plastic deformation behaviors. The (111) pole figures of the selected grains are shown in Fig. 9. And the orientations of these grains are listed in Table 2. Grains No. 1-3 possess γ fiber texture. And grain No. 4 has the α fiber texture, in which \((001) < 2\bar{3}0 >\) has a \(12.6^\circ [23\bar{4}]\) relation with \((001) < 1\bar{1}0 >\).
Fig. 9 (111) pole figures of the selected grains
Table 2 Orientations of the selected grains
| Grain No. | Euler angles | Miller indices |
|---|---|---|
| 1 | (54.24, 52.11, 44.83) | \((111) < 0\bar{1}1 >\) |
| 2 | (176.66, 51.98, 48.25) | \((111) < \bar{1}10 >\) |
| 3 | (263.66, 51.89, 40.57) | \((111) < 12\bar{2} >\) |
| 4 | (11.6, 7.05, 43.57) | \((001) < 2\bar{3}0 >\) |
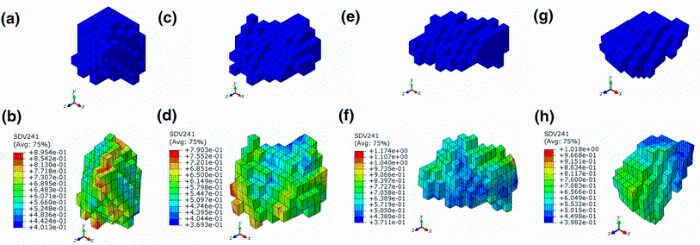
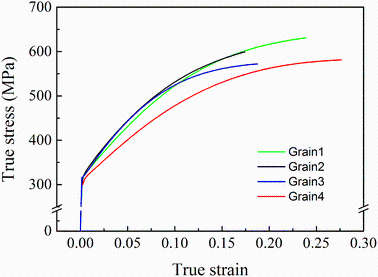
Figure 10 shows the morphologies and plastic strain distributions of the selected four grains before and after tensile deformation. The corresponding stress-strain responses during deformation are shown in Fig. 11. The selected grains have similar stress-strain behaviors. The grain No. 1 and grain No. 2 have exactly same stress-strain response. This indicates that similar orientations preserve same stress-strain responses during plastic deformation. But the total strain of the grain No. 1 is much higher than that of the grain No. 2. This may be caused by the interactions from the adjacent grains. The neighbor grains suppress the elongation deformation of grain No. 2. It demonstrates that the deformation behaviors of polycrystal is not only related to the orientations but also to the interactions caused by adjacent grains [13]. Grain No. 3 has similar stress-strain response to the Grain No. 1 at low strains. When the strains become higher, the stress of Grain No. 3 is a litter less than that of Grain No. 2.
Fig. 10 Morphologies and plastic strain distributions of the selected grains before and after tensile deformation: a, b Grain No. 1; c, d Grain No. 2; e, f Grain No. 3; g, h Grain No. 4
Fig. 11 Stress-strain responses of the selected grains during deformation
By comparison, the Grain No. 4 with α fiber texture has the highest total strain and the lowest stress. From Fig. 10h, it can been seen that the Grain No. 4 shrinks relatively higher along the x direction than others. The \(\left\{ {001} \right\}[110]\) grains are supposed to shrink more in the thickness direction than other grains in the surface ridging models [15-17]. The differences of thickness shrinks for the grain colonies cause the occurrence of surface ridging. So, the CPFEM simulation results agree relatively well with this. Moreover, it should be pointed out that the plastic deformation of grains is greatly affected by the interactions from neighboring grains. The surface ridging is caused by the accumulated effects of numbers of grains at macro-scale. Nevertheless, the CPFEM simulation in this work is capable for capturing the deformation behavior of FSS polycrystal at mesoscale.
A CPFEM model has been developed to simulate the plastic deformation of FSS polycrystal. The polycrystal microstructure was generated using 3D-CA approach. And the actual orientations of FSS cold rolling and annealing sheets were detected by EBSD and incorporated to the CPFEM model. The main conclusions are as follows.
1. A series of material parameters are selected for the simulation. The slip resistance of {112}[111] slip systems is supposed to be higher than that in the {110}[111] slip system. The true stress-strain response of the simulation by CPFEM agrees well with the experimental one. Due to the lack of considering the interactions of dislocations with impurities, there are no upper and lower yield points in the simulation stress-strain curve.
2. Because of the different orientation preserved in grains, the local stress field and strain field of the polycrystal show inhomogeneous at mesoscale.
3. The plastic deformations of the grains with typical orientations have been characterized. The grains with α fiber texture show higher thickness reduction ratio as compared to others. The deformation behaviors of the grains in polycrystal are not only related to the orientations but also to the interactions from adjacent grains.
This work was supported by the National Natural Science Foundation of China (No. 51604058), the Fundamental Research Funds for the Central Universities of China, the Scientific Research Fund of Liaoning Provincial Education Department under Grant No. L2015120, the Open Research Fund from the State Key Laboratory of Rolling and Automation, Northeastern University, China.
The authors have declared that no competing interests exist.

 WeChat
/
| 〈 |
|
〉 |

