


Electricity Production in Microbial Fuel Cell Subjected to Different Operational Modes
[Hong-Yan Dai1, 2 , Hui-Min Yang1 , Xian Liu1 , Xuan Jian1 , Zhen-Hai Liang1  ]
]
]
|
|


The effects of inoculum species, substrate concentration, temperature, and cathodic electron acceptors on electricity production of microbial fuel cells (MFCs) were investigated in terms of start-up time and power output. When inoculated with aeration tank sludge, this MFC outperformed the cell that was inoculated with anaerobic sludge in terms of start-up time and power output. After running for a certain time period, the dominant populations of the two MFCs varied significantly. Within the tested range of substrate concentration (200-1800 mg L-1), the voltage output increased and the time span of the electricity generation lengthened with increasing substrate concentration. As the temperature declined from 35 to 10 °C, the maximum power density reduced from 2.229 to 1.620 W m-3, and anodic polarization resistance correspondingly dropped from 118 to 98 Ω. The voltage output of MFC-Cu2+ was 0.447 V, which is slightly lower than that achieved with MFC-[Fe(CN)6]3- (0.492 V), thereby indicating that MFCs could be used to treat wastewater containing Cu2+ pollutant in the cathode chamber with removal of organics in anode chamber and simultaneous electricity generation.
With the dwindling of fossil fuels and aggravation of global environmental pollution, the demand for renewable clean energy is sharply increasing [1, 2]. The microbial fuel cell (MFC), an innovative device that can generate electricity and treat organic wastewater at the same time, has been attracting much attention in past 10 years [3, 4, 5]. In the initial stage, the electric production efficiency of MFC is extremely low at a few milliwatts per square meter [6]. Most of the works were conducted to promote the performance of MFC (mainly power output) during the last decade. Numerous operating parameters, such as microbial activity [7], the type and concentration of organic matter [8], temperature [9], pH value [10], electrode materials [11, 12], cathodic electron acceptors [13, 14], and internal resistance[15, 16], affect the power output.
As inocula of MFC, mixed microbial communities outperform pure cultures because of their stability, excellent adaptability to the environment, and synergistic effect between microbial species [17]. Moreover, the performance varied among MFCs inoculated by mix cultures from different sources or different sampling locations of the same effluent [18]. Numerous researchers used anaerobic microorganisms as inocula of MFCs, and aerobic microorganisms were rarely used as inocula in this regard.
In addition, the cathodic electron acceptor is another important parameter that influences the power output of MFCs. Oxygen has been widely used as an electron acceptor in most MFCs because of its high redox potential and unlimited availability. However, poor oxygen reduction kinetics restricts the performance of the oxygen cathode, and expensive catalysts are conventionally required (e.g., platinum-based catalysts). Potassium ferricyanide is another widely used as an electron acceptor in dual-chamber MFCs, but the use of this acceptor will incur an increase in cost and induce environment pollution. Therefore, long-term use of potassium ferricyanide as cathodic electron acceptor in MFCs is unrealistic [19]. Some heavy metals, such as hexavalent chromium (Cr(VI)), pentavalent vanadium (V(V)), tetravalent selenium (Se(IV)), bivalent copper (Cu(II)), bivalent mercury (Hg(II)), and univalent silver (Ag(I)), from mining and metallurgical wastewaters and leachates possess high redox potential. When used as cathodic electron acceptors in dual-chamber MFCs and reduced at the cathode chamber, these heavy metals are removed from waste streams[20] and recycled.
In this study, the effects of four factors on the performance of MFCs were investigated in terms of start-up time and power output. The four factors included the following: (1) two inoculum species, namely, anaerobic microorganisms and aerobic microorganisms; (2) five concentrations of sodium acetate (NaAc); (3) different temperature levels (35 and 10 ° C); and (4) two kinds of electron acceptors: K3[Fe(CN)6] and CuCl2. This study aims to clarify relevant factors and optimize the performance of MFCs.
A dual-chamber MFC composed of two glass bottles was used in this study. The bottles, which contained 90 mL operating volume each, served as the anode and cathode chambers. The bottles are connected by sidearms and separated by a cation exchange membrane (4.5 cm2, JCM-II, Yanrun membrane Co., Ltd., Beijing, China). The anode was carbon felt (2 cm × 4 cm × 1 cm), while the cathode was a stainless steel mesh (2 cm × 4 cm; Fe, 70.6%; Cr, 18.3%; Ni, 8.5%; Si, 0.8%; Mn, 1.8%; wire diameter, 120-150 μ m; and pore size, 450-525 μ m). Electrodes were connected with concealed copper wire, and an external load resistance (1000 Ω ) was linked to the circuit. The Ag/AgCl reference electrode (+0.197 V vs. SHE) was inserted into the chamber for measuring electrode potential.
The aeration tank sludge and anaerobic sludge used as inoculum species were collected from the Yangjiapu wastewater treatment plant for municipal sewage in Taiyuan, China. Prior to inoculation into MFC, the microbes were cultured anaerobically for 2 days. Then, 20 mL inocula and 60 mL anolyte were poured into the anode chamber. The aeration tank sludge was inoculated into MFC-A, and the anaerobic sludge was inoculated into MFC-B. The anolyte was prepared as follows: 1300 mg NaAc (except for the substrate concentration test), 130 mg KCl, 310 mg NH4Cl, 6640 mg NaH2PO4· 2H2O, 20, 640 mg Na2HPO4· 12H2O, and 2 mg NaCl were dissolved in distilled water. Then 20 mL trace mineral element solution was poured into the solution. Finally, the solution was diluted to 1 L. To prepare the catholyte, 5844 mg NaCl and 32, 925 mg K3[Fe(CN)6] (except for the electron acceptor test)were dissolved in distilled water, and then the solution was diluted to 1 L. All MFCs were operated in fed-batch mode in a temperature-controlled chamber at 35 ° C, except for the temperature test. The device was not stirred during the entire experiment, and sludge settled at the bottom of the anode chamber. As the voltage output of MFCs was below 0.05 V, the catholyte was replaced completely, and 60 mL of anode supernatant was replaced.
The voltage of the MFC across a 1000 Ω external resistor (ZX21A, Zhengtao instrument Co., Shanghai, China) was recorded every 30 min with a multimeter (UNI-T 803; Uni-Trend Electronics Co., Ltd., Shanghai, China). Polarization curves were obtained by varying the external resistance over a range from 10 000 to 20 Ω when the voltage output approached a steady and repeatable state. Current density (IV) and power density (PV) were obtained according to the formula IV = E/RV and PV = EI/V, where E is the voltage output, R is the external resistance, I is the current, and V is the working volume of the cathode chamber. Electrochemical impedance spectroscopy (EIS), which was used to characterize electrochemical capability, was performed in an electrochemical workstation (Princeton Applied Research, USA) with a three electrode system consisting of a working electrode (bioanode), a counter electrode (cathode), and a reference electrode (Ag/AgCl). EIS tests were conducted under the condition of open circuit voltage with a potential amplitude of 10 mV over a frequency range of 100 kHz-10 mHz.
The surface morphologies of bioanode were observed by a thermal field emission scanning electron microscope (SEM, JSM-7001F, JEOL, Japan). First, a small piece of carbon felt was cut off from bioanode using scissors. Second, the samples were fixed with a 2.5% glutaraldehyde in 0.1 mol L-1 phosphate buffer for 1.5 h at 4 ° C and washed using a 0.1 mol L-1 phosphate buffer solution. Third, the fixed specimens were gradually dehydrated with ethanol 30, 50, 70, 80, 90, 100% solutions (each for 15 min) and CO2 critical point dried. Finally, the specimens were coated with Au before SEM observation. The SEM measurement was taken at 10 keV acceleration potential. Anodic microbial species were identified by high-throughput-macro genome sequencing technology. First, the anode carbon felt was rinsed with deionized water to remove the residual sludge. Then, the top, middle, and bottom sections of the anode were cut, fragmented, and mixed for DNA extraction[21]. Total genomic DNA was extracted by using EZNA Soil DNA Kit according to the manufacturer’ s instruction. The quantity and quality of extracted DNA were checked using Qubit2.0 DNA detection kit. The V3-V4 region (length of 464 bp) of the bacterial 16S rRNA gene was amplified using the universal primers 341F (5’ -CCTACGGGNGGCWGCAG-3’ ) and 805R (5’ -GACTACHVGGGTATCTAATCC-3’ ). High-throughput-macro genome sequencing was carried out according to standard protocols. To analyze the microbial community structure and bacterial diversity, we phylogenetically allocated sequences down to the genus level by using the RDP Classifier software.
The elemental composition of deposits covered on the stainless steel mesh cathode was measured using SEM equipped with an auxiliary X-ray energy-dispersive spectrometry (EDS, QUANTAX 200, Germany). The EDS measurement was taken at 15 keV acceleration potential.
Microorganisms possess a variety of enzymes that catalyze specific reaction in biological systems. Certain electrochemically active redox enzymes, such as cytochromes, can transport electrons to external materials [22]. Many microorganisms existing in the mix culture possess the electrochemically active redox enzymes and could be used as inoculum species of mediator-less MFC. However, the electrogenesis capacity of the mix culture varies among different sources. In order to examine the electricity generation by different mixed microbial communities, aeration tank sludge and anaerobic sludge were, respectively, inoculated to identical MFCs (MFC-A for aeration tank sludge and MFC-B for anaerobic sludge) to test the start-up time and the power output. Start-up time is the required time for MFCs to reach a stable voltage during start-up. Despite that the same volume of inocula was inoculated into the MFCs, the start-up times of the two MFCs were different. The start-up time of MFC-A, which used aeration tank sludge as inoculum, was 10 days. This duration was shorter than that of MFC-B (14 days), with anaerobic sludge as inoculum. After the second replacement of the anolyte and catholyte, the voltage output of all MFCs increased. The maximum voltage output values obtained with a fixed resistance of 1000 Ω during the start-up period were 0.4 V (MFC-A) and 0.31 V (MFC-B).
Polarization data obtained after the start-up period show that different maximum power densities could be produced as a result of different inoculum species (Fig. 1). The maximum power density of 2.229 W m-3 produced by MFC-A was higher than that produced by MFC-B (1.201 W m-3). According to Ohm’ s law, as the internal resistance equaled the external resistance, the maximum power output is obtained [23], and the power density reaches a peak on the curve. As seen in Fig. 1, the internal resistance of MFC-A as calculated from polarization curves was 800 Ω . The internal resistance of MFC-B was 1000 Ω , which was 200 Ω higher than that of MFC-A. Under different bacterial inoculation conditions, the anode resistance is the major factor that affects the whole MFC internal resistance. The aeration tank sludge as inoculum resulted in the reduction in anode internal resistance and the consequent increase in power output in comparison with anaerobic sludge.
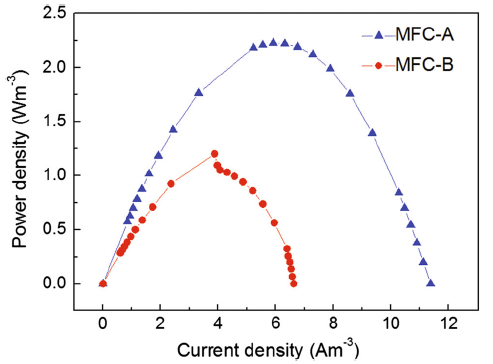 | Fig. 1 Power density curves of MFCs inoculated by different microbials (MFC-A for aeration tank sludge and MFC-B for anaerobic sludge). Polarization curves were obtained by varying the external resistance over a range from 10, 000 to 20 Ω |
Anodes were removed after operating for 2 months. Surface morphologies were observed under a scanning electron microscope, and the microbial species were measured by high-throughput-macro genome sequencing technology, which could provide significant insight into the microbial community structures in bioelectrochemical systems (Fig. 2).
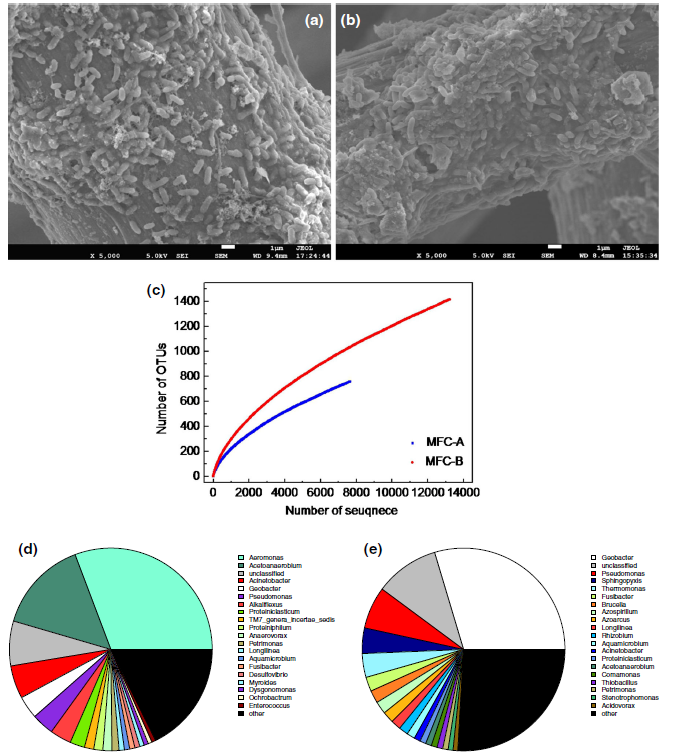 | Fig. 2 SEM micrographs (a for MFC-A and b for MFC-B). Rarefaction curves c and the taxonomic classification of pyrosequences from bacterial communities at genus level (d for MFC-A and e for MFC-B). The OTUs were defined 3% distances |
As seen in Fig. 2a, b, the anode carbon felts of MFCs were covered by rod-shaped bacteria regardless of which mix culture was inoculated into MFCs. The rod-shaped bacteria were approximately 0.3-0.5 μ m in width and 1.0-1.5 μ m in length. Moreover, bacteria appeared as individual cells without substantial extracellular material, and all cells were in actual physical contact with the electrode.
Richness analysis using 16S rRNA gene-based high-throughput sequencing was shown in Fig. 2c. We obtained 760 (MFC-A) and 1417 (MFC-B) operational taxonomic units (OTUs) at a 3% distance. The total numbers of OTUs estimated by Chao1 estimator were 2037 (MFC-A) and 3243 (MFC-B), indicating that MFC-B had the greatest richness than MFC-A. The Shannon index of MFC-B (4.97) was also larger than 4.14 in MFC-A. Compared with other MFCs which were fed complex substrates [24], the biodiversity of MFC-A and B was lower, because both of them used NaAc as the substrate.
Community analysis shows that the two communities present an extremely high diversity (Fig. 2d, e). In MFC-A, the majority of dominant populations belonged to Aeromonas (30.75%) and Acetoanaerobium (14.73%), whereas these two kinds of bacteria accounted for only 0.28% and 0.94% in MFC-B, respectively. Aeromonas are facultative anaerobic microorganisms, and Acetoanaerobium are anaerobic bacteria. Though it is not clear their specific function, they might have contribution to electricity generation in MFCs. Geobacter [25] and Pseudomonas [18], which are well-known exoelectrogenic bacteria, occupied 3.63% and 3.54% in MFC-A, respectively. In MFC-B, Geobacter (29.62%) and Pseudomonas (6.73%) were the dominant populations. Shewanella[26], another well-known exoelectrogenic bacteria, only occupied 0.13% in MFC-A and was not found in MFC-B. In addition, 7.42% (MFC-A) and 10.03% (MFC-B) were not classified at the genus level, indicating that these bacteria are unknown. Thus, numerous kinds of bacteria in nature possess electronic activity, and exoelectrogenic bacteria vary because of different sources.
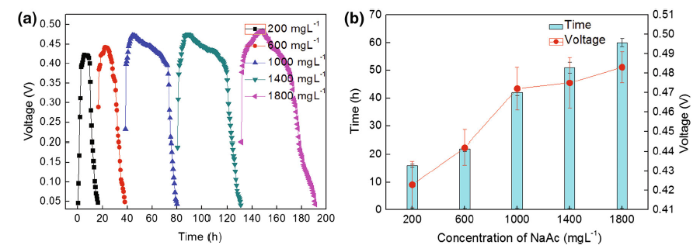
The substrate concentration plays an important role in controlling the performance of MFCs. To study the effect of substrate concentration on the power output, a series of substrate concentrations ranging from 200 to 1800 mg L-1 were tested in MFC-A in terms of voltage output and the time span of electricity generation. The time span is the time interval between the twice replacements of anolyte and catholyte. The same operations were repeated thrice to ensure that a stable trend was achieved.
The experimental results are presented in Fig. 3. It could be seen from Fig. 3a, b, voltage output increased, and the time span of electricity generation increased with increasing substrate concentration. As the concentration increased within a low range (≤ 1000 mg L-1), the maximum voltage output and time span of electricity generation increased drastically. Meanwhile, at high concentration (> 1000 mg L-1), the maximum voltage output and time span of electricity generation experienced a moderate increase with increasing concentration. For instance, when the concentration of NaAc was 200 mg L-1, the maximum voltage output was only (0.423 ± 0.012) V. After (16 ± 0.5) h, the voltage output decreased to below 0.05 V. As the concentration of NaAc increased to 1000 mg L-1, the maximum voltage output and time span of electricity generation were (0.472 ± 0.011) V and (42 ± 1) h, respectively. Meanwhile, the maximum voltage output [(0.483 ± 0.008) V] and the longest time span of electricity generation [(60 ± 1.5) h] were obtained at a concentration of 1800 mg L-1. According to the results obtained by other researchers, when the substrate concentration increases in the low concentration range, the power output exhibits a significant increase, whereas a decrease in power output is observed as the substrate concentration reaches a certain amount[27]. In this study, the phenomenon of voltage drop did not appear because the substrate concentration did not reach the amount.
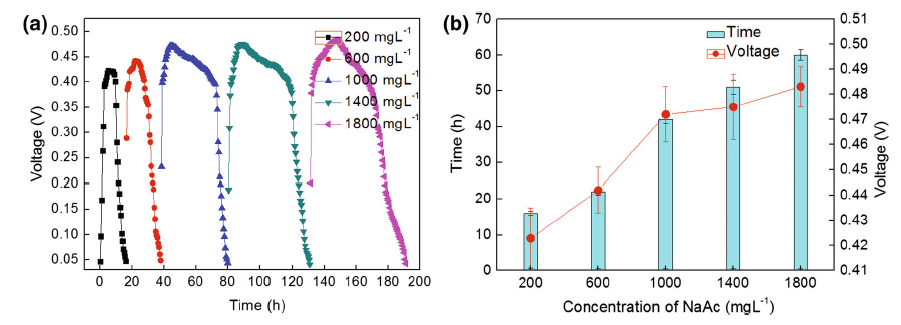 | Fig. 3 a Discharge curve of MFC with different NaAc concentrations (200, 600, 1000, 1400, 1800 mg L-1). b The maximum voltage output and time span of electricity generation of MFCs with different NaAc concentrations. A load resistor is 1000 Ω . The measurements were taken in triplicate and treated statistically |
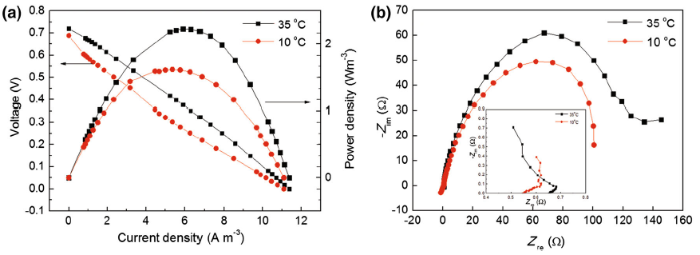
The temperature strongly influenced the performance of MFCs because of the following explanations: (1) The nature and distribution of the microbial community are influenced by temperature (the optimum temperatures for different species varied); (2) the electrode potentials and the free Gibbs energy of reactions are influenced by temperature; (3) the activation energy, mass transfer coefficient, and conductivity of the solution are under the influence of temperature, as well[28]. To date, the great majority of MFC studies have been conducted at temperatures between 20 and 35 ° C, with the actual operation temperature being selected according to the respective laboratory standard. In this study, after starting up at 35 ° C, two identical MFCs were operated at different operation temperature values. One MFC was still operated at 35 ° C, whereas the other operated at 10 ° C. When the voltage was approximately constant at each temperature, polarization and EIS were carried out. The results for MFCs are illustrated in Fig. 4.
 | Fig. 4 Performance of MFCs at different reactor temperatures (35 and 10 ° C): a polarization curves and power density curves; b Nyquist plots for anodes. The insert illustrates the high-frequency part of the result. EIS tests were conducted under the condition of open circuit voltage with a potential amplitude of 10 mV over a frequency range of 100 kHz-10 mHz |
In general, microbial metabolism and membrane permeability are enhanced with a moderate temperature increase [29]. Consequently, the performance of MFCs would be improved. Figure 4a compares the polarization curves obtained from MFC-35 and MFC-10 ° C, respectively. It was found that with decreasing temperature from 35 to 10 ° C the MFCs showed an insignificant change in open circuit voltage (from 0.72 to 0.689 V) and I max (from 11.375 to 11.1 A m-3). However, the MFC-35 ° C produced a maximum power density of 2.229 W m-3, which is approximately ~1.4 times of that obtained with the MFC-10 ° C (1.620 W m-3).
To better understand the influence of temperature on the MFCs, EIS experiments were conducted for all anodes at the open circuit potential, and the Nyquist plots are shown in Fig. 4b. In the high-frequency region, the intercept of the curve and the real axis could be regarded as ohmic resistance (R ohm), which is affected by the electrode material, wire connection to the external circuit, and the electrolyte [30]. The R ohm values for anode of MFC-35, MFC-10 ° C are approximately 0.65 and 0.55 Ω (inset of Fig. 4b), respectively. In the low-frequency region, the diameter of the semicircle could be regarded as charge-transfer resistance (R ct) occurring at the anode. The R ct for anode of MFC-35 ° C was estimated to be 118 Ω , whereas the value for MFC-10 ° C was 98 Ω , indicating that the anodic resistance decreased by reducing the cell temperature. This conclusion was consistent with that of Liu et al. [31].
The performance of the MFC is improved by using ferricyanide as cathodic electron acceptor[22]. However, K3[Fe(CN)6] is toxic and chemically unstable. When K3[Fe(CN)6] is under acidic condition, poisonous hydrocyanic acid could be produced. Therefore, the operation with K3[Fe(CN)6] solution in MFC presents potential safety risks. In general, substances with high redox potential could be used as cathodic electron acceptors in MFC. Certain heavy metal ions that are sourced from mining and metallurgical wastewaters possess high redox potential. The standard electrode potential of Cu2+/Cu is 0.340 V [Eq. (1)], which is slightly lower than that of [Fe(CN)6]3-/[Fe(CN)6]4- [0.430 V, Eq. (2)]. When used as cathodic electron acceptor, Cu2+ could be removed and recycled from wastewater.
$${\text{Cu}}^{2 + } + 2{\text{e}} = {\text{Cu }}E^{ \circ } = \, 0.340\; {\text{V}} . (1)$$
$$\left[ {{\text{Fe}}\left( {\text{CN}} \right)_{6} } \right]^{3 - } +\, {\text{e}}^{ - } = \left[ {{\text{Fe}}\left( {\text{CN}} \right)_{6} } \right]^{4 - } E^{ \circ } = \, 0.430\; {\text{V}} . (2)$$
In this study, two cathodic electron acceptors (K3[Fe(CN)6] and CuCl2) were tested under the same working conditions, i.e., using of aeration tank sludge as inoculum and NaAc (1300 mg L-1) as substrate. The catholytes for two MFCs were prepared as 100 mM K3[Fe(CN)6] + 100 mM NaCl for one (MFC-[Fe(CN)6]3-) and 100 mM CuCl2 + 100 mM NaCl for another (MFC-Cu2+). Throughout the test, pH was not adjusted.
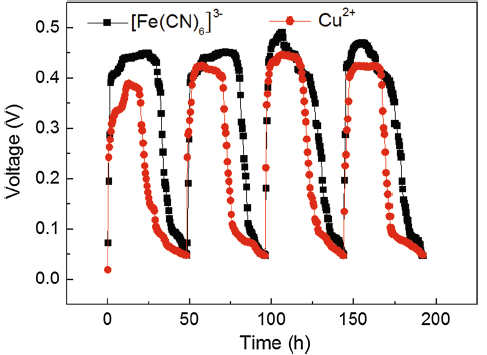
After start-up, anode potentials of the two MFCs were observed to be around (-0.450 ± 0.005) V with respect to the Ag/AgCl reference electrode, indicating that bioelectrocatalytic activity is not influenced by cathodic electron acceptors. The performance of MFCs with different cathodic electron acceptors was evaluated by monitoring voltage output. Figure 5 shows a typical voltage generation profile, as observed in numerous MFC configurations [32]. The voltage output of the two MFCs rapidly increased after anolyte and catholyte replacement, and reached relatively stable values, and eventually dropped because of substrate depletion at the anode chamber (NaAc was almost undetectable in the effluent). The profile was reproducible when fresh substrate was poured into the anode. The MFCs were operated for over 196 h, with insignificant variations in voltage output, suggesting the long-term stability of these systems. MFC-Cu2+ delivered a maximum stable voltage output of 0.447 V, which was slightly lower than that achieved with MFC-[Fe(CN)6]3- (0.492 V). The obtained voltage output was comparable to the results achieved with K3[Fe(CN)6] and other well-performing cathode systems that use oxygen [33]. At the end of the experiment, some reddish-brown sediments were deposited at the cathode surface of MFC-Cu2+. Figure 6 shows the EDS spectrum of the deposits. The Cu content in the deposits is 55.85 at% and the Cl is 44.15 at%, indicating that a fraction of Cu2+ was reduced to Cu. MFCs could be used to treat wastewater containing Cu2+ pollutants in cathode chamber with removal of organics in anode chamber and simultaneous electricity generation.
 | Fig. 5 Voltage output curves of the MFCs with different electron acceptors (Cu2+ and [Fe(CN)6]3-) in closed circuit mode (load resistor is 1000 Ω ) |
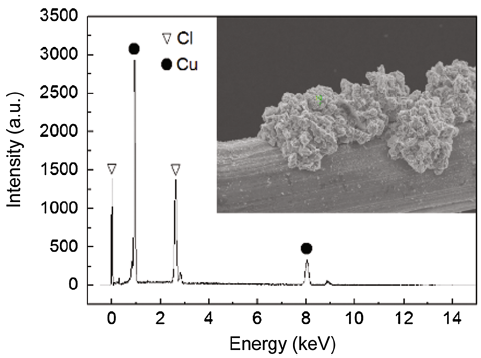 | Fig. 6 EDS spectrum of the deposits on the cathode surface (insert) |
In this study, the effects of four factors (inoculum species, substrate concentration, temperature, and cathodic electron acceptor) on the performance of MFCs were investigated. When the MFC was inoculated with aeration tank sludge, it outperformed the MFC inoculated with anaerobic sludge in terms of start-up time and power output. After operating for a period of time, the dominant populations of the two MFCs varied significantly. The maximum voltage output and the time span of electricity generation showed a moderate increase as the substrate concentration increased. As the temperature decreased from 35 to 10 ° C, the maximum power density decreased from 2.229 to 1.620 W m-3, and anodic polarization resistance correspondingly dropped from 118 to 98 Ω . Using Cu2+ as electron acceptor, the MFC could deliver a maximum stable voltage output of 0.447 V, which was slightly lower than that achieved with MFC-[Fe(CN)6]3-(0.492 V).
This work was financially supported by the National Natural Science Foundation of China and Shenhua Group Corp. (Grant No. U1261103).
The authors have declared that no competing interests exist.
| [1] |
|
| [2] |
|
| [3] |
|
| [4] |
|
| [5] |
|
| [6] |
|
| [7] |
|
| [8] |
|
| [9] |
|
| [10] |
|
| [11] |
|
| [12] |
|
| [13] |
|
| [14] |
|
| [15] |
|
| [16] |
|
| [17] |
|
| [18] |
|
| [19] |
|
| [20] |
|
| [21] |
|
| [22] |
|
| [23] |
|
| [24] |
|
| [25] |
|
| [26] |
|
| [27] |
|
| [28] |
|
| [29] |
|
| [30] |
|
| [31] |
|
| [32] |
|
| [33] |
|