Electricity Production in Microbial Fuel Cell Subjected to Different Operational Modes
|
Electricity Production in Microbial Fuel Cell Subjected to Different Operational Modes |
| Hong-Yan Dai, Hui-Min Yang, Xian Liu, Xuan Jian, Zhen-Hai Liang |
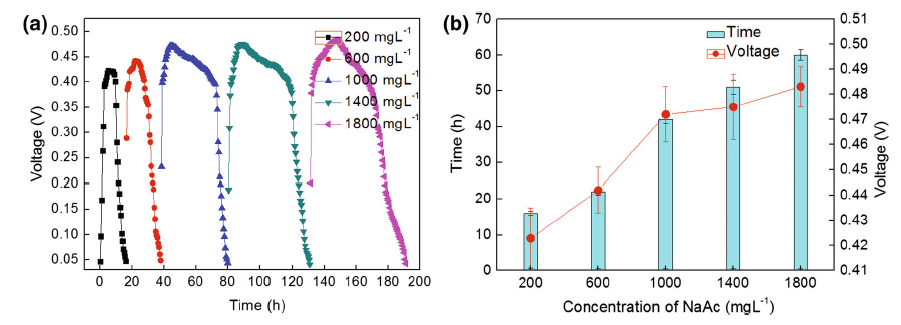
| Fig. 3 a Discharge curve of MFC with different NaAc concentrations (200, 600, 1000, 1400, 1800 mg L-1). b The maximum voltage output and time span of electricity generation of MFCs with different NaAc concentrations. A load resistor is 1000 Ω. The measurements were taken in triplicate and treated statistically |
|
|