Electricity Production in Microbial Fuel Cell Subjected to Different Operational Modes
|
Electricity Production in Microbial Fuel Cell Subjected to Different Operational Modes |
| Hong-Yan Dai, Hui-Min Yang, Xian Liu, Xuan Jian, Zhen-Hai Liang |
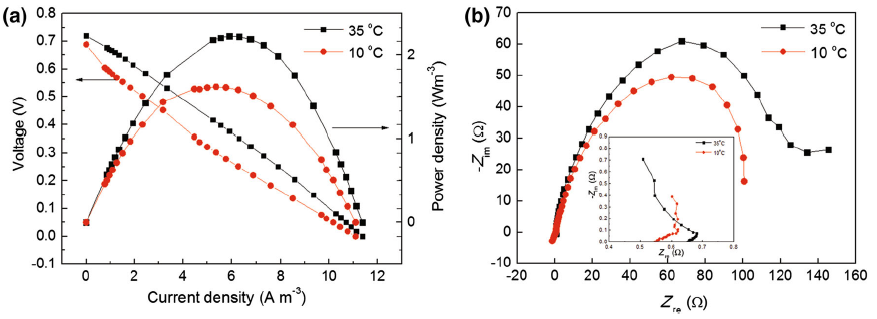
| Fig. 4 Performance of MFCs at different reactor temperatures (35 and 10 °C): a polarization curves and power density curves; b Nyquist plots for anodes. The insert illustrates the high-frequency part of the result. EIS tests were conducted under the condition of open circuit voltage with a potential amplitude of 10 mV over a frequency range of 100 kHz-10 mHz |
|
|