

Intrinsic Strength Asymmetry Between Tension and Compression of Perfect Face-Centered-Cubic Crystals
[R.F. Wang, J. Xu, R.T. Qu, Z.Q. Liu, Z.F. Zhang ]
]
]
|
|


The strength asymmetry between tension and compression is a typical case of mechanical response of materials. Here we achieve the intrinsic strength asymmetry of six face-centered-cubic perfect crystals (Cu, Au, Ni, Pt, Al and Ir) through calculating the ideal tensile and compressive strength with considering the normal stress effect and the competition between different crystallographic planes. The results show that both the intrinsic factors (the ideal shear strength and cleavage strength of low-index planes) and the orientation could affect the strength asymmetry, which may provide insights into understanding the strength of ultra-strong materials.
Usually, materials display different mechanical responses under various loading conditions [1]. Specifically, for some materials, their strength and fracture mode strongly rely on the loading direction, showing an asymmetry between tension and compression (the t/c asymmetry). Materials exhibiting t/c asymmetry include single crystals or polycrystalline materials of face-centered-cubic (fcc) [2, 3, 4, 5, 6, 7, 8], body-centered-cubic (bcc) [8, 9] and hexagonal-close-packed (hcp) [10, 11] structures with different scales of sample or grain size and diverse constituents, metallic glasses [12, 13, 14, 15] and its composites[16], ceramics [1], intermetallics[3, 17, 18], superalloys [19], biological materials [20], graphene [21] and so on. Although such a wide range of material kind, the origin of the t/c asymmetry usually is owing to the pressure dependence of various kinds of defects (dislocations, interfaces, cracks, etc.), the phase transformation [11], and the normal stress or non-Schmid effect [7, 12, 22].
For perfect crystals, t/c asymmetry also exists because the normal stress on the shear plane strongly affects the shear strength. Through first-principle method, Č erný et al. [23, 24, 25] calculated the normal stress (including both the positive and negative directions) effect on the shear strength along a specific shear plane of some perfect crystals. However, the tensile or compressive process, which simulates the experimental loading along an arbitrary crystallographic direction, has not been taken into account. While Tschopp and McDowell [2, 22] calculated the t/c asymmetry of the critical stresses for the occurrence of homogeneous dislocation nucleation in Cu perfect crystal with molecular dynamic (MD) method, the fracture of perfect crystal that homogenously deforms without the aid of dislocations and other defects has not been considered. And neither of the two studies mentioned above is paid attention to the competition between different crystallographic planes, such as the shear of {111} plane and the cleavage of {100} plane, which could lower the tensile strength along some specific loading orientations [26].
In this study, firstly we applied the raw data of ideal cleavage strength and shear strength of six fcc crystals (Cu, Au, Ni, Pt, Al and Ir) with the fracture criterion [27, 28, 29] to calculate the ideal compressive strength along an arbitrary direction. Then, the t/c asymmetry was achieved with the presently obtained ideal compressive strength and the previous results of ideal tensile strength [26]. Finally, the orientation-dependent t/c asymmetries of the studied six crystals are analyzed.
Supposing that a uniaxial stress σ A, tension or compression is performed on a perfect single-crystal specimen [26], then the corresponding normal stress σ and shear stress τ along a certain crystallographic plane could be denoted as
$$\sigma = \sigma_{\text{A}} \cos^{2} \phi , (1)$$
$$\tau = \sigma_{\text{A}} \cos \phi \cos \lambda , (2) $$
where ϕ and λ are the angles between the loading axis and the normal stress direction and the shear stress direction, respectively. When σ A equals the ideal tensile strength σ T or the ideal compressive strength σ C, fracture happens. In order to calculate the ideal strength for loading along an arbitrary crystallographic direction, a universal fracture criterion for high-strength materials, in which both the tensile and compressive normal stress effect are considered, can be employed [26, 29]. According to this criterion, the fracture occurs along a specific plane if satisfying
$$\beta \left( {\frac{\sigma }{{\sigma_{0} }}} \right)^{2} + \left( {\frac{\tau }{{\tau_{0} }}} \right)^{2} = 1, (3) $$
where σ 0 and τ 0 are the ideal cleavage strength of this plane and the ideal shear strength along the shear direction of this plane, respectively, and β is an extrinsic parameter associated with the loading direction. Generally, for compressive loading, β equals -1/2 (the effect of the value of β would be discussed later), while for tensile loading, β equals 1, and Eq. (3) changes into
$$\left( {\frac{\sigma }{{\sigma_{0} }}} \right)^{2} + \left( {\frac{\tau }{{\tau_{0} }}} \right)^{2} = 1, (4)$$
which is the unified tensile fracture criterion [27] and had been used in our previous work [26]. Combining Eqs. (1-3), the ideal tensile strength can be expressed as,
$$\sigma_{\text{T}} = \frac{1}{{\cos \phi_{\text{T}} \sqrt {\frac{{\cos^{2} \lambda_{\text{T}} }}{{\tau_{0}^{2} }} + \frac{{\cos^{2} \phi_{\text{T}} }}{{\sigma_{0}^{2} }}} }}, (5)$$
and correspondingly, the ideal compressive strength can be expressed as,
$$\sigma_{\text{C}} = \frac{1}{{\cos \phi_{\text{C}} \sqrt {\frac{{\cos^{2} \lambda_{\text{C}} }}{{\tau_{0}^{2} }} - \frac{1}{2}\frac{{\cos^{2} \phi_{\text{C}} }}{{\sigma_{0}^{2} }}} }}.(6)$$
Equations (5) and (6) are the general formulas for calculating the ideal tensile strength or compressive strength of perfect crystal with an arbitrary orientation, respectively. Under tensile stress states, both shear fracture and cleavage fracture could happen, which means that the fracture could be mode I or a mixed mode I and mode II, which has been discussed in detail in our previous work [26]. While for compressive stress states, only the shear fracture along {111}< 112> (the twinning direction for fcc crystals) or mode II fracture could happen. Correspondingly, the ideal cleavage strength σ 0 and the ideal shear strength τ 0 of the six fcc crystals are σ 0{111} and τ 0{111}< 112> , respectively, which is collected from the literature [26].
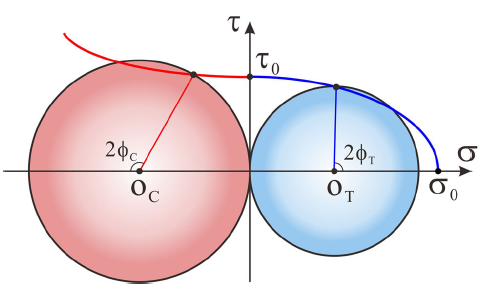
The Mohr’ s stress circle diagram, as shown in Fig. 1, qualitatively describes the fracture strength and the fracture angle under both tensile and compressive stress states. Due to the anisotropy, the fracture angle, which is the angle between loading axis and the normal direction of the weakest fracture plane, is given and not tangent to the failure line. Under compressive stress states, cleavage fracture cannot happen and the normal stress only displays a negative effect on the shear fracture, while under tensile stress state, the normal stress facilitates the shear process. Besides the different effects of normal stress, another difference in the computing process between tensile strength and compressive strength is the selection of fracture systems of {111}< 112> . Fracture could only happen when λ , the angle between the loading direction and the shear direction, is less than π /2. Consequently, for a certain loading direction, tension and compression cannot share the same fracture system. According to Eq. (6), the ideal compressive strength of the perfect fcc crystals under an arbitrary loading orientation can be gained, and hence, the t/c asymmetry can also be achieved. MTEX3.5.0 [30] was used to calculate the minimum compressive strength under the consideration of the competition between the different systems of {111}< 112> , and to draw the stereographic contour plots of the ideal compressive strength and the strength asymmetry.
 | Fig. 1 Qualitative representation of the tensile strength and compressive strength through the Mohr’ s stress circles and fracture criterion lines. The diameters of the two Mohr’ s circles denote the fracture strength of tension and compression, respectively |
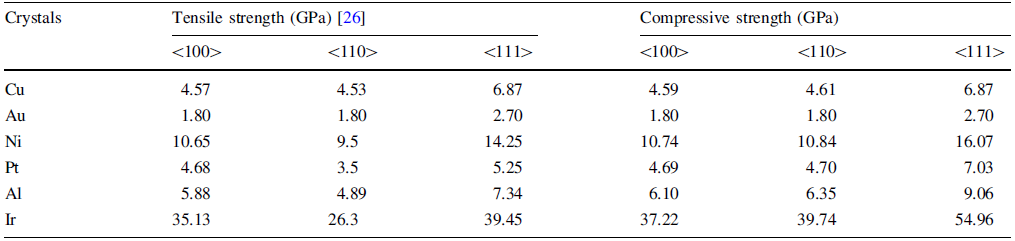
The ideal compressive strength values of the six fcc perfect crystals can be calculated according to Eq. (6), in a similar manner as the calculation of the ideal tensile strength [26]. The fracture under uniaxial compression is totally undertaken by {111}< 112> along any loading orientation, and thus, σ 0 and τ 0 here are the ideal cleavage strength of {111} planes and the ideal shear strength of {111}< 112> , respectively. The compressive strength along < 100> , < 110> and < 111> loading orientations and the tensile results [26] are listed in Table 1. Unlike the tensile strength, the compressive strength along the three simple orientations for nearly all metals obeys the same sequence of \(\sigma_{\text{C} < 100 > } < \sigma_{\text{C} < 110 > } < \sigma_{\text{C} < 111 > }.\)
| Table 1 Tensile and compressive strength of the six fcc single crystals along < 100> , < 110> and < 111> loading orientations |
When τ 0{111}< 112> /σ 0{111} ≈ 0, Eq. (6) could be changed into:
$$\sigma_{\text{C}} \approx \frac{{\tau_{{0\{ 111\} < 112 > }} }}{{\cos \lambda_{\text{C}} \cos \phi_{\text{C}} }}, (7) $$
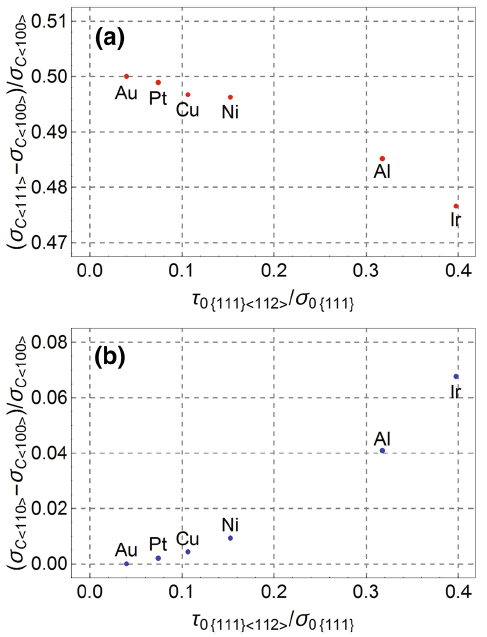
where cosϕ cosλ equals \({{\sqrt 2 } \mathord{\left/ {\vphantom {{\sqrt 2 } 3}} \right. \kern-0pt} 3}\) and \({{2\sqrt 2 } \mathord{\left/ {\vphantom {{2\sqrt 2 } 9}} \right. \kern-0pt} 9}\) for < 100> and < 111> orientations, respectively. Correspondingly, the difference in the compressive strength between the two orientations is \({{\left( {\sigma_{{{\text{C}} < 111 > }} - \sigma_{{{\text{C}} < 100 > }} } \right)} \mathord{\left/ {\vphantom {{\left( {\sigma_{{{\text{C}} < 111 > }} - \sigma_{{{\text{C}} < 100 > }} } \right)} {\sigma_{{{\text{C}} < 100 > }} }}} \right. \kern-0pt} {\sigma_{{{\text{C}} < 100 > }} }} = 0.5\) for τ 0{111}< 112> /σ 0{111} ≈ 0 and becomes smaller according to Eq. (6) with increasing value of τ 0{111}< 112> /σ 0{111}, as shown in Fig. 2a, while for both < 100> and < 110> orientations, cosϕ cosλ equals \({{\sqrt 2 } \mathord{\left/ {\vphantom {{\sqrt 2 } 3}} \right. \kern-0pt} 3}\); thus, correspondingly the compressive strength of these two orientations is the same, i.e., \(\sigma_{{{\text{C}} < 100 > }} { = }\sigma_{{{\text{C}} < 110 > }}\) and the difference in the compressive strength between the two orientations becomes larger according to Eq. (6) with increasing value of τ 0{111}< 112> /σ 0{111}, as shown in Fig. 2b.
 | Fig. 2 Variation of compressive strength of a < 110> , b < 111> orientations against < 100> orientation with the variation of τ 0{111}< 112> /σ 0{111} of six fcc crystals |
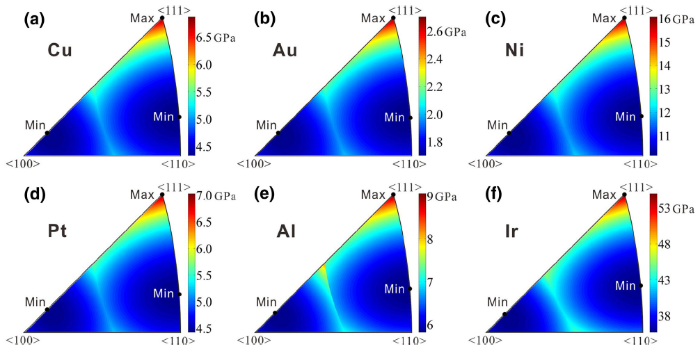
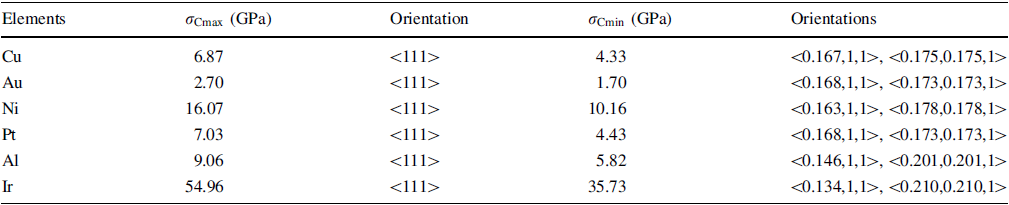
The results of the ideal compressive strength as the function of loading orientation of the six single crystals are plotted in Fig. 3. Clearly, all the plots of the six crystals show nearly the same distribution with the changes of loading orientation. The details about the maximum and minimum compressive strength and the corresponding loading orientations of the six fcc crystals are listed in Table 2. Specifically, for all crystals, the maximum happens at the same < 111> direction, where the angles between [111] direction and three of the four {111} planes, i.e., \((11\bar{1})\), \((1\bar{1}1)\) and \((\bar{1}11)\) planes, are the largest, or the highest resolved shear strength happens in this case. There are two loading directions along which the minimum compressive strength happens for each crystal. However, the loading orientations along which the minimum of the compressive strength happens are almost the same, which is due to the slight effect of normal stress. If σ 0{111}> > τ 0{111}< 112> or β = 0, the normal stress effect would be none and the corresponding orientations where the minimum compressive strength happens are < 0.169, 1, 1> and < 0.171, 0.171, 1> , where cosϕ cosλ of the two orientations are the same. Since |β | equals 1/2 for uniaxial compression, smaller than that for uniaxial tension (|β | = 1), the normal stress effect under compression is smaller than that for the tensile condition. The minor difference in the orientation along which the lowest compressive strength happens for the six fcc crystals, as shown inTable 2, is due to the value of τ 0{111}< 112> /σ 0{111}: the orientations toward to < 111> and < 110> along the loading orientation line of < 100> -< 111> and < 110> -< 111> , respectively, with decreasing value of τ 0{111}< 112> /σ 0{111}.
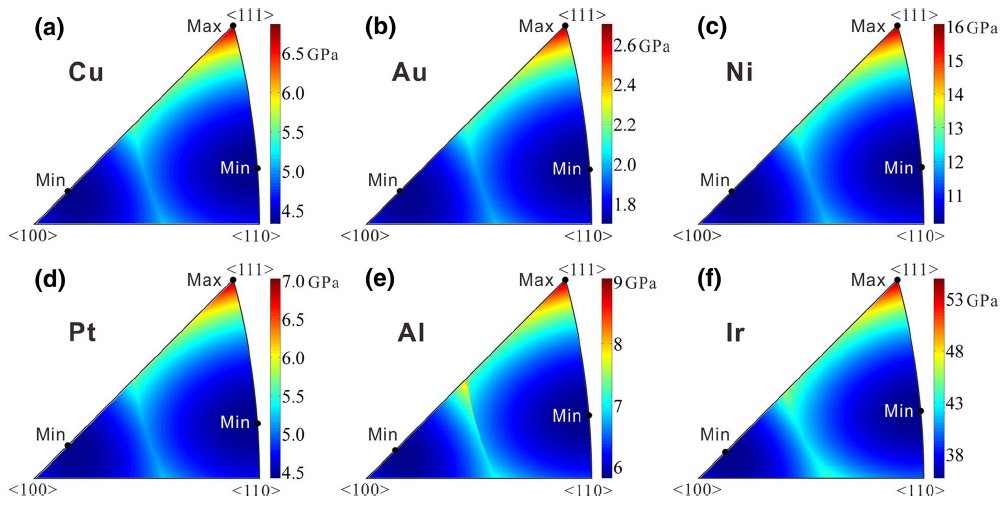 | Fig. 3 Stereographic contour plots of compressive strength of a Cu, b Au, c Ni, d Pt, e Al, f Ir. Black spots are denoted as the loading orientations where the maximum or minimum compressive strength appears |
| Table 2 The maximum compressive strength (\(\sigma_{{{\text{C}}\hbox{max} }}\)) and the minimum compressive strength (\(\sigma_{{{\text{C}}\hbox{min} }}\)) as well as the corresponding loading orientation(s) of the six fcc crystals |
From the results of the previously calculated ideal tensile strength [26] and the present ideal compressive strength, the asymmetry between tensile and compressive strength, κ , along an arbitrary loading orientation can be calculated by Eq. (8):
$$\kappa = \frac{{\sigma_{\text{C}} }}{{\sigma_{\text{T}} }} = \frac{{\cos^{2} \phi_{\text{T}} \sqrt {\left( {{{\cos \lambda_{\text{T}} } \mathord{\left/ {\vphantom {{\cos \lambda_{\text{T}} } {\cos \phi_{\text{T}} }}} \right. \kern-0pt} {\cos \phi_{\text{T}} }}} \right)^{2} + \left( {{{\tau_{{0\{ 111\} < 112 > }} } \mathord{\left/ {\vphantom {{\tau_{{0\{ 111\} < 112 > }} } {\sigma_{{0\{ 111\} }} }}} \right. \kern-0pt} {\sigma_{{0\{ 111\} }} }}} \right)^{2} } }}{{\cos^{2} \phi_{\text{C}} \sqrt {\left( {{{\cos \lambda_{\text{C}} } \mathord{\left/ {\vphantom {{\cos \lambda_{\text{C}} } {\cos \phi_{\text{C}} }}} \right. \kern-0pt} {\cos \phi_{\text{C}} }}} \right)^{2} - \frac{1}{2}\left( {{{\tau_{{0\{ 111\} < 112 > }} } \mathord{\left/ {\vphantom {{\tau_{{0\{ 111\} < 112 > }} } {\sigma_{{0\{ 111\} }} }}} \right. \kern-0pt} {\sigma_{{0\{ 111\} }} }}} \right)^{2} } }}, (8) $$
when the tensile fracture is undertaken by the shear of {111}< 112> ; otherwise, when the tensile fracture occurs with the cleavage of {110} plane, the asymmetry can be calculated by Eq. (9):
$$\kappa = \frac{{\sigma_{\text{C}} }}{{\sigma_{\text{T}} }} = \frac{{\cos^{2} \phi_{\text{T}} {{\tau_{{0\{ 111\} < 112 > }} } \mathord{\left/ {\vphantom {{\tau_{{0\{ 111\} < 112 > }} } {\sigma_{{0\{ 110\} }} }}} \right. \kern-0pt} {\sigma_{{0\{ 110\} }} }}}}{{\cos^{2} \phi_{\text{C}} \sqrt {\left( {{{\cos \lambda_{\text{C}} } \mathord{\left/ {\vphantom {{\cos \lambda_{\text{C}} } {\cos \phi_{\text{C}} }}} \right. \kern-0pt} {\cos \phi_{\text{C}} }}} \right)^{2} - \frac{1}{2}\left( {{{\tau_{{0\{ 111\} < 112 > }} } \mathord{\left/ {\vphantom {{\tau_{{0\{ 111\} < 112 > }} } {\sigma_{{0\{ 111\} }} }}} \right. \kern-0pt} {\sigma_{{0\{ 111\} }} }}} \right)^{2} } }}.(9)$$
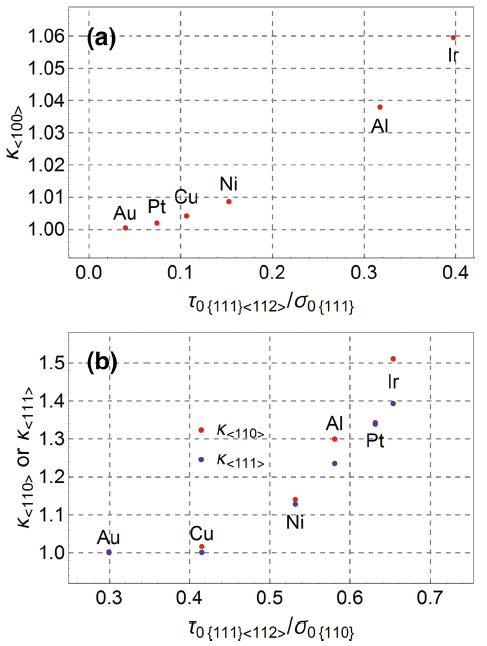
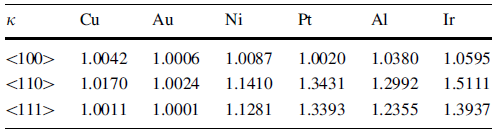
The results of the asymmetry of the six fcc crystals along < 100> , < 110> and < 111> loading orientations are listed in Table 3. For < 100> orientation in all crystals, shear fracture of {111}< 112> always happens under either tensile or compressive loading. Consequently, κ < 100> is the only function of τ 0{111}< 112> /σ 0{111}, as shown in Fig. 4a. While for < 110> and < 111> orientations of Ni, Pt, Al and Ir, the cleavage of {110} plane dominates the tensile fracture. Hence, the tensile strength is significantly lowered through the competition between shear of {111}< 112> and cleavage of {110} planes, and correspondingly, they exhibit higher values of κ , as shown in Fig. 4b and Table 3. Meanwhile, the ratio of τ 0{111}< 112> /σ 0{110} also dramatically influences κ < 110> and κ < 111> , as shown in Fig. 4b. For example, for Cu and Au with very small values of τ 0{111}< 112> /σ 0{111}, the shear fracture of {111}< 112> dominates the tensile fracture along the three orientations. As a result, the difference between tensile and compressive strength is too small to be distinguished, as shown in Fig. 4 and Table 3. Therefore, the tensile fracture mode could be the main factor dominating the strength asymmetry and the ratio of τ 0{111}< 112> /σ 0{111} also slightly influences the asymmetry.
| Table 3 Asymmetry between tensile and compressive strength of the six fcc single crystals along < 100> , < 110> and < 111> loading orientations |
 | Fig. 4 Variation of asymmetries between tensile and compressive strength of a < 100> orientation (κ < 100> ) with the variation of τ 0{111}< 112> /σ 0{111} and b < 110> , < 111> orientations (κ < 110> and κ < 111> ) with the variation of τ 0{111}< 112> /σ 0{110} of six fcc crystals |
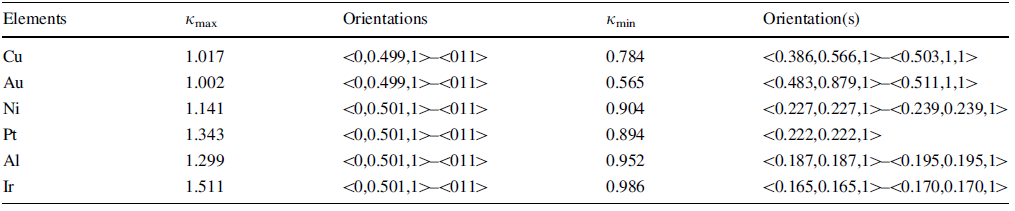
Furthermore, the asymmetry as the function of loading orientation for the six single crystals is plotted in Fig. 5. For the studied six perfect crystals (Cu, Au, Ni, Pt, Al and Ir), all the maximum of the asymmetry happens at the same loading orientations represented by the line ~< 0, 0.5, 1> -< 0, 1, 1> . The maximum κ values for six perfect crystals are listed in Table 4. However, the specific orientations for the minimum of the strength asymmetry are different for different crystals. For Cu and Au, the minimum values of κ are 0.784 and 0.565, occurring at the line < 0.386, 0.566, 1> -< 0.503, 1, 1> and < 0.483, 0.879, 1> -< 0.511, 1, 1> loading orientations, respectively, while as listed in Table 4, for Ni, Pt, Al and Ir, the minimum values of κ are 0.904, 0.894, 0.952 and 0.986, happening at the line < 0.227, 0.227, 1> -< 0.239, 0.239, 1> , < 0.222, 0.222, 1> , < 0.187, 0.187, 1> -< 0.195, 0.195, 1> and < 0.165, 0.165, 1> -< 0.170, 0.170, 1> loading orientations, respectively. The reason for the difference in the critical orientation for the minimum κ between Cu, Au and the remained four crystals is that the tensile strength of Cu or Au is undertaken by the cleavage of the plane along the corresponding orientation, near which the tensile strength is the maximum [26]. The difference between Cu, Au and the remained Ni, Pt, Al and Ir for the minimum κ roots from the difference of ideal strength data (the ideal shear strength of {111}< 112> and the ideal cleavage strengths of {111} and {110} as listed in [26]) of the six fcc crystals. On one hand, the higher τ 0{111}< 112> /σ 0{110} leads to the easier cleavage of {110} plane, which could reduce the tensile strength of some specific orientation; on the other hand, the lower τ 0{111}< 112> /σ 0{111} could lead to the more significant normal stress effect, which would reduce the tensile strength and increase the compressive strength and finally obtain a higher t/c asymmetry. Through further manipulation of the results of the t/c asymmetry for the six fcc crystals in Fig. 5, the percentages of orientations for κ > 1 and κ ≤ 1 in all the orientations of the spatial space were obtained and are displayed in Fig. 6a. Obviously, for the possibility to occur κ > 1, the six crystals can be sequenced as Au < Cu < Ni < Pt < Al < Ir, as shown in Fig. 6a. Furthermore, the average strength asymmetry \(\bar{\kappa }\) of the six perfect crystals exhibits a sequence of Au < Cu < Ni < Al < Pt < Ir, as shown in Fig. 6b. These results suggest that Au is the metal which is the most difficult to show large strength asymmetry, while for Ir nearly along all orientations the compressive strength is higher than the tensile one, and certain strength asymmetry always exists. The obtained sequence here is grossly consistent with the sequence for cleavage [26], which thus may imply that the perfect crystal which is easy to cleave tends to show large strength asymmetry.
 | Fig. 5 Stereographic contour plots of the asymmetry between tensile strength and compressive strength of a Cu, b Au, c Ni, d Pt, e Al, f Ir. Black spots and lines are denoted as the loading orientations where the maximum and minimum t/c asymmetries happen. For further analysis, the orientations where cleavage would happen under tension [26] are encircled with white dashed lines and marked with C (cleavage) inside the circles |
| Table 4 The maximum t/c asymmetry (κ max) and the minimum asymmetry (κ min) as well as their corresponding loading orientation(s) of the six fcc crystals |
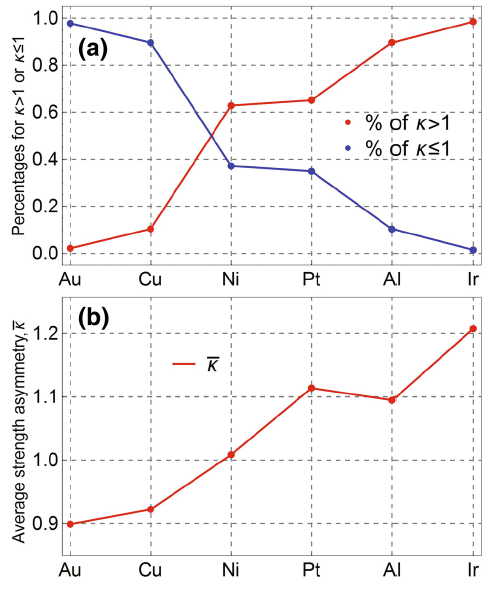 | Fig. 6 a Percentages of orientations for κ > 1 and κ ≤ 1 among all the orientations of the spatial space b average strength asymmetry (\(\bar{\kappa }\)) of the six fcc crystals |
By comparing with the results simulated by the MD method, it is found that the corresponding orientation of the maximum asymmetry calculated in this study is well consistent with the previous results of Cu [2, 7, 22]. On the other hand, although for Ni, Pt, Al and Ir, the MD simulated results of the orientations corresponding to the minimum strength asymmetries are consistent with our results, for Cu and Au a discrepancy exists. This is mainly due to the transition of different tensile fracture mechanisms that happens near the orientation of the minimum t/c asymmetry, i.e., the highest tensile strength results in the minimum strength asymmetry [26]. Another reason is that the tensile or compressive strength calculated by the MD method is the stress for the homogenous nucleation of dislocations, which is different from the ideal fracture of a specific crystallographic plane. Interestingly, both the results here and the MD results [2, 7, 22] of the asymmetry sometimes are smaller than 1, i.e., the compressive strength is lower than the tensile strength, which is not consistent with the results in the high-strength isotropic materials [29]. The reason is that both the ideal shear fracture and the nucleation of dislocations of single crystals are definitely orientation dependent, while for the polycrystalline materials the orientation dependence is eliminated through the equalization of the spatial space of the multi-crystalline grains.
Above results show that the strength asymmetry may depend upon the loading orientation (\(\lambda_{\text{T}}\), \(\phi_{\text{T}}\), \(\lambda_{\text{C}}\) and \(\phi_{\text{C}}\)). Besides the extrinsic factor, both the tensile fracture mode and the normal stress could also affect the asymmetry. Concerning the effect of tensile fracture mode, if the shear of {111}< 112> dominates the fracture under tension, the asymmetry can be expressed as Eq. (8), while, if the cleavage of {110} planes dominates the fracture along certain orientation, the asymmetry can be expressed as Eq. (9). Whether to choose Eq. (8) or Eq. (9) mainly depends on the value of τ 0{111}< 112> /σ 0{110}[26]. For the normal stress effect, according to Eqs. (8) and (9), higher τ 0{111}< 112> /σ 0{111} would lead to a higher asymmetry and higher τ 0{111}< 112> /σ 0{110} would also result in a higher asymmetry, which could be expressed by Eq. (9). Consequently, both τ 0{111}< 112> /σ 0{111} and τ 0{111}< 112> /σ 0{110} are the intrinsic factors to influence the asymmetry. However, only the value of τ 0{111}< 112> /σ 0{111} was considered [21, 22], which is because only the shear fracture is undertook by the dislocations under tensile loading. Furthermore, the value of β , which affects the tensile/compressive asymmetry as the coefficient of τ 0{111}< 112> /σ 0{111}, also plays an important role. In fact, the exact coupling function between the normal stress and shear stress, i.e., the exact value of β , needs the help of ab initio method. Here we make β equals 1 and -1/2 for tensile and compressive loading, respectively, which is more simple and time saving but clear enough to reveal the loading axial direction effect on the asymmetry.
For the isotropic materials, \(\lambda = \theta = 90{^\circ } - \phi\) (θ denotes as the fracture angle [27, 29]) and both τ 0{111}< 112> /σ 0{111} and τ 0{111}< 112> /σ 0{110} can be changed into the isotropic form α = τ 0/σ 0. With the relationship between φ and α [29],
$$\tan \phi_{\text{T}} = \sqrt {1 - 2\alpha^{2} } , (10)$$
$$\tan \phi_{\text{C}} = \sqrt {1 + \alpha^{2} } . (11)$$
Combining with Eqs. (10) and (11), Eq. (8) could be changed into,
$$\kappa = \frac{{\sigma_{\text{C}} }}{{\sigma_{\text{T}} }} = \sqrt {\frac{{1 + {{\alpha^{2} } \mathord{\left/ {\vphantom {{\alpha^{2} } 2}} \right. \kern-0pt} 2}}}{{1 - \alpha^{2} }}} , (12)$$
which is consistent with the result of the asymmetry of isotropic materials with \(0 \le \alpha \le {{\sqrt 2 } \mathord{\left/ {\vphantom {{\sqrt 2 } 2}} \right. \kern-0pt} 2}\) [29], while for the case of the cleavage of {110} plane under uniaxial tension,
$$\tan \phi_{\text{T}} = 0. (13)$$
Combining with Eqs. (11) and (12), Eq. (8) could be changed into the form
$$\kappa = \frac{{\sigma_{\text{C}} }}{{\sigma_{\text{T}} }} = 2\alpha \sqrt {1 + {{\alpha^{2} } \mathord{\left/ {\vphantom {{\alpha^{2} } 2}} \right. \kern-0pt} 2}} , (14)$$
which is also consistent with the result of the asymmetry of isotropic with \(\alpha \ge {{\sqrt 2 } \mathord{\left/ {\vphantom {{\sqrt 2 } 2}} \right. \kern-0pt} 2}\). The results of isotropic counterpart made from our anisotropic model are consistent with the results directly derived from the isotropic materials, which indirectly proves our demonstration. Besides, most of the tension-compression asymmetry of polycrystalline materials stems from deformation history [31] or the texture effect [32], which is not considered here.
1.The compressive strength of the six fcc crystals along < 100> , < 110> and < 111> orientations obeys the same sequence of \(\sigma_{{{\text{C}} < 100 > }} < \sigma_{{{\text{C}} < 110 > }} < \sigma_{{{\text{C}} < 111 > }}\). With decreasing value of τ 0{111}< 112> /σ 0{111}, the difference between \(\sigma_{{{\text{C}} < 100 > }}\) and \(\sigma_{{{\text{C}} < 111 > }}\) becomes larger, while the difference between \(\sigma_{{{\text{C}} < 100 > }}\) and \(\sigma_{{{\text{C}} < 110 > }}\) is getting smaller. When τ 0{111}< 112> /σ 0{111} = 0, \(\sigma_{{{\text{C}} < 100 > }} { = }\sigma_{{{\text{C}} < 110 > }} { = }{{2\sigma_{{{\text{C}} < 111 > }} } \mathord{\left/ {\vphantom {{2\sigma_{{{\text{C}} < 111 > }} } 3}} \right. \kern-0pt} 3}\), the maximum of compressive strength happens along < 111> orientation, while the minimum of the compressive strength depends on the value of τ 0{111}< 112> /σ 0{111}. When τ 0{111}< 112> /σ 0{111} = 0, the corresponding orientations of the minimum compressive strength are < 0.169, 1, 1> and < 0.171, 0.171, 1> .
2.The maximum asymmetries of the six fcc crystals all happen along ~< 0, 0.5, 1> -< 0, 1, 1> . The minimum asymmetries of Cu and Au possess the similar distribution under different loading orientations, while the corresponding orientations of minimum asymmetries for Ni, Pt, Al and Ir locate at the line of < 100> -< 111> and the higher value of τ 0{111}< 112> /σ 0{110}, the nearer to < 100> orientation. The higher value of τ 0{111}< 112> /σ 0{110} and τ 0{111}< 112> /σ 0{111} will cause more tendency to cleavage under tensile stress, which results in lower tensile strength and higher asymmetry. Otherwise, higher value of τ 0{111}< 112> /σ 0{111} and |β | will lead to a higher normal stress effect and in succession the higher compressive strength and lower tensile strength and higher asymmetry.
3.This mechanical behavior of ideal crystals under different stress states could not only give guidance to the materials selection for high-strength materials, but also shed lights on better understanding of the elastic strain engineering of ultra-strength materials and the deformation and fracture mechanisms of anisotropy materials under different stress states.
The authors have declared that no competing interests exist.
| [1] |
|
| [2] |
|
| [3] |
|
| [4] |
|
| [5] |
|
| [6] |
|
| [7] |
|
| [8] |
|
| [9] |
|
| [10] |
|
| [11] |
|
| [12] |
|
| [13] |
|
| [14] |
|
| [15] |
|
| [16] |
|
| [17] |
|
| [18] |
|
| [19] |
|
| [20] |
|
| [21] |
|
| [22] |
|
| [23] |
|
| [24] |
|
| [25] |
|
| [26] |
|
| [27] |
|
| [28] |
|
| [29] |
|
| [30] |
|
| [31] |
|
| [32] |
|