


Microstructure and Electrochemical Corrosion Behavior of Fe-Cr System Alloys as Substitutes for Ni-Based Brazing Filler Metal
[Kangdao Shi1  , Takahiro Tsunoda
2 , Ikuo Shohji2 , Kotaro Matsu3 , Yasuhiro Taguchi3 ]
, Takahiro Tsunoda|
|


Two new Fe-Cr system alloys, Fe-20Cr-43Ni-10P (mass%) and Fe-20Cr-20Ni-8P-5Si-2Mo (mass%), have been developed as substitutes for the expensive Ni-based brazing filler metal used in brazing exhaust gas recirculation coolers. The microstructures and melting properties of the alloys were analyzed by electron probe X-ray microanalyzer and differential scanning calorimetry. The electrochemical characteristics of the alloys were investigated by potentiodynamic polarization testing in an electrolyte solution made in accordance with the standards of the Automobile Manufacturers Association of Germany. Furthermore, the corrosion behaviors of the alloys were investigated by constant-potential polarization testing and surface characterization. It is found that both alloys are composed of solid-solution phases and phosphide phases. The solid-solution phases serve as the anode, and the phosphide phases serve as the cathode in the corrosion reaction for both alloys. Fe-20Cr-43Ni-10P exhibits galvanic corrosion on the entire surface. In contrast, Fe-20Cr-20Ni-8P-5Si-2Mo is attacked at a few localized areas so that the cavities form on the surface. The corrosion potential (Ecorr) is lower than that of Ni-29Cr-6P-4Si (mass%) for both alloys. This means that the Fe-Cr system alloys are more easily corroded than Ni-29Cr-6P-4Si. The corrosion rate and corrosion resistance cannot be investigated by the corrosion current density (icorr) and polarization resistance (Rp), respectively, because of localized corrosion of the two alloys.
Global warming due to environmental pollution has attracted considerable attention in recent years, and one of the main causes of global warming is exhaust gas from automobiles [1]. Exhaust gas from automobiles usually consists of a variety of components including fine carbonaceous particulate matter (PM), oxides of nitrogen (NOx), and volatile unburnt hydrocarbons. All are considered to be deleterious to human health as well as the environment [2, 3]. The exhaust gas from automobiles and the resulting health hazards are major concerns.
During the past few decades, significant progress has been accomplished in reducing emissions of NOx and PM, but at the same time the legislated maximum levels of emissions have been increasingly tightened[4]. The European Union has approved the Euro VI (2014) regulations, in which the NOx and PM emission standards are 0.08 and 0.005 g/km, respectively. Compared with Euro V (NOx 0.18 g/km and PM 0.005 g/km), the stricter NOx emission regulations imply that engine manufacturers and researchers must develop more effective means for reducing NOx emissions [5, 6, 7]. The cooled exhaust gas recirculation (EGR) system is one of the most effective techniques for reducing NOx emissions [8, 9, 10, 11, 12, 13, 14, 15, 16, 17]. EGR is possibly the only currently available technology expected to meet more stringent legal regulations for engine emissions in the future [18].
To improve the performance and efficiency of plate-type or flat tube coolers (particularly for EGR applications), designs are becoming increasingly compact and complex. These configurations require a large number of internal joints. Brazing is the preferred option for complex systems[19]. Several commercial brazing filler metals exist, including silver-based and nickel-based filler metals [19]. In terms of the conditions of use, the corrosion resistance of the material is important. Stainless-steel joints brazed by Ni-based filler metals are popular in practical applications because of their excellent corrosion and heat resistances[20, 21].
Owing to soaring commodity prices, there has been growing anxiety regarding the cost of resources in a variety of industries since 2003. The prices of the metals, such as Cu, Zn, and Ni, reached four times as high as those in 2000. Furthermore, it is expected that the prices will continue to increase in the future [22]. Therefore, Ni-based filler metals, mainly composed of Ni, are affected by the high cost of Ni. On the other hand, owing to the continuous pressure to reduce costs in mass production, particularly in the automobile industry, broad interest in new brazing filler metals with the potential for further cost reduction is expected [23]. There is a need to develop inexpensive fillers to replace conventional Ni-based filler metals. Given this background, Fe-Cr system alloys, which have an extremely low Ni content, have been developed as substitutes for expensive Ni-based brazing filler metals for the brazing of EGR coolers [23, 24, 25].
Several Fe-containing brazing filler metals have been developed and utilized practically, such as IronBraze™ TB-2720 (Fe-20Cr-43Ni-10P, mass%) and TB-4520 (Fe-20Cr-20Ni-8P-5Si-2Mo, mass%) from Tokyo Braze Co., Ltd. (Japan). It was found that joints brazed with Fe-20Cr-43Ni-10P had a shear strength of approximately 100 MPa, although the shear strength was slightly inferior to that of joints brazed with Ni-29Cr-6P-4Si, and joints brazed with Fe-20Cr-20Ni-8P-5Si-2Mo exhibited comparable shear strength with those brazed with Ni-29Cr-6P-4Si for a clearance of less than 200 μ m [24]. In contrast, the corrosion resistance of joints brazed with both filler metals was low in comparison with joints brazed with Ni-29Cr-6P-4Si. Furthermore, the joints brazed with Fe-20Cr-43Ni-10P did not provide sufficient corrosion resistance [25]. Therefore, it is focused how the lower Ni content affects the corrosion resistance of Fe-containing brazing filler metals. In a few investigations on the corrosion resistance of the joints made with Ni-based and Fe-containing brazing filler metals found in the literature, the corrosion resistance of brazing filler metals was evaluated by the weight loss method instead of by electrochemical measurements [23, 26, 27]. However, the electrochemical characteristics and corrosion behavior play important roles in improving and evaluating brazing filler metals. Therefore, the electrochemical characteristics and corrosion behavior should be investigated for new Fe-containing brazing filler metals.
In this study, the microstructures and melting properties of two new Fe-Cr system alloys, Fe-20Cr-43Ni-10P (mass%) and Fe-20Cr-20Ni-8P-5Si-2Mo (mass%), were analyzed. The electrochemical characteristics and corrosion behavior were also investigated by electrochemical and surface analysis techniques.
The Fe-Cr system alloys were made from commercial atomized powders with a particle size of less than 106 μ m. The powders were placed in an alumina plate, melted in a hydrogen furnace at 1373 K for 10 min, and then cooled to room temperature in air. For comparison, the conventional Ni-29Cr-6P-4Si (mass%) filler metal and commercial SUS304 stainless steel were also prepared.
The electrolyte solution was made in accordance with the standards of the Automobile Manufacturers Association of Germany [26]. It was composed of 1650 mg NaCl, 3.4 mL nitric acid (60%), and 1.4 mL sulfuric acid (98.08%) per 1000 mL. The pH value of the solution was found to be 1.0 using a pH test paper (accuracy class 0.3).
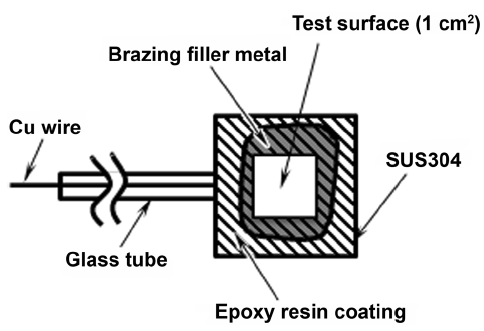
A specimen is shown in Fig. 1. The brazing filler metal was placed on SUS304 stainless-steel plates. The plates were carefully placed in a semicontinuous vacuum furnace. The brazing filler metals melted at 1373 K for 30 min in a vacuum degree of 50 Pa (deaerated with N2, 5 L/min). Then, the specimens were slowly cooled to 1173 K at a rate of approximately 7 K/min, followed by quenching to room temperature at a rate of approximately 15 K/min. Subsequently, the SUS304 stainless-steel plates were cut into 15 mm × 15 mm chips and coated with epoxy resin with an area of 1 cm2 area remaining uncoated.
 | Fig. 1 Schematic diagram of the specimen |
Both potentiodynamic polarization tests and constant-potential polarization tests were performed by the standard three-electrode method at room temperature. The counter electrode was a thin piece of platinum. The reference electrode was a silver-silver chloride electrode (SSE) that was linked to the test cell through a salt bridge. All potentials were with reference to the SSE electrode. The solution was deaerated with nitrogen gas during the tests (10 mL/min). The open-circuit potential (OCP) was monitored. When the change in the OCP decreased to less than 10 mV/h, the potentiodynamic polarization test was performed. The scan started from 200 mV below the OCP and was swept in the positive direction. The scan rate was 0.2 mV/s. For every test condition, the scan was performed twice to ensure repeatability and reliability.
The obtained DSC curves are shown in Fig. 2. Each specimen was heated from 923 to 1450 K at a rate of 10 K/min; then, the temperature was reduced to 923 K at the same rate. According to the heating curves, the solidus and liquidus temperatures for Fe-20Cr-43Ni-10P are 1175 and 1313 K, and those of Fe-20Cr-20Ni-8P-5Si-2Mo are 1328 and 1359 K, respectively. Both cooling curves indicate two distinct exothermic events. Therefore, both brazing filler metals comprise two different phases.
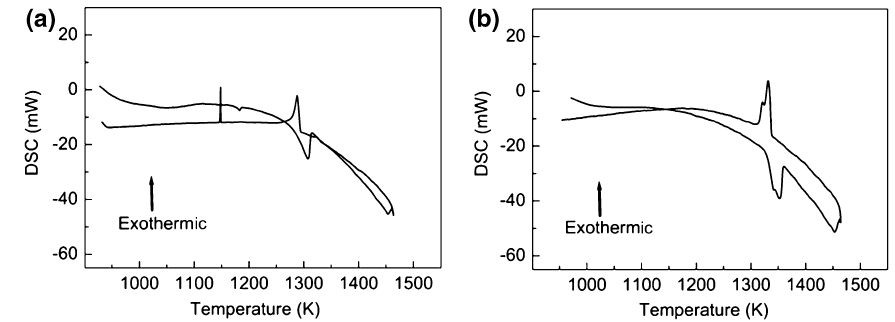 | Fig. 2 DSC curves of brazing filler metals: a Fe-20Cr-43Ni-10P, b Fe-20Cr-20Ni-8P-5Si-2Mo |
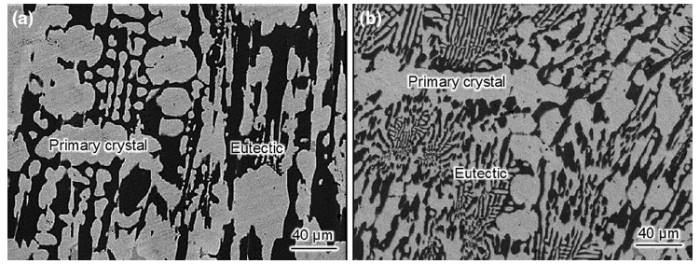
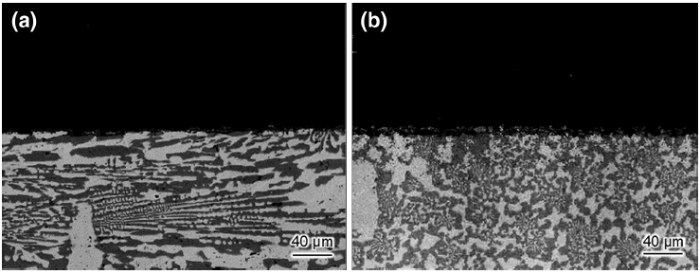
The microstructure of the Fe-20Cr-43Ni-10P filler metal is shown in Fig. 3a. Dark gray and bright gray phases are observed, with the bright gray phases consisting of coarse and fine phases. According to the results of quantitative analysis by electron probe X-ray microanalyzer (EPMA), the Fe:Cr:Ni:P ratio of the dark gray phases is 13.5:38.0:24.3:24.2 (mass%); thus, they are confirmed to be phosphide phases. The corresponding ratio of the coarse bright gray phases is 40.2:19.7:39.0:1.1 (mass%) and that of the fine bright gray phases is 37.7:15.6:45.6:1.1 (mass%). Consequently, they are identified as solid-solution phases. Along with the DSC results shown in Fig. 2a, it is indicated that the coarse bright gray phases are primary crystals that solidify at 1288 K, whereas the fine bright gray phases and dark gray phases are eutectic phases that solidify at 1145 K. In these phases, each element is unevenly distributed. In particular, it is found that P is segregated in the dark gray phases. Moreover, the composition of the coarse bright gray phases is different from that of the fine bright gray phases. This is because the solidifying temperature has an impact on element segregation [28]. In addition, the Cr content is higher than the Fe and Ni contents in the phosphide phases because Cr is more easily combined in phosphides than Fe and Ni [29].
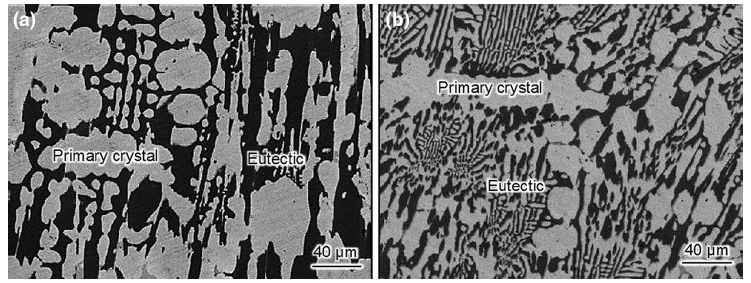 | Fig. 3 Microstructures of cross sections of the as-cast brazing filler metals (back-scattered electron images): a Fe-20Cr-43Ni-10P, b Fe-20Cr-20Ni-8P-5Si-2Mo |
The microstructure of the Fe-20Cr-20Ni-8P-5Si-2Mo filler metal is shown in Fig. 3b, which is similar to that of the Fe-20Cr-43Ni-10P filler metal. However, the microstructure is finer than that of the Fe-20Cr-43Ni-10P owing to Mo addition [30, 31, 32]. The Fe:Cr:Ni:Mo:Si:P ratio of the dark gray phases is 27.5:38.5:8.6:1.5:0.9:23.0 (mass%), compared with 60.5:19.7:13.8:0.3:5.4:0.3 (mass%) for the coarse bright gray phases and 62.3:20.5:12.8:1.2:2.3:0.9 (mass%) for the fine bright gray phases. The dark gray and bright gray phases are identified as phosphide phases and Fe-based solid-solution phases, respectively. The coarse bright gray phases are primary crystals that solidify at 1331 K, whereas the fine bright gray phases and dark gray phases are eutectic phases that solidify at 1322 K. With regard to the composition, the bright gray phases in the primary crystals and the eutectic phases have almost the same amounts of the principal components of Fe, Cr, and Ni. This is due to their very similar solidifying temperature.
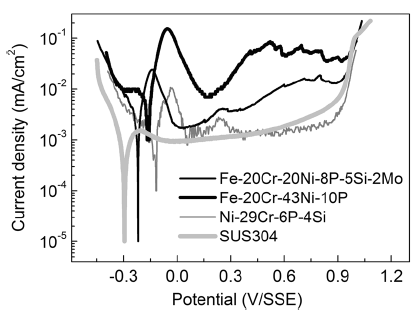
The anodic and cathodic polarization curves of the specimens are illustrated in Fig. 4. All the brazing filler metals exhibit distinct active-passive transitions in terms of the anodic polarization behavior. Nevertheless, the specific potential ranges of the transitions are different among the specimens. The Fe-Cr system alloys exhibit an extremely narrow passive region compared with Ni-29Cr-6P-4Si. In contrast, the SUS304 stainless steel does not exhibit an obvious active region but has a wide passive region (potential: -0.1 to 0.5 V/SSE). Moreover, the critical current density required for passivation (icrit) is extremely close to the passivation current density (ipass). The self-passivation characteristic is particularly apparent and will be investigated in future research.
 | Fig. 4 Potentiodynamic polarization curves of the specimens |
To obtain a quantitative understanding of the anodic reaction, the electrochemical parameters, such as the corrosion potential (Ecorr), corrosion current density (icorr), Tafel anodic slope (β a), and Tafel cathodic slope (β c), were estimated by Tafel extrapolation. The polarization resistance (Rp) was calculated by Eq. (1)[33]. The results are summarized in Table 1.
$$R_{\text{p}} = {{\beta_{\text{a}} \beta_{\text{c}} } \mathord{\left/ {\vphantom {{\beta_{\text{a}} \beta_{\text{c}} } {\left[ {2.3i_{\text{corr}} \left( {\beta_{\text{a}} + \beta_{\text{c}} } \right)} \right].}}} \right. \kern-0pt} {\left[ {2.3i_{\text{corr}} \left( {\beta_{\text{a}} + \beta_{\text{c}} } \right)} \right].}} (1)$$
| Table 1 Electrochemical parameters obtained by Tafel extrapolation |
Ecorr indicates how difficult it is to corrode a material [34]. The nobler the value of Ecorr., the more difficultly the material is to be attacked by corrosion. Ecorr has the most negative value for Fe-20Cr-20Ni-8P-5Si-2Mo, followed by Fe-20Cr-43Ni-10P and Ni-29Cr-6P-4Si. This means that Fe-20Cr-20Ni-8P-5Si-2Mo is the most easily corroded material and it is the most difficult for Ni-29Cr-6P-4Si to corrode. This difference in Ecorr is related to the Ni content because Ni has a nobler potential than Fe [35]. This implies that the proportion of Ni and Fe is critical in obtaining a satisfactory Ecorr for Fe-Cr system alloys.
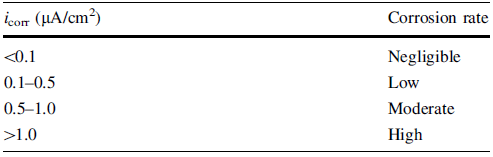
icorr indicates the corrosion rate [33]. Corrosion attack will proceed at a high rate for a high value of icorr. Some guidelines have been developed to establish the relationship between the corrosion current density and the corrosion rate, as shown in Table 2[36]. According to Table 2, Fe-20Cr-43Ni-10P and Fe-20Cr-20Ni-8P-5Si-2Mo have high corrosion rates, while Ni-29Cr-6P-4Si has a moderate corrosion rate.
| Table 2 Relationship between the corrosion current density and the corrosion rate |
Rp represents the ease of charge transfer across the metal/electrolyte interface and is utilized to evaluate the corrosion resistance[36]. The greater the value of Rp, the more difficult it is for charge transfer to occur, and consequently the greater corrosion resistance. Rp for the specimens decreases in the order Ni-29Cr-6P-4Si > Fe-20Cr-20Ni-8P-5Si-2Mo > Fe-20Cr-43Ni-10P. The corrosion rate and corrosion resistance are discussed in Sect. 3.4.2 for Fe-20Cr-43Ni-10P and Fe-20Cr-20Ni-8P-5Si-2Mo.
3.4.1 Anode and Cathode of Electrode Reaction
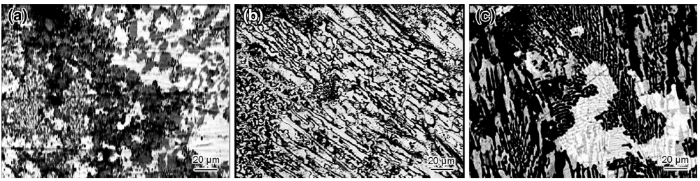
Figures 5 and 6 show the surface morphologies after constant-potential polarization for 3, 50, and 100 h for Fe-20Cr-43Ni-10P and Fe-20Cr-20Ni-8P-5Si-2Mo, respectively. After polarization for 3 h, it is clear that the bright gray solid-solution phases have preferentially dissolved for both brazing filler metals. It is thus confirmed that the solid-solution phases are the anode for both brazing filler metals.
 | Fig. 5 Surface microstructures of Fe-20Cr-43Ni-10P brazing filler metal after constant-potential polarization in potential of -0.11 V/SSE (back-scattered electron images): a polarized for 3 h, b polarized for 50 h, c polarized for 100 h |
 | Fig. 6 Surface microstructures of Fe-20Cr-20Ni-8P-5Si-2Mo brazing filler metal after constant-potential polarization in potential of -0.17 V/SSE (back-scattered electron images), a polarized for 3 h, b polarized for 50 h, c polarized for 100 h |
The surface morphology was markedly different after 100 h. To determine the remaining phases, mapping analysis of the surfaces was conducted and the results are shown in Figs. 7 and 8. The detection of P revealed that the phosphide phases did not corrode and became the cathode for both brazing filler metals because P exists almost exclusively in the phosphide phases.
 | Fig. 7 Mapping analysis results of the surface for Fe-20Cr-43Ni-10P after constant-potential polarization in potential of -0.11 V/SSE for 100 h |
 | Fig. 8 Mapping analysis results of surface for Fe-20Cr-20Ni-8P-5Si-2Mo after constant-potential polarization in potential of -0.17 V/SSE for 100 h |
3.4.2 Corrosion Mechanism
To further clarify the anti-corrosion mechanism, the corrosion process was studied by performing constant-potential polarization tests. The change in the current density as a function of the polarization time was used to monitor the chemical stability and corrosion process. Figure 9 shows the current density versus time relationship. The polarization potential is -0.11 V/SSE for Fe-20Cr-43Ni-10P and -0.17 V/SSE for Fe-20Cr-20Ni-8P-5Si-2Mo. As shown in Fig. 4, the polarization potentials lie in the active area, and accordingly the results can be used to clarify the corrosion process for the brazing filler metals.
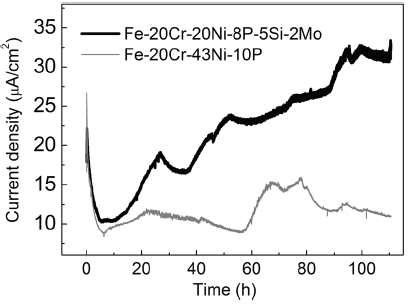 | Fig. 9 Current density dependence on time during constant-potential tests (potential: -0.11 V/SSE for Fe-20Cr-43Ni-10P; potential: -0.17 V/SSE for Fe-20Cr-20Ni-8P-5Si-2Mo) |
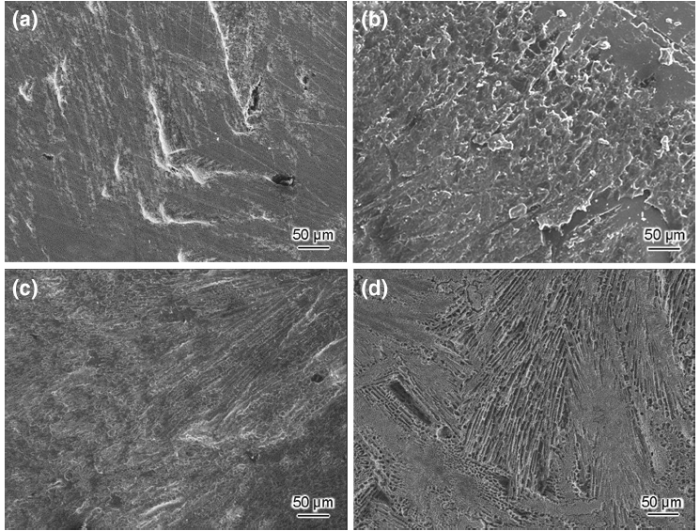
For Fe-20Cr-43Ni-10P, the corrosion process can be divided into three different stages over approximately 100 h, those in the 0-6, 6-56, and 56-100 h time periods. Figure 10 presents field-emission scanning electron microscopy (FE-SEM) images taken in every stage. In the initial stage (0-6 h), the current density rapidly increased from 0.017 mA/cm2 to a peak of 0.026 mA/cm2 and then decreased to a minimum of 0.009 mA/cm2. Figure 10a displays an FE-SEM image of Fe-20Cr-43Ni-10P during this stage. Several brighter areas can be observed on the matrix. A brighter color implies that the localized electrodissolution surpassed that of the surrounding surface (the matrix). The brighter areas can be interpreted as the dissolution of metals at surface defects [37]. In this stage, the corrosion process can be explained as follows. The onset of corrosion occurs at surface defects (such as voids and inclusions). The current density rapidly increases with increasing number of activated defect pits. At the same time, the areas around the defect pits are activated so that the corrosion tends to spread. The current density reaches a peak and begins to decrease until the surface enters a temporary steady state. In the second stage (6-56 h), the current density fluctuated within a narrow range. This reflects the occurrence of heterogeneous reactions. Figure 10b, c shows FE-SEM images taken during this stage. In this stage, corrosion occurred over the entire surface with the remaining area of localized electrodissolution continuing to spread. The heterogeneous reactions in the stage are related to surface morphology shown in Fig. 5b. From 56 to 100 h, the current density distinctly increased. It is known that the current density is inversely proportional to the actual soluble area in double logarithmic coordinate[38]. The increase in the current density reflects the decrease in the actual soluble area. This means that major changes occurred on the surface, for instance, pit corrosion or the formation of cavities. However, these changes cannot be verified from Figs. 5c and 10d. This implies that the corrosion reactions proceed not only on the surface but also in the deep direction. Figure 11 shows the cross-sectional morphologies of Fe-20Cr-43Ni-10P after 50 and 100 h. No corrosion in the deep direction was observed after 50 h. However, the corrosion has extended in the depth direction after 100 h. In addition, the corrosion was uniform in the depth direction and the cathode phases were almost completely preserved. It is known that the current density is directly proportional to the area ratio of the cathode to the anode for galvanic corrosion [39]. The preserved cathode phases increased the area of the cathode and resulted in an increase in the current density. The increase in the current density accelerated the corrosion. In summary, three stages were identified in the development of corrosion of Fe-20Cr-43Ni-10P: initiation, galvanic corrosion on the entire surface, and accelerated corrosion in the depth direction.
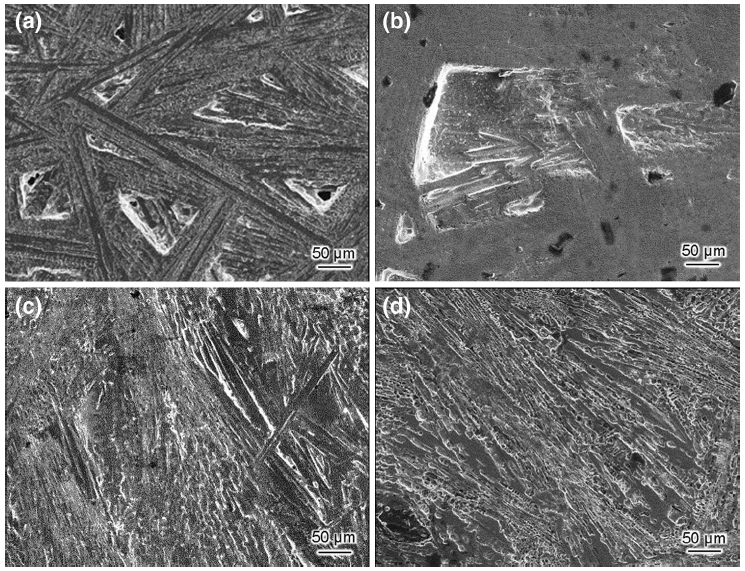 | Fig. 10 Surface morphologies of Fe-20Cr-43Ni-10P after constant-potential polarization test in potential of -0.11 V/SSE for a 3 h, b 10 h, c 50 h, d 100 h (secondary electron images) |
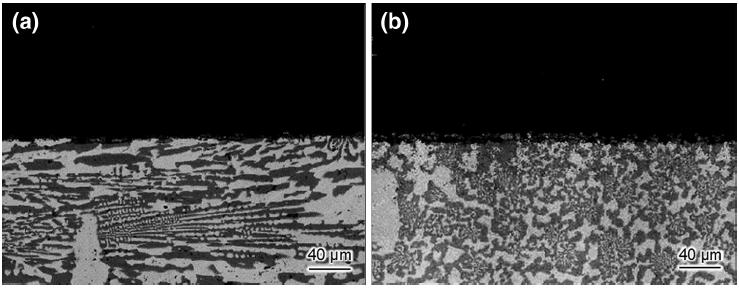 | Fig. 11 Cross-sectional morphologies of Fe-20Cr-43Ni-10P after constant-potential polarization test in potential of -0.11 V/SSE for a 50 h, b 100 h (back-scattered electron images) |
In the case of Fe-20Cr-20Ni-8P-5Si-2Mo, the corrosion process also involves three stages, which correspond to the time periods of 0-5, 5-11, and 11-100 h. FE-SEM images of the surface of Fe-20Cr-20Ni-8P-5Si-2Mo after different durations are presented in Fig. 12. The corrosion process is similar to that of Fe-20Cr-43Ni-10P for the first 11 h. In the onset stage (0-5 h), the current density increased rapidly from 0.019 mA/cm2 to a peak of 0.022 mA/cm2 and then decreased to the minimum of 0.010 mA/cm2. Moreover, corrosion clearly occurred at surface defects and spread over the surface. However, the second stage (5-11 h) continued for only 6 h. This reflects the fact that the surface of Fe-20Cr-20Ni-8P-5Si-2Mo is extremely unstable, which is related to the more negative Ecorr. In the third stage, the current density rapidly increased, which is a typical characteristic of localized corrosion [40]. As shown in Fig. 12d, some black pits were found on the surface after 100 h. Nevertheless, these pits were not found to be caused by corrosion or the surface defects shown in Fig. 12a. Figure 13 shows cross-sectional morphologies of Fe-20Cr-20Ni-8P-5Si-2Mo after 50 and 100 h. It was observed that the corrosion developed in the depth direction in the third stage. Furthermore, this corrosion was nonuniform and occurred at a few local areas on the surface. It is confirmed that the pits shown in Fig. 12d are cavities formed by localized corrosion. The morphology of the β -phase has an effect on the corrosion behavior [41], and accordingly, the formation of the cavities is related to the morphology of the phosphide phases. It is predicted that these cavities allow the corrosion to proceed as autocatalysis agents [42]. In summary, three stages were identified in the development of corrosion of Fe-20Cr-20Ni-8P-5Si-2Mo: initiation, galvanic corrosion on the surface, and the formation of cavities on the surface.
 | Fig. 12 Surface morphologies of Fe-20Cr-20Ni-8P-5Si-2Mo after constant-potential polarization test in potential of -0.17 V/SSE for a 3 h, b 10 h, c 50 h, d 100 h (secondary electron images) |
 | Fig. 13 Cross-sectional morphologies of Fe-20Cr-20Ni-8P-5Si-2Mo after constant-potential polarization test in potential of -0.17 V/SSE for a 50 h, b 100 h (back-scattered electron images) |
Owing to the formation of the phosphide phases, localized corrosion occurred for the two Fe-Cr system alloys. Note that it has been assumed that the corrosion area corresponds to the surface exposed to the solution for the data shown in Table 1. If the area is smaller than that assumed, the actual corrosion current density will be greater than the calculated value. As a consequence, icorr and Rp cannot be utilized to evaluate the corrosion rate and corrosion resistance, respectively, for the Fe-Cr system alloys.
As shown in Table 1, the two Fe-Cr system alloys are similar to Ni-29Cr-6P-4Si in terms of β a. In contrast, β c is distinctly different, particularly for Fe-20Cr-43Ni-10P, from that of Ni-29Cr-6P-4Si. It should be investigated how the cathode affects the corrosion behavior. It will contribute to improve the corrosion resistance of Fe-Cr system alloys to determine the effect of the P content on their electrochemical characteristics.
Two Fe-Cr system alloys, Fe-20Cr-43Ni-10P and Fe-20Cr-20Ni-8P-5Si-2Mo, have been developed as substitutes for the expensive Ni-based brazing filler metal used in brazing EGR coolers. The microstructures and electrochemical corrosion behaviors of the alloys were extensively evaluated in this study. The main conclusions are summarized as follows:
For Fe-20Cr-43Ni-10P and Fe-20Cr-20Ni-8P-5Si-2Mo, the microstructures are composed of a solid-solution primary crystal and a eutectic phase, and the eutectic phase is made up of solid-solution phases and phosphide phases. The solid-solution phases become the anode and the phosphide phases serve as the cathode during the corrosion reactions for both brazing filler metals.
Fe-20Cr-43Ni-10P exhibits uniform galvanic corrosion, while Fe-20Cr-20Ni-8P-5Si-2Mo is attacked at a few localized areas so that the cavities form on the surface.
Ecorr was -0.16 V/SSE and -0.22 V/SSE in the experimental solutions for Fe-20Cr-43Ni-10P and Fe-20Cr-20Ni-8P-5Si-2Mo, respectively. Fe-20Cr-43Ni-10P corrodes almost as difficultly as Ni-29Cr-6P-4Si. However, Fe-20Cr-20Ni-8P-5Si-2Mo is more easily corroded than Ni-29Cr-6P-4Si.
The corrosion rate and corrosion resistance cannot be evaluated by icorr and Rp, respectively, for the two Fe-Cr system alloys because of their localized corrosion.
The authors have declared that no competing interests exist.
| [1] |
|
| [2] |
|
| [3] |
|
| [4] |
|
| [5] |
|
| [6] |
|
| [7] |
|
| [8] |
|
| [9] |
|
| [10] |
|
| [11] |
|
| [12] |
|
| [13] |
|
| [14] |
|
| [15] |
|
| [16] |
|
| [17] |
|
| [18] |
|
| [19] |
|
| [20] |
|
| [21] |
|
| [22] |
|
| [23] |
|
| [24] |
|
| [25] |
|
| [26] |
|
| [27] |
|
| [28] |
|
| [29] |
|
| [30] |
|
| [31] |
|
| [32] |
|
| [33] |
|
| [34] |
|
| [35] |
|
| [36] |
|
| [37] |
|
| [38] |
|
| [39] |
|
| [40] |
|
| [41] |
|
| [42] |
|