
Molecular Dynamics Simulation of the Evolution of Interfacial Dislocation Network and Stress Distribution of a Ni-Based Single-Crystal Superalloy
[Yun-Li Li1 , Wen-Ping Wu1, 2  , Zhi-Gang Ruan
1 ]
, Zhi-Gang Ruan|
|


The evolution of misfit dislocation network at γ/ γ′ phase interfaces and the stress distribution characteristics of Ni-based single-crystal superalloys under different temperatures of 0, 100 and 300 K are studied by molecular dynamics (MD) simulation. It was found that a closed three-dimensional misfit dislocation network appears on the γ/ γ′ phase interfaces, and the shape of the dislocation network is independent of the lattice mismatch. Under the influence of the temperature, the dislocation network gradually becomes irregular, a/2 [110] dislocations in the γ matrix phase emit and partly cut into the γ′ phase with the increase in temperature. The dislocation evolution is related to the local stress field, a peak stress occurs at γ/ γ′ phase interface, and with the increase in temperature and relaxation times, the stress in the γ phase gradually increases, the number of dislocations in the γ phase increases and cuts into γ′ phase from the interfaces where dislocation network is damaged. The results provide important information for understanding the temperature dependence of the dislocation evolution and mechanical properties of Ni-based single-crystal superalloys.
Ni-based single-crystal superalloys are one type of the most important structural materials for advanced aircraft gas turbine blades. It is well known that these alloys can be optimized by a series of thermal heat treatments which produce a high volume fraction of hard cubical γ ′ precipitate phase embedded coherently in a softer γ matrix phase. Generally, superalloy blades are cast with the nominal [001] orientation parallel to their length, which can reduce the incidence of thermal fatigue from temperature variations encountered in operation [1]. The shape of the γ ′ precipitates is cubical with roughly {001} face, and they are approximately aligned along the common [001] direction. It was found that in modern single-crystal superalloys, the γ ′ precipitate fraction can reach 70 vol% or even higher, and the γ ′ precipitate particle size of about 0.45 μ m appears to be optimum for the yield strength and creep strength, and also for hot hardness [2, 3]. Moreover, due to the lattice mismatch of the γ and γ ′ phases with similar face-centered cubic (fcc) structure, an eigenstress field at the phase interface is presented. After a long time aging under the combined influence of loading and temperature, the dislocation network is formed at the γ /γ ′ phase interfaces [4, 5]. The evolution of the interfacial dislocation network has a close relationship with crack propagation of interface [6], γ ′ rafting and creep mechanical properties of alloys [7, 8, 9]. Thus, the yield strength and creep strength of alloys are not only dependent on the morphology of the γ ′ precipitates, but also dependent on the evolution of the dislocation network at the γ /γ ′ phase interfaces.
In strength theory, material failure is determined by stresses and strains. The failure analysis is directly related to the stress or strain concentration, because a material in a localized region slips when the stress reaches the yield strength, and fails when the stress concentration exceeds the failure strength of the material. Many research results have suggested that the microstructure features and its evolutions in a localized region are closely related to the stress field in this region [10, 11, 12, 13]. The morphological evolutions of the γ ′ precipitate and dislocation network induce the change of stress field of alloys and then result in the change of the yield strength and creep strength. Using molecular dynamics (MD) to simulate the evolution of dislocation network and atomic stress distribution at the γ /γ ′ phase interface, the construction of an atomic model has great influence on the microstructure evolution and calculation accuracy of atomic stress. In the previous works [7, 8, 14], the evolution of dislocation network at the γ /γ ′ phase interface was studied by MD simulation, and the relation between the mechanical properties of the phase interface and the evolution of the dislocation network was explored. However, it lacks the analysis of atomic stress field in the process of the evolution of dislocation network at the γ /γ ′ phase interfaces. Moreover, MD simulations in these work were carried out by using a simple two-layer lamellar structure model, which did not consider the cubical γ ′ precipitate with a fraction of 70 vol% embedded in the γ matrix, resulting in an inaccurate calculation of the atomic stress field, and it is also hard to give a real image of geometry and physical processes of dislocation evolution. Since the mechanical properties are strongly dependent on the morphological evolution of the γ ′ precipitates and dislocation network, it is important to investigate the microstructure evolution and relation with the local stress field, which can be a great help for further understanding of the physical mechanisms responsible for the better creep resistance of the Ni-based single-crystal superalloys.
In this work, MD simulations were performed to investigate the atomic local stress field and evolution of dislocation network at γ /γ ′ phase interface of Ni-based single-crystal superalloys under 0, 100 and 300 K. The MD model used a three-dimensional cubic unit and ensures that the fraction of γ ′ is about 70 vol%, which is similar to the structure of the actual materials. The objective of the present work was to explore the stress distribution characteristics of Ni-based single-crystal superalloys during the evolution of dislocation network under temperature and to offer an explanation for the influence of the temperature on the evolution of dislocation network and stress distribution.
In the present study, MD simulations were performed for the idealized Ni-based superalloy composed of Ni3Al cuboidal precipitates (L12γ ′ phase) and the pure Ni matrix (fcc γ phase). It is natural for real materials that the γ matrix is not pure Ni, and the γ /γ ′ microstructure has small amounts of other elements such as W or Co. However, the model presented was simplified in order to extract the fundamentals of dislocation behavior. As we know, the lattice mismatch corresponds to the deformation of an unconstrained lattice, and the mismatch δ was defined as the normalized difference of the lattice parameter of the γ and γ ′ phases, given by
$$\delta = \frac{{2(\alpha_{{\gamma^{{\prime }} }} - \alpha_{\gamma } )}}{{\alpha_{{\gamma^{{\prime }} }} + \alpha_{\gamma } }}, \ \ (1)$$
where α γ is 0.352 nm [15] and \(\alpha_{{\gamma^{{\prime }} }}\) is 0.3573 nm [16] or 0.362 nm [17], i.e., δ for the γ /γ ′ phase system is 1.5 or 2.8%.
When the mismatch exceeds the elastic limit, misfit dislocations will be formed on the phase interface to reduce the strain energy of the system. Considering the concept of coincidence site lattice on the misfit phase interface, the misfit is described by
$$n\alpha_{{\gamma^{{\prime }} }} = (n + 1)\alpha_{\gamma }, \ \ (2)$$
where n is the n-fold of the lattice parameter. For the current γ /γ ′ phase system, this yields
$$n = \frac{{\alpha_{\gamma } }}{{\alpha_{{\gamma^{{\prime }} }} - \alpha_{\gamma } }}, \ \ (3)$$
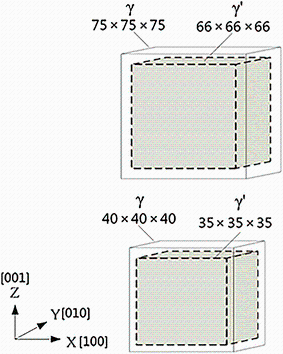
When α γ = 0.352 nm and \(\alpha_{{\gamma^{{\prime }} }}\) = 0.3573 nm, n = 66; α γ = 0.352 nm and \(\alpha_{{\gamma^{{\prime }} }}\) = 0.362 nm, n = 35. It indicates that within this range of the misfit a phase interface formed by 66 γ ′ and 67 γ or (35 γ ′ and 36 γ ) lattice distances should relax the stress induced by the different lattice parameters.
Based on the idea of constructing the γ /γ ′ interface [17, 18], it can be understood easily that a γ ′ structural unit of 66 × 66 × 66 (or 35 × 35 × 35) (defining the side length of the cuboidal γ ′ precipitate) has almost the same volume and shape as a γ structural unit of 67 × 67 × 67 (or 36 × 36 × 36). Then by substituting the γ ′ structural unit for the γ structural unit, which has more atoms, but approximately the same size, in the center of a 75 × 75 × 75 (or 40 × 40 × 40) γ block with the same lattice directions, the initial unit cell of the γ /γ ′ interface model can be obtained, as shown in Fig. 1. In this model, the cuboidal γ ′ precipitate will not be squeezed by the γ matrix, and the γ ′ fraction of the model is (67/75)3 ≈ 71 vol% or (36/40)3 ≈ 73 vol%, which is in agreement with the experimental value (about 70 vol%). Moreover, the orientations of crystal lattices in the models were all arranged along the [100], [010] and [001] directions as indicated inFig. 1.
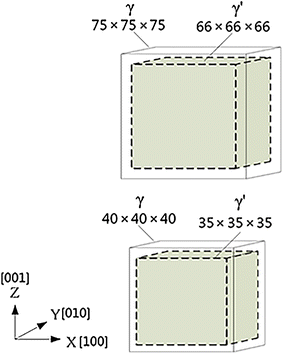 | Fig. 1 Geometry for atomistic calculations |
In order to eliminate the surface effect, the initial model was relaxed by MD calculation under the periodic boundary conditions. The Voter-Chen-type (VC) embedded atom method (EAM) potential is used [16], which is successfully applied to study the misfit dislocation motion and evolution in the Ni/Ni3Al interface [18, 19, 20, 21, 22].
Since the lattice misfit causes the stress field at the interface, the coherent phase interface is unstable. Based on the principle of minimum energy, the atoms on the phase interface will rearrange in order to minimize the elastic stress field between γ and γ ′ phase. To study the effects of temperature on the stress field and microstructure deformation, three different temperatures 0, 100 and 300 K were applied. The MD simulations were carried out by integrating Newton’ s equations of motion for all atoms using a time step of 3.0 × 10⁻¹⁵ s. The temperature was kept constant during the simulations, which was achieved by scaling all atoms’ instantaneous velocities with the appropriate Maxwell-Boltzmann distribution at a specified temperature. The open-source MD code LAMMPS [23] and the visualization tools AtomEye [24] were used in the atomistic simulations. The atomic configurations and their evolutions were analyzed by centro-symmetry parameter (CSP) proposed by Kelchner et al. [25], which can provide details of the dislocation motion and evolution in the Ni/Ni3Al interface.
To study the nanoscale mechanical behavior and investigate the atomic stress field of alloys during the evolution of dislocation network at the γ /γ ′ phase interface, the atomistic stress definition was employed in this work. The atomic stress at an atom i is a stress quantity at the atomic scale. It is a strength measurement of the interatomic interactions of the atom with its neighboring atoms. This atomic stress tensor is defined as [26] $$\sigma_{\alpha \beta } \left( i \right) = - \frac{1}{{2\varOmega_{i} }}\sum\limits_{j \ne \left( i \right)}^{N} {f_{\alpha } } \left( {i, j} \right)r_{\beta } \left( {i, j} \right), \ \ (4)$$
where N is the number of atoms in a region around atom i within an EAM potential cutoff distance (which is 4.80 Å for Ni and 4.04 Å for Al), fα (i, j) is the vector component form of the interaction force exerted by atom j on atom i, rβ (i, j) is the vector component form of the relative position from atom j to atom i, and Ω i is the volume of atom i given by
$$\varOmega_{i} = \frac{4}{3}\pi R_{i}^{3}, \ \ (5)$$
where Ri is the radius of the atom i.
Taking an average over the volume around atom i within the potential cutoff distance, the average atomic stress tensor \(\bar{\sigma }_{\alpha \beta } \left( i \right)\) at atom i is given by [27] $$\bar{\sigma }_{\alpha \beta } \left( i \right) = \frac{1}{N}\sum\limits_{j = 1}^{N} {\sigma_{\alpha \beta } \left( j \right)}, \ \ (6)$$
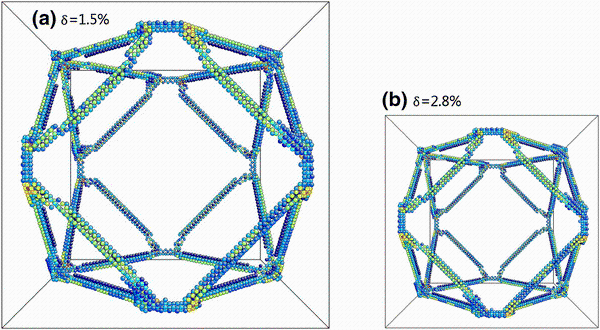
The two MD models with different types of mismatch (δ = 1.5 or 2.8%) were selected to perform MD relaxation, and then, a closed three-dimensional misfit dislocation network appeared at γ /γ ′ phase interfaces of two models after 300 ps relaxation. Figure 2 shows the morphologies of misfit dislocation network for the two types of misfit degrees at T = 0 K. The microstructure morphologies of dislocation network at γ /γ ′ phase interfaces are shown by the CSP. It can be seen from Fig. 2 that the morphologies of misfit dislocation network are the same for two different misfit degrees δ , but they are not the same in the side lengths, and the dislocation network with a mismatch δ = 1.5% has larger side length than the dislocation network with a mismatch δ = 2.8%. Zhu and wang [21] found that the dimension of the misfit dislocation network (d) is correlated with the mismatch parameter δ :
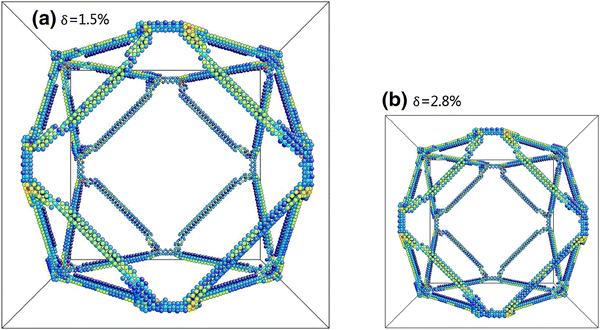 | Fig. 2 Morphology of misfit dislocation network for two different mismatch parameters at T = 0 K: a δ = 1.5%; b δ = 2.8% |
$$d \propto \left( {\frac{1}{\delta } + \frac{1}{2}} \right)\alpha_{\text{r}} \approx \frac{{\alpha_{\text{r}} }}{\delta }.\ \ (7)$$
This equation indicates that the larger the δ is, the smaller the side length d is. The simulation results are supported by the results in Ref. [21]. Therefore, the shape of dislocation network is independent of the mismatch parameter δ , which only causes the change in the side length of the dislocation network, and the larger the δ is, the smaller the d is.
Since the shape of dislocation network at γ /γ ′ phase interface is independent of the mismatch parameter δ , and the γ ′ fraction is in agreement with the experimental value (about 70 vol%), the model with the mismatch parameter δ = 2.8% is chosen to carry out MD simulations for saving computational time and memory. Figure 3 shows the evolution of dislocation network at T = 300 K. As it can be seen in Fig. 3a, the shape of dislocation network still keeps roughly the mosaic structure at t = 10 ps. Subsequently, as increasing the time steps, some kink deformation occurs at t = 120 ps, as shown in Fig. 3b. When the relaxation time is further increased, at t = 300 ps, emission of dislocations from the γ matrix and a few slip dislocations in the γ matrix cut into the γ ′ phase during the evolution of dislocation network, as shown in Fig. 3c. Zhu et al. [18] by MD relaxation found the shape of the dislocation network finally evolved into a regular hexahedron from an original tetrahedron at T = 5 K. In the current MD relaxation at T = 300 K, we find that the dislocations emit in the γ matrix and a local damage occurs during the evolution of dislocation network after 300 ps relaxation (see Fig. 3c). Once the dislocation network is damaged at the γ /γ ′ interfaces, the dislocation network lose the co-coordinating role of maintaining the dynamic equilibrium; the slip dislocations in the γ matrix may cut into the γ ′ phase from the interfaces where dislocation network is damaged. From the simulated results, it can be concluded that the shape of the dislocation network gradually becomes irregular till damage if a sufficient high temperature and full relaxation time are applied. Moreover, the slip dislocations in the γ matrix can cut into the γ ′ phase from the γ /γ ′ interfaces due to the local damage of the dislocation network.
 | Fig. 3 The evolution of the dislocation networks at the γ /γ ′ interface under 300 K for different relaxation times: at = 10 ps; bt = 120 ps; ct = 300 ps |
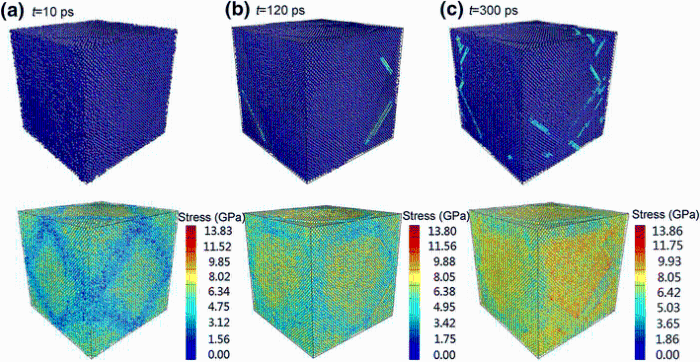
As described in experimental observations of [001] alloy, the main deformation feature of the alloy is the dislocation movement in the γ matrix [9]. The deformation is firstly generated in the γ matrix phase, and dislocations are only emitted in the γ matrix phase [9]. The emission of dislocation is linked to the stress field in a localized region, when stress increases up to the yield strength of material in a localized region which initiates slip [28]. Figure 4 shows the dislocation motion and stress field in the alloy at different time steps (the contour plot stands for the atomic tensile stress variation at different sites). At t = 10 ps, the analysis of microstructure shows that there is no dislocation found in the γ matrix phase in the initial relaxation period, as illustrated in Fig. 4a. At t = 120 ps, the stress increases gradually in the γ matrix phase and reaches sufficient level to initiate slip dislocations; it is observed that the a/2 [110] dislocations emit in the γ matrix, the angle between the dislocation slip traces and the horizontal interface is 45° , as shown in Fig. 4b, and the dislocation mechanisms are in good agreement with the experimental observations [4, 9] and previous computational simulation [7]. The stress in the γ matrix phase further increases with the increase in relaxation time (t = 300 ps). Meanwhile, the increase in the atomic stress in the γ matrix phase, which leads to a large number of dislocations, occurs in the γ matrix phase (see Fig. 4c).
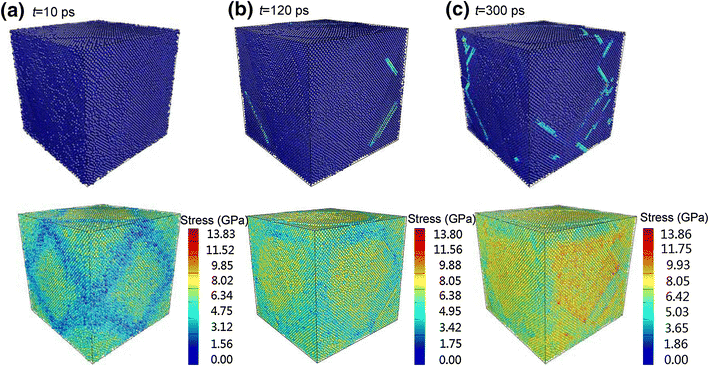 | Fig. 4 The microstructure evolution and relation to the stress field in the γ phase at different relaxation times: at = 10 ps; bt = 120 ps; ct = 300 ps |
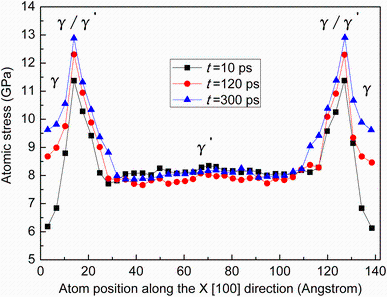
To provide a more quantitative understanding of stress field of the alloy at different time steps, the averaged atomic tensile stress as a function of the atom position along the [100] (X) direction is plotted in Fig. 5. Due to the lattice mismatch of the γ and γ ′ phases, the atoms at the γ /γ ′ phase interfaces have the highest tensile stress values for three different relaxation times. At T = 300 K, with the increase in relaxation time, the highest tensile stress value at the γ /γ ′ phase interfaces slightly increases, because the dislocation network can effectively relax the mismatch stress at the γ /γ ′ phase interfaces, and the mismatch stress will increase when the dislocation network begins to deform and damage under the temperature. Furthermore, the averaged atomic tensile stress values in the γ matrix phase are distinctly different. At t = 10 ps, the tensile stress value is about 6 GPa in the γ matrix phase. With the increase in time step, the stress values of γ matrix phase at t = 120 ps and t = 300 ps are approximately 8.5 and 9.5 GPa, respectively, as shown in Fig. 5. Meanwhile, the initiation and emission of dislocations occur in the γ matrix phase at such stress levels. It reveals that the stress field of the γ matrix phase increases with the increase in time step; the emission and number of dislocations are closely related to the stress field of the γ matrix phase.
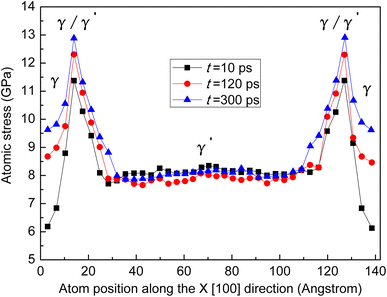 | Fig. 5 The averaged atomic tensile stress as a function of the atom position at different relaxation times |
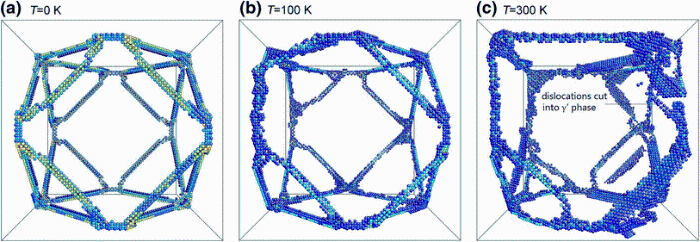
Figure 6 shows the structural evolution of the dislocation networks at different temperatures. The regular mosaic structure appears on the γ /γ ′ phase interfaces at the temperature of 0 K after 100 ps relaxation time, as shown in Fig. 6a. When the temperature increases, the evolutions of dislocation network and dislocation motions are different from those at 0 K. The mosaic structure of the dislocation network changes from regular to irregular at 100 K, and after 100 ps relaxation, see Fig. 6b, the mosaic dislocation network undergoes a kink and warp deformation. At T = 300 K, as shown in Fig. 6c, the dislocation network undergoes a larger deformation and generates a local damage. Once the dislocation network is damaged, slip dislocations in the γ phase cut into the γ ′ phase from the γ /γ ′ phase interfaces where the dislocation network is damaged. It reveals that the dislocation network become easier to deform and damage at a higher temperature and the existence of the fine dislocation network can effectively enhance the interface of the alloys and prevent the slip dislocations in the γ phase from moving through the γ /γ ′ phase interfaces.
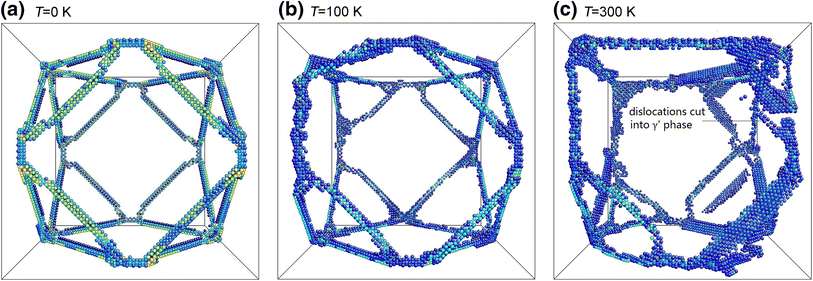 | Fig. 6 The evolution of the dislocation networks at the γ /γ ′ interface at different temperatures: a T = 0 K; b T = 100 K; c T = 300 K |
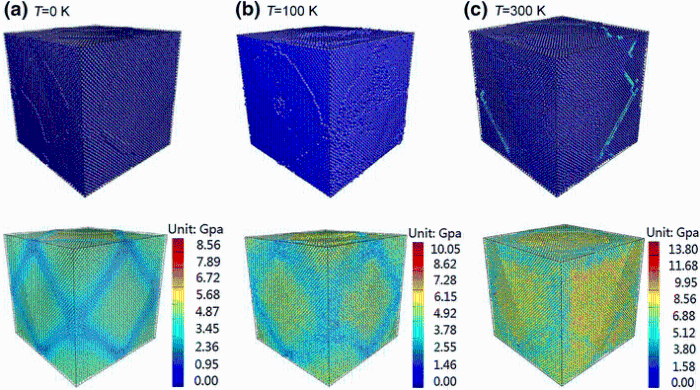
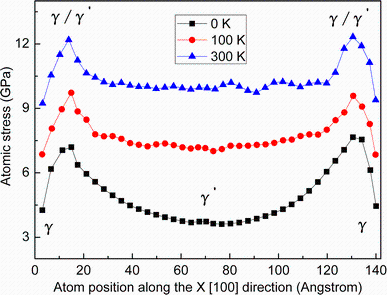
Figure 7 shows the dislocation motions and stress distribution features of the alloy at the three different temperatures. At 0 K and 100 K, the dislocation network still appears at the γ /γ ′ phase interfaces, but there is no dislocation found in the γ matrix phase, and the stress level is also lower in the γ matrix phase at t = 100 ps, as shown in Fig. 7a, b. At T = 300 K and t = 100 ps, the a/2 [110] dislocations emit in the γ matrix phase, as shown in Fig. 7c. This is mainly because the dislocation movement mechanisms are linked to the stress level in a localized region which initiates slip. At a higher temperature, not only the primary slip system is started but also the secondary slip systems can be activated at a high stress level. Comparison with the results at different temperatures of 0, 100 and 300 K, Fig. 8 clearly shows the difference of stress levels of the alloy at these three different temperatures. The maximum averaged tensile stress of the alloy is still found at the γ /γ ′ phase interface, and the stress value increases with the increase in temperature, which indicates that the mismatch stress becomes higher at a higher temperature. Furthermore, the averaged tensile stress values of γ phase also increase with the increase in temperature, and the stresses are approximately 4.5, 7.0 and 9.0 GPa at the 0, 100 and 300 K, respectively. The stress increases in the γ phase with increase in the temperature, which can effectively promote the dislocation movement, and the number of the dislocation also increases in the γ phase.
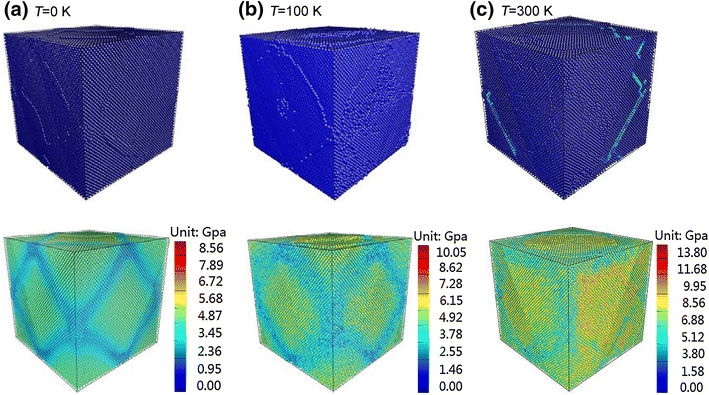 | Fig. 7 The microstructure evolution and relation to the stress field in the in the γ phase at different temperatures: a T = 0 K; b T = 100 K; c T = 300 K |
 | Fig. 8 The averaged atomic tensile stress as a function of the atom position at different temperatures |
A regular three-dimensional misfit dislocation network (mosaic structure) appears on the γ /γ ′ phase interfaces at T = 0 K after MD relaxation, the shape of dislocation network independent on the mismatch parameter δ , which only causes the change in the side length of the dislocation network.
(1) Under the influence of the temperature, the mosaic structure of dislocation network gradually becomes irregular till damage. Meanwhile, with increase in the temperature, dislocations emit in the γ matrix phase and cut into the γ ′ phase from the γ /γ ′ phase interfaces where the dislocation network is damaged.
(2) The dislocation motion is closely related to the stress level in the γ matrix phase, the dislocation firstly emits in the γ matrix phase, the number of dislocation increases when the stress caused by the temperature increases, and the peak stress occurs at the γ /γ ′ phase interfaces where the dislocation network is formed.
Acknowledgments:The authors gratefully acknowledge Prof. Ya-Fang Guo from Beijing Jiaotong University for her helpful discussion and suggestions. This work was financially supported by the National Natural Science Foundation of China (Nos. 11102139 and 11472195) and the Natural Science Foundation of Hubei Province of China (No. 2014CFB713).
The authors have declared that no competing interests exist.
| [1] |
|
| [2] |
|
| [3] |
|
| [4] |
|
| [5] |
|
| [6] |
|
| [7] |
|
| [8] |
|
| [9] |
|
| [10] |
|
| [11] |
|
| [12] |
|
| [13] |
|
| [14] |
|
| [15] |
|
| [16] |
|
| [17] |
|
| [18] |
|
| [19] |
|
| [20] |
|
| [21] |
|
| [22] |
|
| [23] |
|
| [24] |
|
| [25] |
|
| [26] |
|
| [27] |
|
| [28] |
|