


Magnetic, Dielectric and Complex Impedance Properties of xBa0.95Sr0.05TiO3-(1 - x)BiFe0.9Gd0.1O3Multiferroic Ceramics
[M. J. Miah1, 2  , A. K. M. Akther Hossain
1 ]
, A. K. M. Akther Hossain|
|


xBa0.95Sr0.05TiO3-(1 - x)BiFe0.9Gd0.1O3 [ xBST-(1 - x)BFGO] ( x = 0.00, 0.10, 0.20 and 0.25) multiferroic ceramics were prepared by the standard solid-state reaction technique. Structural characterization was performed by X-ray diffraction. All the samples showed rhombohedral distorted perovskite structure. Surface morphology of the ceramics was studied by the field emission scanning electron microscope (FESEM). From the FESEM observation, the grain size was observed to be decreased with increasing BST content. Enhanced magnetic properties were observed in BFGO with the increase in BST content because of large lattice distortion. The complex initial permeability increased with the increasing of BST content. The study of dielectric properties showed that the dielectric constant increased, whereas dielectric loss decreased with increasing of BST content due to the reduction of oxygen vacancies. An analysis of the electric impedance and modulus with frequency was performed at different temperatures. Non-Debye-type relaxation processes occur in the compound which was confirmed from the nature of the Cole-Cole plot. The DC conductivity was found to increase with the rise in temperature which indicates the semiconducting behavior of the compound with characteristics of the negative temperature coefficient of resistance. The activation energy, responsible for the relaxation determined from the modulus spectra (0.246 eV), was found to be almost same as the value obtained from the impedance study (0.240 eV), indicating that charge carriers overcome the same energy barrier during relaxation. The frequency response of imaginary parts of electric impedance and modulus suggested that the relaxation in xBST-(1 - x)BFGO ceramics follows the same mechanism at various temperatures.
Materials that exhibit more than one ferroic orders such as ferroelectric, ferromagnetic or ferroelastic simultaneously in the same phase are known as multiferroic. Multiferroic materials have potential applications in practical electronic devices such as actuators, transducers, sensors, optical filters and memory devices for data storage [1]. But there are very few single-phase materials in nature which exhibit ferroelectric and ferromagnetic properties simultaneously. Empty d-orbitals are required for ferroelectric properties as opposed to ferromagnetism, which results from partially filled d-orbitals. Although both of these criteria are not feasible to be found in the same material, BiFeO3 (BFO) is one of the materials which carry both of these properties and exhibit multiferroic properties at and above room temperature [2]. It is believed that the 6 s2 lone-pair electron configuration of Bi3+ ions is responsible for ferroelectric properties of BFO, whereas it shows (anti)ferromagnetic properties due to the super-exchange interaction between the Fe3+ ions [3]. Applications of BFO are restricted because of its some serious problems such as large leakage current, low dielectric constant, high coercive field, weak magnetic behavior and poor perovskite phase stability.
To stabilize the perovskite phase and to improve the electric, magnetic and magnetoelectric properties of BFO, researchers have developed several solid solutions of BFO and other ABO3perovskite phases such as BaTiO3 (BT), PbTiO3 (PT), PbFe0.5Nb0.5O3 (PFN) [4, 5, 6, 7]. Among these, BT is the most common ferroelectric oxide. Solid solution of BFO and BT enhances the electrical resistivity and ferroelectric properties, and it also exhibits the relaxor behavior [8, 9, 10, 11]. Crystal structure of BFO always possesses Bi-rich secondary phases because of its slow phase formation kinetics [12]. BT helps to accelerate the formation of kinetics, and hence, no impurity phase is observed in BFO-BT solid solution. Although there is disappearance of secondary phases due to the formation of above-mentioned solid solution, the solution still shows high dielectric loss, weak ferromagnetic properties and high difference in ferroelectric Curie temperature (TC) and antiferromagnetic Neel´ temperature (TN).
BFO exhibits weak magnetic ordering because of its spiral spin structure [13]. There are several reports on enhanced dielectric, ferroelectric and magnetic properties with the addition of transition metals in B-site [14, 15] and rare earth, alkaline, alkali elements in A-site [16, 17, 18, 19, 20] of BFO. Addition of rare earth elements in B-site is very rare, but improved magnetic properties are expected by the replacement of rare earth atom because of the difference in magnetic moment between the B-site atom and some rare earth elements. On the other hand, improved dielectric properties of alkaline earth metals (e.g., Sr)-doped BT matrix are expected because of the difference in ionic radius of Ba and Sr. Ba and Sr both belong to the same group IIA in the periodic table of elements, Sr2+ (1.18 Å ) has a smaller ionic radius than Ba2+(1.35 Å ). Therefore, the substitution of Sr2+ for Ba2+ is expected to change the crystal cell volume of BT which in turn may influence the dielectric properties of the ceramics. Results on the solid solution of BT-BFO are available, but the effect of Ba0.95Sr0.05TiO3 (BST) on the magnetic and electric properties of xBa0.95Sr0.05TiO3-(1 - x)BiFe0.9Gd0.1O3 [xBST-(1 - x)BFGO] is yet to be reported. In this work, the [xBST-(1 - x)BFGO] ceramics were synthesized by the conventional solid-state reaction technique. This paper highlights the effects of Ba0.95Sr0.05TiO3 on crystal structure, magnetic properties, electric properties and impedance spectroscopy of [xBST-(1 - x)BFGO] (x = 0.00, 0.10, 0.20 and 0.25) ceramics sintered at 950 ° C for 1 h.
xBST-(1 - x)BFGO (x = 0.00, 0.10, 0.20 and 0.25) ceramics were prepared by the standard solid-state reaction technique. Raw materials of BaCO3 (99.9%), SrCO3 (99.9%), TiO2 (99.9%), Bi2O3 (99.9%), Fe2O3 (99.9%) and Gd2O3 (99.95%) were mixed according to the stoichiometric formula and ball-milled in distilled water for 24 h to increase the degree of mixing. Mixed powders were calcined at 850 ° C for 1 h. To obtain a homogeneous mixture, the calcined powders were ground thoroughly and ball-milled again. Then the mixture was mixed with 10 wt% polyvinyl alcohol (PVA) as a binder for granulation. From these powders, disk- and toroid-shaped samples were prepared using a uniaxial press of 45 MPa. Finally, the green pellets were sintered for 1 h at 950 ° C.
Crystal structure of the samples were characterized by X-ray diffraction (XRD, Philips PANalytical X’ PERT PRO) with a Cu anode (CuKα radiation source with λ = 1.541 Å ) at room temperature with 1 deg/min scanning speed by collecting the data in a 2θ range of 20° -60° . The lattice parameters were calculated from the XRD data. The bulk density (ρ B) of each sample was calculated using the relation: 

The magnetic hysteresis loops (M-H curves) were measured using a vibration sample magnetometer (VSM, Micro Sense, EV9) at room temperature. The real part ( 


Figure 1 shows the XRD patterns of BFO and xBST-(1 - x)BFGO (x = 0.00, 0.10, 0.20 and 0.25) ceramics sintered at 900 and 950 ° C, respectively. Two impurity peaks indicated by the symbols ‘ * ’ and ‘ Δ ’ have been observed in the XRD pattern of BFO (Fig. 1a) because of the slow phase formation kinetics of BFO. The impurity peaks might be due to the formation of Bi2Fe4O9 and Bi24Fe2O39. The XRD patterns of BFO exhibit rhombohedrally distorted perovskite structure, and the lattice parameters are found to be a = b=5.58 Å and c = 13.65 Å . On the other hand, no impurity phase is seen in the XRD patterns of xBST-(1 - x)BFGO ceramics (Fig. 1b), and no peak of BST is found which indicates that BST has mixed with BFGO properly. As shown in Fig. 1b, XRD peaks shift toward lower angle side with increasing BST, but there is no indication of change in basic structure of perovskite. Figure 1c shows the enlarge view of (104) and (110) peaks for all compositions. The splitting of (110) peak is observed for all compositions showing a characteristic of rhombohedral structure. The ionic radius of Gd is larger than Fe, but the radius of Ti is similar to Fe. As a result, the mixed occupation of Ba and Sr in A-site and Gd and Ti in B-site makes a random displacement. The random displacement can cause different 2θ reflection and lead to the splitting effect. All peaks of the XRD pattern have been indexed following rhombohedrally distorted perovskite structure which is equivalent to hexagonal symmetry [21]. The lattice parameters a andc are calculated by following the formula of hexagonal equivalent [21] and using the intense peaks (012) and (110). The results are in good agreement with the phase diagram of xBaTiO3-(1 - x)BiFeO3 [8, 21]. Kumar et al. [4] stated that in xBaTiO3-(1 - x) BiFeO3 solid solutions, the phase is rhombohedral when x ≤ 0.3 and is cubic when x ≥ 0.4 and finally to tetragonal for x ≥ 0.93. The lattice parameters a andc are listed in Table 1. It is observed that the value of a is increasing with increasing BST content. It is also observed that unit cell volume V is increasing with the addition of BST. Our results are consistent with the previous reports of BT-BFO system [21, 22].
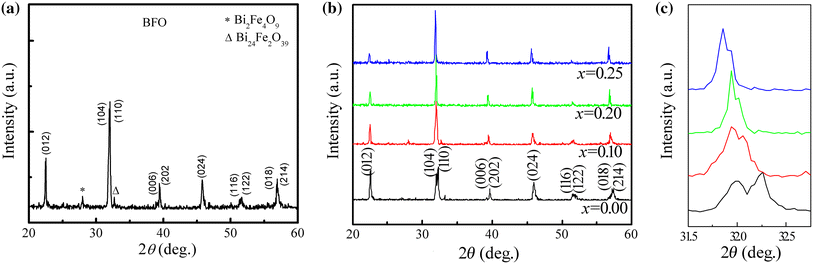 | Fig. 1 XRD patterns of BFO sintered at 900 ° C a, various xBST-(1 - x)BFGO ceramics sintered at 950 ° C b and enlarged view of (104) and (110) peaks c |
| Table 1 Lattice parameters, unit cell volume (V), bulk density (ρ B), theoretical density (ρ th), tolerance factor (t), porosity (P) and average grain size (D) |
As mentioned above that most of the intense peaks of XRD shift toward lower angle side, which indicates the increase in unit cell volume of the prepared solid solution on the addition of BST. This may also produce a distortion in the perovskite structure. The degree of distortion in the structure is calculated in terms of tolerance factor t as defined by the following equation [23]:
 |
whereRA, RB and RO are the ionic radii of A-site atom, B-site atom and oxygen, respectively. For the case of xBa0.95Sr0.05TiO3-(1 - x)BiFe0.9Gd0.1O3 compound, the above equation can be written as:
 |
where RBa2+ , RSr2+ , RBi3+ , RTi4+ , RFe3+ , RGd3+ and RO2- are the ionic radii of Ba2+, Sr2+, Bi3+, Ti4+, Fe3+, Gd3+ and O2-, respectively. The calculated value of t for xBST-(1 - x)BFGO is listed in Table 1. The value of t varies from 0.847 to 0.868, and it is obvious that the value of t is increasing, which indicates that the perovskite structure of xBST-(1 - x)BFGO becomes more stable with increasing BST content. Structure of BST is more stable than BFGO, hence the overall stability increases with increasing BST concentration.
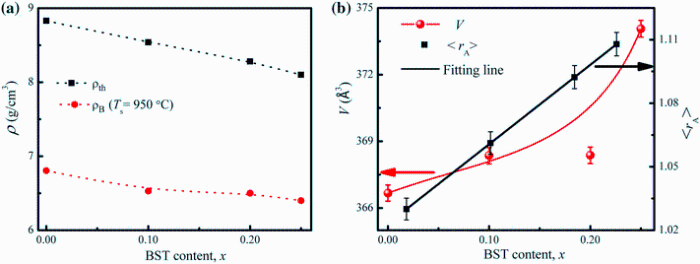
Figure 2a shows the variation of bulk density (ρ B) and theoretical density (ρ th) of xBST-(1 - x)BFGO ceramics sintered at 950 ° C for 1 h as a function of BST content. It is seen that both ρ B and ρ th decrease with the addition of BST content. It is also appeared that the value of ρ B for all the compositions is lower than that of the corresponding ρ th. This may be due to the presence of some pores in the bulk samples which may be formed and developed during the samples preparation or sintering process (percentage of porosity is given in Table 1). The decrease in density with the increase in BST content may be attributed to the fact that the molecular weight of BST (230.70 g/mol) is lower than that of BFGO (322.96 g/mol). The addition of BST in BFGO leads to a variation in bonding and makes a change in inter-atomic distance and density.
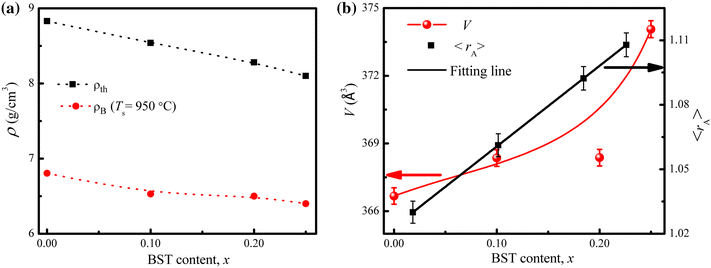 | Fig. 2 Variation of ρ th and ρ Ba, and variation of V and < rA> b with BST content of various xBST-(1 - x)BFGO ceramics sintered at 950 ° C for 1 h |
Figure 2b shows the variation of unit cell volume (V) and average ionic radius in A-site < rA> of xBST-(1 - x)BFGO ceramics with BST content. The V and also < rA> are found to increase with increasing BST content. The < rA> = x × 0.95RBa2+ + x × 0.05RSr2+ + (1 - x) × RBi3+ , where RBa2+ = 1.35 Å , RSr2+ = 1.18 Å and RBi3+ = 1.08 Å , < rA> in twelve-coordination (Shannon ionic radius) increases from 1.03 to 1.107 Å as BST increases. While in B-site, < rB> = x × RTi4+ + (1 - x) × 0.9RFe3+ + (1 - x) × 0.1RGd3+ , where RTi4+ = 0.68 Å , RFe3+ = 0.64 Å and RGd3+ = 0.94 Å , < rB> in twelve-coordination increases slightly with regard to < rA> from 0.670 to 0.675 Å . Thus, the regular enhancement of the ionic radius in the A-site cation induces a larger A-site which causes an expansion in octahedral space of the perovskite structure and ultimately results in an increase in V.
Figure 3 shows the FESEM micrographs (FESEM) of xBST-(1 - x)BFGO ceramics. All the ceramics show dense microstructure. The average value of grain size (D) is determined using linear intercept technique. The values of D are found to be in the range of 2.17-2.60 μ m which suggests that BST has an influence on the modification of grain size of xBST-(1 - x)BFGO ceramics. The addition of BST in BFGO initially increases the grain size for x = 0.10 and then decreases for higher content of BST (for x > 0.10). Maximum value of grain size is found to be 2.60 μ m for 0.1BST-0.9BFGO samples. The considerable increase in grain size for x = 0.10 may be due to the uniform grain growth, as shown in Fig. 3b. With the higher addition of BST, the populations of smaller grains are dominating over the larger grains and decrease the uniformity. Such behavior of grain growth reflects the competition between the driving force of grain boundary movement and the retarding force exerted by pores because grain growth is closely related to the grain boundary mobility. When the driving force of the grain boundary in each grain is homogeneous, the sintered body attains a uniform grain, whereas the non-uniform grain growth occurs due to the existence of inhomogeneous driving force.
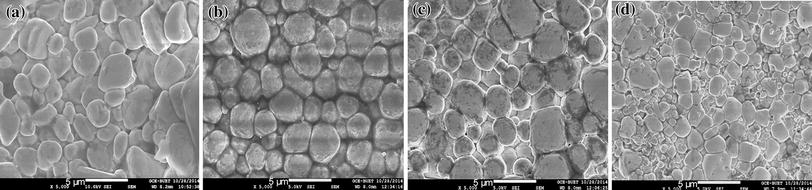 | Fig. 3 FESEM micrographs of various xBST-(1 - x)BFGO ceramics sintered at 950 ° C for 1 h: ax = 0.00; bx = 0.10; cx = 0.20; dx = 0.25 |
3.4.1 Magnetic Hysteresis Loop Measurement
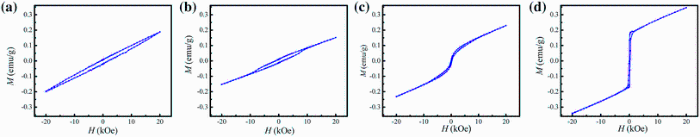
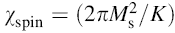
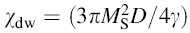
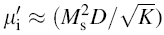
Figure 4 shows the magnetic hysteresis loops (M-H curve) of xBST-(1 - x)BFGO ceramics (sintered at 950 ° C) measured at room temperature. Significant enhancement of magnetization is observed due to the addition of BST in BFGO although all the samples are not saturated even at an applied magnetic field of 20 kOe (1592 kA/m). The values of remnant magnetization (Mr) and coercivity (Hc) have been determined. It is noticed that the values of Mr for various xBST-(1 - x)BFGO solid solution increase with the increasing BST content. The Mr is found to be 0.011-0.080 emu/g which indicates the enhancement of Mr due to the addition of BST. The highest value of Mr is found to be 0.080 emu/g for 0.25BST-0.75BFGO solid solution. The values of Mr are relatively very small as compared to other ferromagnetic compounds. Unsaturated M-H behavior and small remnant magnetization is the indication of antiferromagnetic with weak ferromagnetism [24]. The obtained result is better than that of other previously reported BFO-based materials [21, 25]. The calculated values of Mr and Hc are listed in Table 2. It is known that the Hc depends on anisotropy constant, average grain size, domain wall energy and several other factors. We calculated the anisotropy constant (K) using the following relation [26]: 
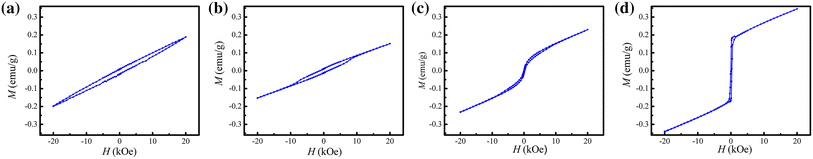 | Fig. 4 M-H hysteresis loops of various xBST-(1 - x)BFGO ceramics sintered at 950 ° C for 1 h: ax = 0.00; bx = 0.10; cx = 0.20; dx = 0.25 |
| Table 2 Remnant magnetization (Mr), coercivity (Hc) and magnetic anisotropy (K) of xBST-(1 - x)BFGO ceramics at room temperature |
BFO is basically antiferromagnetic in magnetic order with negligible magnetic moment due to its spiral spin structure [27]. By the addition of elements in both A- and B-sites, the spiral spin order can be suppressed, and as a result the latent magnetization is released [28]. The enhancement of magnetization in xBST-(1 - x)BFGO may be attributed due to the change of canting angle in Fe-O-Fe by a lattice distortion made by Ti4+, Ba2+, Sr2+ and Gd3+ ions and results a suppression of the spiral spin structure of BFGO [27, 29]. The addition of BST in BFGO only suppresses the spiral spin structure and could not destroy it completely.
3.4.2 Complex Initial Permeability
Complex initial permeability provides the information which is useful in understanding the mechanism of controlling the dynamic properties and also the adaptability of magnetic materials for high-frequency uses. The complex initial permeability is given by μ i* = 


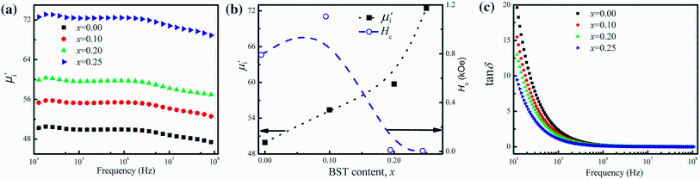
 | Fig. 5 Variation of  with frequency a, with frequency a,  and Hc with BST content b and tanδ with frequency c of various xBST-(1 - x)BFGO ceramics sintered at 950 ° C for 1 h and Hc with BST content b and tanδ with frequency c of various xBST-(1 - x)BFGO ceramics sintered at 950 ° C for 1 h |
The value 


The plot of magnetic loss, tanδ (= 

3.5.1 Dielectric Properties at Room Temperature
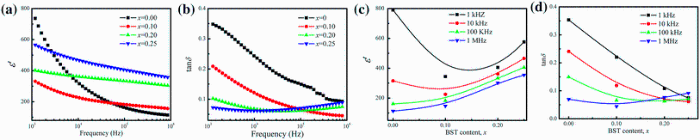
Figure 6a shows the variation of dielectric constant (ε ' ) with frequency at room temperature for xBST-(1 - x)BFGO ceramics sintered at 950 ° C for 1 h. It is observed that at low frequency, ε ' has high value and then decreases gradually with the increase in frequency. This type variation of ε ' is explained on the basis of polarization mechanisms. Contribution of different polarization mechanisms varies at different frequencies. The total polarizability may be separated into three parts: dipolar, ionic and electronic. For the case of polycrystalline compounds, there is also an interfacial or space charge polarization. The space charge polarization may originate in the prepared material from the point defects during sintering process. At low frequency, all the different types of polarization are in action, but major contribution to ε ' comes from space charge polarization. The space charges are able to follow the variation of the applied electric field at low frequency. They do not get enough time to build up and cannot follow the variation of field frequency at high frequency. This results in less contribution of space charges at high frequency toward ε ' and decrease in ε '. On the other hand, the dipolar and the ionic contributions are also small at high frequency due to the inertia of the molecules and ions.
 | Fig. 6 Variation of ε ' a and tanδ b with frequency, and dependence of ε ' c and tanδ d on BST content of various xBST-(1 - x)BFGO ceramics sintered at 950 ° C for 1 h |
Figure 6b shows the variation of dielectric loss (tanδ ) with frequency. The value of tanδ is high at low-frequency region, and then, it decreases significantly with the rise in frequency. An increasing trend at high frequency is also noticed for the case of x = 0.20 and x = 0.25 samples which may originate from polarization relaxation [34]. Dependence of ε ' and tanδ of xBST-(1 - x)BFGO ceramics on the concentration of BST at different frequency is shown in Fig. 6c and d. It is observed that the value of ε ' for all compositions is increasing with BST concentration. It is also noticed that BST added samples have lower value of tanδ than that of BFGO and tanδ is decreasing with the increase in BST. The reduction in tanδ is found to be 62.5% than that of BFGO. In BFO, a charge imbalance is created due to the volatilization of Bi3+ 

 |
Hence, oxygen vacancies are reduced when BST is mixed with BFGO. The decrement of the oxygen vacancies results in improved dielectric properties.
3.5.2 Temperature-Dependent Dielectric Properties
Figure 7a shows the variation ofε /with temperature for various xBST-(1 - x)BFGO ceramics measured at 1 kHz. Two different peaks at around 100 and 370 ° C are noticed for the case of pure BFGO ceramics. The peak at lower temperature disappears due to the addition of BST in BFGO samples. An irregularity in temperature-dependent dielectric measurements may originate from different factors such as structural transitions, magnetoelectric effect which is the intrinsic properties of multiferroic materials or the enhancement of charge carrier’ s movement to the interface for the case of polycrystalline materials [36]. The peak at around 100 ° C may be originated due to inhomogeneous mixing of constituent elements in BFGO which was also mentioned in the previous report [21]. The temperatures for which maximum dielectric constant was obtained (Tm) are calculated for all the compositions. These values are about 360, 345, 320 and 305 ° C for x = 0.00, 0.10, 0.20 and 0.25, respectively, at 1 kHz, and the Tm shows decreasing trend as x content increases. This may be attributed to the introduction of Sr2+ ions at A-site in the prepared solid solutions because Sr2+ ions have an important role to reduce the phase transition temperature [37]. However, the maximum value of dielectric constant () at Tm is found to increase from 3395 for x = 0.10 to 7158 for x = 0.25 at 1 kHz which is higher than that of BFO (≈ 40) and lower than that of BST (≈ 11, 880) [38]. This suggests that BST has an influence on the improvement of ε ' in xBST-(1 - x)BFGO ceramics.
 | Fig. 7 Variation of ε ' a and tanδ b with temperature of xBST-(1 - x)BFGO ceramics at 1 kHz frequency sintered at 950 ° C for 1 h |
Figure 7b shows the variation of tanδ with temperature for all the compositions. The value of tanδ is found increasing slowly with the increase in temperature, and after a certain temperature (≈ 250 ° C), the loss is found increasing rapidly. The existences of space charges in polycrystalline materials become more active at low frequency and also at higher temperature. The thermally activated space charges are responsible for the increment of tanδ at the higher temperature.
3.6.1 Complex Impedance Analysis
Complex impedance spectroscopy is a powerful technique to characterize many of the electrical properties of polycrystalline materials and their interfaces. It may be used to explain the dynamics of mobile or bound charges in the grain or grain boundaries. The impedance behavior is described by the classical model known as Debye model, and it is written in the form:
 |
where
 |
 |
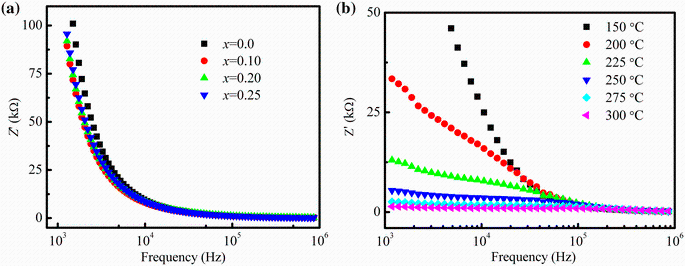
Figure 8a shows the variation of real part of impedance (Z' ) with frequency at room temperature of various xBST-(1 - x)BFGO ceramics with x = 0.00, 0.10, 0.20 and 0.25. As shown in Fig. 8a, the value of Z' gradually decreases with increasing frequency up to a certain limiting frequency (≈ 5 kHz), and then, it becomes almost frequency-independent. The decrease in Z' indicates that the conduction is increasing with frequency. The higher values of Z' at lower frequencies mean that the polarization in the ceramics is larger because at lower frequency all kinds of polarization are present. It is also observed that the value of Z' for all compositions coincides at higher frequencies. The merger of Z' at higher frequencies indicates possible release of space charge polarization [39]. Variation of Z' with frequency at different temperatures (150-300 ° C) for the composition x = 0.25 is shown in Fig. 8b. The values of Z' decrease in the low-frequency region (up to a certain frequency ≈ 100 kHz) with temperature, and then, they appear to merge at the higher frequency. This indicates that the frequency at which the space charge becomes free also depends upon the temperatures.
 | Fig. 8 Variation of Z′ with frequency at room temperature for various xBST-(1 - x)BFGO ceramics a, and at different temperatures for 0.25BST-0.75BFGO ceramics b |
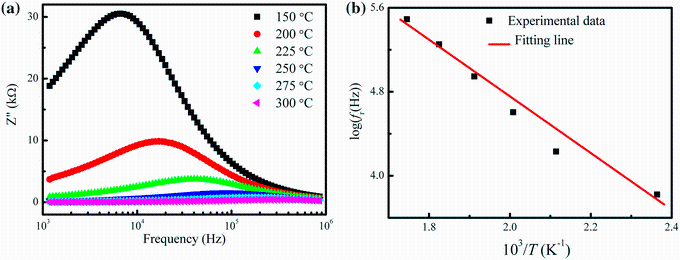
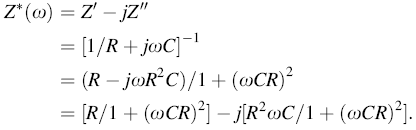
Figure 9a shows the variation of imaginary part of impedance (Z'' ) with frequency at various temperatures (150-300 ° C) for the composition with x = 0.25. The variation of Z'' with frequency exhibits a peak for all samples. At higher frequency, it also decreases with increasing temperature due to the reduction of loss in the resistive part of the sample. This plot is useful for the determination of relaxation frequency (fr) at different temperatures. Relaxation occurs in resistive materials due to the presence of immobile species at lower temperature and defects at higher temperature. As shown in Fig. 9a, the relaxation peak is found to shift toward higher frequency with increasing temperature. The values of fr have been determined from the frequency versus Z'' curves and listed in Table 3. The variation of fr with temperature follow the Arrhenius relation: fr = foexp(-Ea/KBT), where fo is the pre-exponential factor, KB is the Boltzmann constant, Ea is the activation energy for the hopping mechanism and T is the absolute temperature. Figure 9b presents the Arrhenius plot of fr for the impedance spectra. The values of Ea have been determined from the slope of the straight line and found to be 0.240 eV for the temperature region 150-300 ° C.
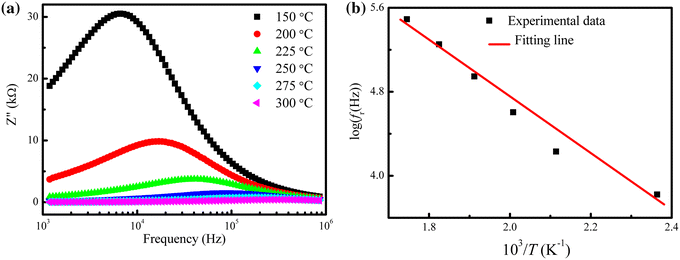 | Fig. 9 Variation of Z' ' with frequency a, and Arrhenius plot of frb for 0.25BST-0.75BFGO composition at different temperatures |
| Table 3 Values for grain resistance (Rg), grain boundary resistance (Rgb), relaxation frequency (fr), grain capacitance (Cg) and grain boundary capacitance (Cgb) of 0.25BST-0.75BFGO |
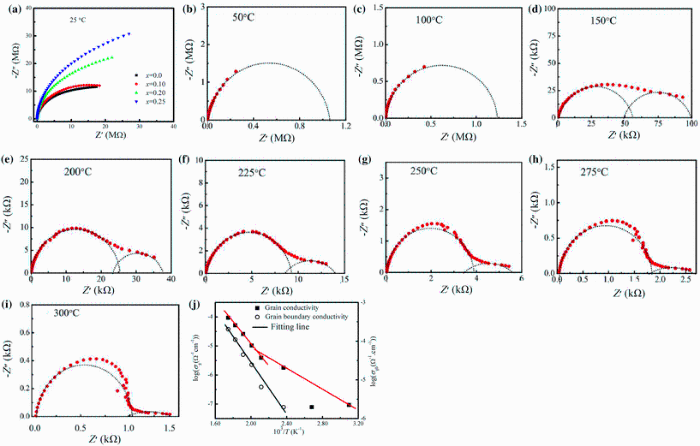
Polycrystalline ceramics consist of grains and grain boundaries. Grain and grain boundary contributions to the electrical properties of dielectric materials are normally analyzed by the complex impedance spectroscopy following brick-layer model [40]. For this, the sample is represented by an equivalent circuit which consists of three parallel RC circuits connected in series. These RC elements correspond to grains, grain boundaries and electrode-specimen interface in order of decreasing frequency. Each RC element of the equivalent circuit gives rise to a semicircle. A single semicircle in Z' versus Z'' plot indicates grain effects, and the second semicircle indicates the presence of grain boundary effects. If a third semicircle is present, it indicates the electrode effects. Figure 10a shows the plot of Z' versus Z'' (Cole-Cole plot) for different compositions of xBST-(1 - x)BFGO taken over a wide range of frequencies (20 Hz-100 MHz) at room temperature. All the compositions exhibit a single semicircular arc starting from the origin. The absence of second semicircle in the complex impedance plots indicates that the materials have only grain effect to the conductivity mechanism at room temperature. It is also realized that patterns of the semicircular arc are changing with composition which implies a modification of the resistance/reactance ratio with the changing of BST content in the ceramics. It is obvious from the figure that the diameter of the arc increases with increasing BST which suggests that the value of grain resistance (Rg) is increasing with increasing BST content. Figure 10b-i shows the Cole-Cole plot (Z' versus Z'' plot) of 0.25BST-0.75BFGO ceramic at different temperatures (50-300 ° C). A single semicircular arc is found to observe up to 100 ° C. With increasing temperature, the arc shifts toward the higher value of Z' axis. Above 100 ° C, a complete semicircle is observed on the high-frequency side and a small tail of semicircular arc on the low-frequency side. The second semicircular arc gradually spreads with further increasing temperature. The high-frequency semicircle indicates the grain property of the materials, while the low-frequency semicircular arc presents the effect for grain boundaries. The values of grain resistance (Rg) and grain boundary resistance (Rgb) have been calculated from the intercepts on the Z' axis. The grain capacitance (Cg) and grain boundary capacitance (Cgb) have been also calculated using the relations: Cg = 1/(Rgω g) = 1/(2π frRg) and Cgb = 1/(Rgbω gb) = 1/(2π frRgb). The values of these parameters are listed in Table 3.
The electrical conductivity (σ ) is a thermally activated process and important to describe electrical behavior of a material. In the present study, the DC conductivity (σ dc) is calculated using the relation σ = t/(AR), where R is the resistance of the compound (resistance of grain or grain boundary). The variation of logσ versus 103/T for both grain and grain boundary is shown in Fig. 10j. The nature of the variation for both Rg and Rgb is linear and obeys the Arrhenius relation: σ dc = σ oexp (-Ea/KBT), where the symbols have their using meanings. The values of Ea have been calculated from the slope of the logσ versus 103/T curves. For grains, the value of Ea is found to be 0.16 eV in the temperature range 50-150 ° C and 0.33 eV in the temperature range 200-300 ° C. For grain boundaries, the value of Ea is found to be 0.29 eV in the temperature range 150-300 ° C. It is observed from the Fig. 10j that in both the cases (grain and grain boundary), the σ dc increases with increasing temperature. From Table 3 it is also noticed that both Rg and Rgb decrease with the increase in temperature. It follows typical semiconductor behavior of the material with the characteristics of negative temperature coefficient of resistance (NTCR).
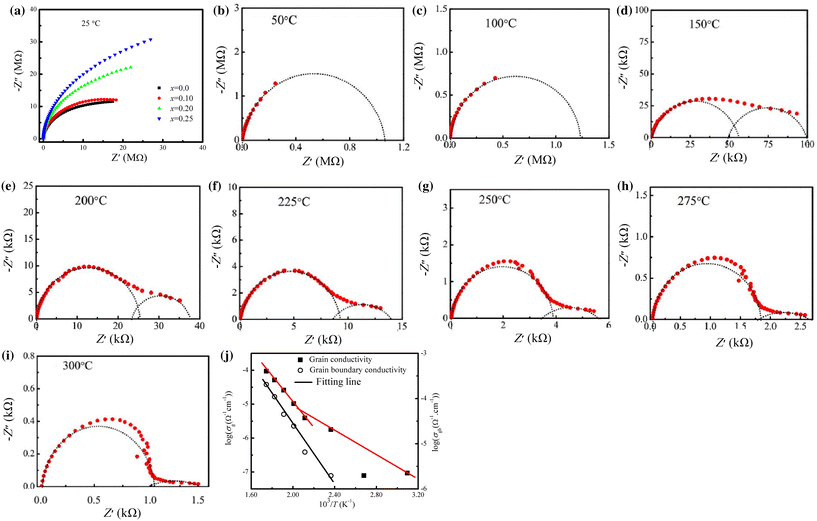 | Fig. 10 a Cole-Cole plots of Z′ and Z′ ′ at room temperature for different compositions of xBST-(1 - x)BFGO ceramics; b-i Cole-Cole plots for 0.25BST-0.75BFGO composition at different temperatures; j Arrhenius plots of grain and grain boundary conductivity for 0.25BST-0.75BFGO composition |
3.6.2 Complex Modulus Analysis
The complex modulus spectroscopy is a very convenient tool to determine, analyze and interpret the electric transport properties in the materials having the smallest capacitance. The modulus spectra are particularly useful for separating spectral components of the materials having similar resistance but different capacitance. The complex electric modulus is represented by the following expression:
 |
whereM' = ω CoZ'' and M'' = ω CoZ' , and the symbols have their usual meanings.
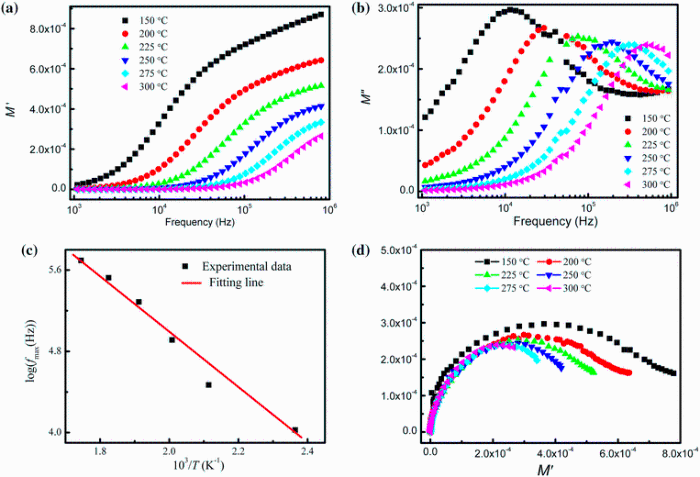
The variation of real part of modulus (M' ) with frequency at various temperatures (150-300 ° C) for x = 0.25 is shown in Fig. 11a. The value of M' is found to be very low (nearly zero) at low frequencies, and it increases with the increase in frequency. This continuous dispersion on increasing frequency may be contributed to the conduction phenomena due to short-range mobility of charge carriers. It is possibly related to the lack of restoring force leading the mobility of the charge carriers under the action of an induced electric field [41].
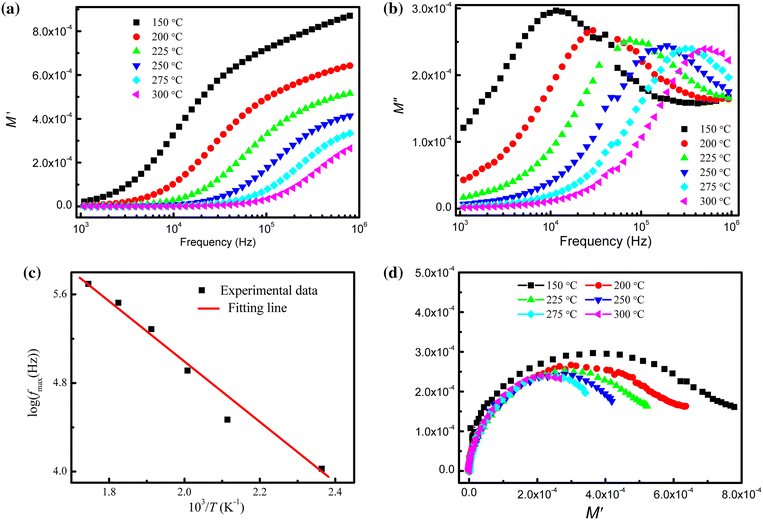 | Fig. 11 Variation of M′ a and M'' b with frequency at various temperatures, Arrhenius plot of fmaxc, and M′ versus M′ ′ curves at different temperatures d for 0.25BST-0.75BFGO composition sintered at 950 ° C for 1 h |
Figure 11b shows the variation of imaginary part of electric modulus (M'' ) for x = 0.25 with frequency at different temperatures (150-300 ° C). It exhibits a peak at the frequency above 103 Hz. These peaks indicate the transition from long-range to short-range mobility of charge carriers with the increase in frequency. The frequency region below the peak maximum determines the range in which charge carriers are mobile over long distance, whereas the region above peak maxima establishes the charge carriers are confined to potential well. It is also observed that the peaks are shifting toward higher-frequency side with the increase in temperature. This behavior indicates that the dielectric relaxation is thermally activated in this compound in which hopping mechanism of charge carriers dominate intrinsically. This type of effect has been observed in the modulus spectra of previous report [42]. The observed asymmetry in peak broadening indicates the spread of relaxation with different time constants, and hence, the relaxation in the material is of non-Debye type. Value of M'' at lower frequency is found to be low which indicates that the electrode polarization makes a negligible contribution to the material. The value of frequency at maximum M'' (fmax) has been determined from the frequency versus M'' curves. The temperature dependence of fmax curve is shown in Fig. 11c which follows the Arrhenius relation: f = foexp(-Ea/KBT), where the symbols have their using meanings. The value of Ea has been determined from the slope of the Arrhenius plot and found to be 0.246 eV which is very close to the values of Ea obtained from Z'' spectra. The closer value of the activation energies obtained from the impedance spectra and the analysis of modulus spectra suggests that the mobility of charge carrier in the compound is due to the same mechanism.
In order to avoid the uncertainty arising out of the presence of grain/grain boundary effect at different temperatures, the impedance data are re-plotted in the modulus formula. Complex impedance spectra give more emphasis to element with larger resistance, whereas complex electric modulus plots highlight those with smaller capacitance. The modulus plots of M' versus M'' at various temperatures (150-300 ° C) for x = 0.25 are shown in Fig. 11d. The modulus spectra show a change in its shape with the rise in temperature and suggest a probable change in the values of the capacitance as a function of the temperature. It is worth noting that at low frequencies, data exhibit a common origin almost identical with the origin of the graph. The coincidence of the beginning of the semicircles with the origin of the graph is a clear indication that no other relaxation process is present at lower frequencies in the studied material.
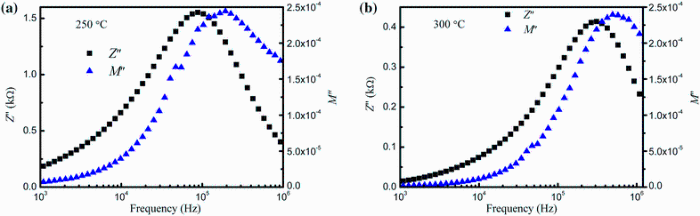
Figure 12 shows the frequency response of Z'' and M'' for x = 0.25 at 250 and 300 ° C. It is seen that the peaks of Z'' and M'' for both cases do not coincide which indicates that non-Debye-type relaxation is present in this compound. For a Debye-type relaxation, the peaks of both impedance and modulus plots should coincide. Any departure from this suggests non-Debye-type relaxation. Moreover, the frequency versus Z'' and M'' combined plots are used to distinguish whether a particular relaxation process in the material is due to the long-range movement of the charge carriers or the short-range movement of the charge carriers. The non-coincidence of the peaks corresponding to Z'' and M'' suggests that the relaxation is due to the short-range movement of charge carriers which was also observed in M' versus frequency spectra.
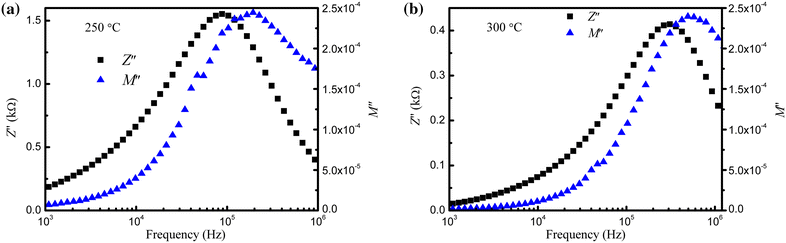 | Fig. 12 Frequency responses of Z′ ′ and M′ ′ at 250 ° C a and 300 ° C b for 0.25BST-0.75BFGO composition sintered at 950 ° C for 1 h |
In summary, polycrystalline xBST-(1 - x)BFGO (x = 0.00, 0.10, 0.20 and 0.25) ceramics were successfully prepared using conventional solid-state reaction technique. XRD pattern confirmed that the ceramics had a rhombohedral distorted perovskite structure up to the BST concentration 0.25 at room temperature. The average grain size was found to be in the range of 2.17-2.60 μ m. Incorporation of BST into Gd-doped BFO improved magnetic properties at room temperature because of arising distortion in lattice structure. A remnant magnetization of about 0.08 emu/g was obtained for x = 0.25. Mechanical barrier to move domain wall has been reduced by the addition of BST in BFGO which results to increase initial permeability of xBST-(1 - x)BFGO ceramics. The improvement of complex initial permeability was consistent with DC magnetization measurement. The xBST-(1 - x)BFGO ceramics exhibited higher dielectric constant than BFO, and the value of the dielectric constant increased with BST content. Temperature-dependent complex impedance analysis was used to separate the grain and grain boundary resistance. The ceramics showed semiconducting behavior with negative temperature coefficient of resistance (NTCR). The analysis of the electric modulus confirmed the presence of hopping mechanism in the compound. The temperature dependence of relaxation phenomena was found to occur in the materials. The near value of the activation energies obtained from the electric impedance and modulus suggested that the relaxation process occurs by the same mechanism in the compound.
The authors greatly acknowledge the CASR Grant No. 253(21), Bangladesh University of Engineering and Technology, Bangladesh, for providing financial support for this research. One of the authors M.J. Miah thanks the Ministry of National Science, Information & Communication Technology (NST), Government of the People’s Republic of Bangladesh for providing fellowship.
The authors have declared that no competing interests exist.
| [1] |
|
| [2] |
|
| [3] |
|
| [4] |
|
| [5] |
|
| [6] |
|
| [7] |
|
| [8] |
|
| [9] |
|
| [10] |
|
| [11] |
|
| [12] |
|
| [13] |
|
| [14] |
|
| [15] |
|
| [16] |
|
| [17] |
|
| [18] |
|
| [19] |
|
| [20] |
|
| [21] |
|
| [22] |
|
| [23] |
|
| [24] |
|
| [25] |
|
| [26] |
|
| [27] |
|
| [28] |
|
| [29] |
|
| [30] |
|
| [31] |
|
| [32] |
|
| [33] |
|
| [34] |
|
| [35] |
|
| [36] |
|
| [37] |
|
| [38] |
|
| [39] |
|
| [40] |
|
| [41] |
|
| [42] |
|