An Algorithm to Analyze Electron Backscatter Diffraction Data for Grain Reconstruction: from Methodology to Application
|
An Algorithm to Analyze Electron Backscatter Diffraction Data for Grain Reconstruction: from Methodology to Application |
| Xue-Hao Zheng, Hong-Wang Zhang |
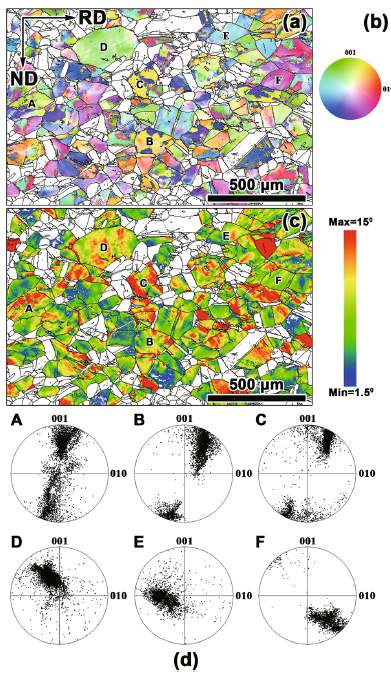
| Fig. 6 Rotation axis map a and rotation angle map c for the 136 reconstructed grains. The color scheme used in a is shown in b. Stereographic projections of rotation axes for six typical grains (marked by “A”-“D”) are shown in d. The black lines in a and c represent boundaries with misorientation angles larger than 5° |
|
|