Nian-Wei Dai, Jun-Xi Zhang, Qi-Meng Chen, Xin Zhang, Fa-He Cao, Jian-Qing Zhang. Influence of Direct Current Electric Field on the Formation, Composition and Microstructure of Corrosion Products Formed on the Steel in Simulated Marine Atmospheric Environment. Acta Metallurgica Sinica(English Letters), 2016, 29(4): 373-381
Copyright reserved, Editorial board of Acta Metallurgica Sinica(English Letters)
Influence of Direct Current Electric Field on the Formation, Composition and Microstructure of Corrosion Products Formed on the Steel in Simulated Marine Atmospheric Environment
1 Shanghai Key Laboratory of Materials Protection and Advanced Materials in Electric Power, Shanghai University of Electric Power, Shanghai 200090, China
2 Department of Chemistry, Zhejiang University, Hangzhou 310027, China
X-ray diffraction, Raman spectroscopy and scanning electron microscopy were employed to investigate the effects of the DC electric field on the composition, formation and structure of corrosion products formed on the surface of the steel immersed in NaCl solution. The results show that goethite (α-FeOOH), akaganeite (β-FeOOH), lepidocrocite (γ-FeOOH) and magnetite (Fe3O4) are the major constituents among the corrosion products. The arrangement of different levels of the DC electric field intensity gives rise to the following results. The little higher DC electric field intensity (around 100-200 kV/m) promotes the crystallinity and growth of γ-FeOOH; obviously, much higher DC electric field intensity (greater than 400 kV/m) prevents the growth of α-FeOOH and facilitates the generation of Fe3O4. Both the promotional growth of γ-FeOOH and suppression of α-FeOOH growth indicated the weakness of the protectiveness of the rust layer. Consequently, the suppression of the transformation of α-FeOOH from γ-FeOOH favors the yield of the Fe3O4, which works as a large cathode area and would be about to quicken the subsequent steel corrosion.
Steel is most commonly employed as metallic material in open-air environment and is widely used in equipment and metallic structures due to its low cost and excellent mechanical strength [1, 2, 3, 4]. Considerable efforts have been dedicated to investigate the corrosion of the steel in various environments where the steel services in, especially the atmospheric surroundings containing anions [4, 5, 6]. Information about the formation and composition of corrosion products could be obtained according to these studies. It is well known that α -FeOOH, β -FeOOH, γ -FeOOH and Fe3O4 are the major constituents, as well as some poorly crystallized iron oxides [3, 7]. These products can coexist partly as crystalline and partly as amorphous structures, the relative amounts of which vary depending on the different environmental conditions [8]. It has been pointed out that a rust layer formed on a steel surface exceedingly influences the successive corrosion behavior. Furthermore, the type of oxide layers formed on their surfaces primarily governed the corrosion rate of the steel in a climatic condition [5, 9]. It is reported that α -FeOOH is the most thermodynamically stable phase out of all these oxide products [10]. During the initial stages, as a main constituent, γ -FeOOH is formed which subsequently transforms to α -FeOOH, and once a stable layer of α -FeOOH on an iron surface proceeds, the corrosion rate of the steel is considerably reduced [11]. According to Carbucicchio et al. [12], the presence of β -FeOOH which is an instable phase of iron oxide was detected in the solution containing chlorine. Tanaka et al. [13] studied the reaction between Fe3O4 and FeOOH, when the iron powder treated with γ -FeOOH, α -FeOOH and β -FeOOH to generate Fe3O4, and the results exhibited that the amount of formed Fe3O4 particles was in the order of β -FeOOH ≫ γ -FeOOH ≫ α -FeOOH. Hao et al. [14] investigated the atmospheric corrosion of MnCuP weathering steel in simulated coastal and coastal-industrial atmosphere and found that the corrosion resistance of rust layer was improved by the increase in α -FeOOH content and decrease in Fe3O4 one. It is believed that the stability and structure of the various corrosion products reflect the protective ability of the rust layer.
Additionally, the morphology of the corrosion products formed on the steels has been observed by many authors, and the information on the structural characteristic of these products can be acquired [15, 16, 17, 18]. Among the rust layers, γ -FeOOH appears as small crystalline globules (sandy crystals) or as flowery structures, which consist of many fine plates [16]. While α -FeOOH exhibits as globular structures known as cotton balls (semicrystalline α -FeOOH) or even as acicular structures (crystalline α -FeOOH). And β -FeOOH appears with cotton ball or rosette morphology. Fe3O4 is more difficult to be observed, which usually comes out as dark flat regions.
Furthermore, it is necessary to point out that most of the studies for characterization of corrosion products reported in the literature pertain to the oxides formed only in some simulated solution, but ignored the other typical environments where metal was put to work. For the applications of the steels, many steel-made devices are used under the DC electric field in the atmospheric environment, for example, the steel parts in high-voltage transmission lines which generate a high DC electric field. It is obviously found that these devices or metal parts corrode in a higher rate than in other conditions. Recently, according to some researchers, the existence of homogeneous DC electric field has a huge influence on the structure and growth of crystal [19, 20]. Lu et al. [21] investigated the effect of the DC electric field on the phase transitions of ferroelectric thin film. Zhao et al. [22] studied the solidification of the metal under DC electric field and concluded that the presence of DC electric field alters the electromigration of the metal ions, as well as the size of metal crystal particles. Considering these reasons, it is believed that the existence of the DC electric field, as another critical factor, affects the formation and crystallization of the corrosion products mentioned above, which further influenced the protective ability of the layers and subsequent corrosion process. Unfortunately, the studies on the effect of the DC electric field on the corrosion of the steels have little been reported before. It therefore possesses a great significance to explore the effect of the DC electric field on the corrosion process of the steels.
In this paper, we try to clarify the effects of the DC electric field on the initial corrosion of the steel and how the DC electric field influences the formation, composition, morphology and structure of the corrosion products on the steel surface; a self-designed chamber was established to simulate the atmospheric corrosion under the DC electric field environment. Also, we have compared the corrosion products formed on the steel exposed under DC electric field with that under no DC electric field. Based on the experimental results obtained from supplementary tests, the discussions were given.
2 Materials and Methods
2.1 Substrate and Solution Preparation
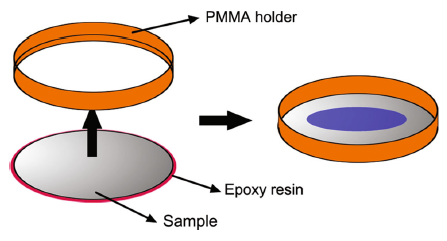
Steel were cut into Φ 45-mm round sheets with a thickness of 2 mm. The chemical compositions of the tested steel were listed in Table 1. Surface of the sample was polished with SiC paper down to 1200 grit, washed by double-distilled water, ultrasonically cleaned in ethanol and dried in air. After these, as Fig. 1shows, the specimens were sealed with epoxy resin and embedded into a ring-shaped PMMA holder leaving a space that loads a volume of 10 mL solution, meanwhile, leaving another surface of the sample an electroconductivity-well with the electrode plates. Aqueous solution of 50.0 mmol/L NaCl solution was prepared. It is necessary to point out that the introduction of chloride ions is to simulate marine atmospheric environments. The steel specimens were filled with the prepared solution and then were placed on the electrode plates which are under the DC electric field and without DC electric field after the temperature and humidity maintained at a stable value.
Table 1
Table 1
Table 1 Chemical compositions of the steel tested (in wt%)
C
Si
Mn
S
P
Cr
Ni
Cu
Fe
0.06
0.014
1.16
0.005
0.019
0.38
0.16
0.24
Bal.
Table 1 Chemical compositions of the steel tested (in wt%)
2.2 System of Simulated Atmospheric Corrosion and Experimental Process
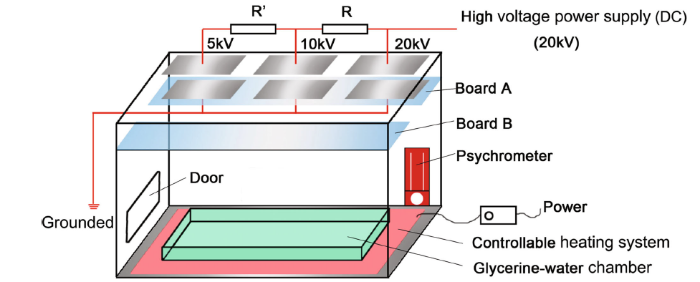
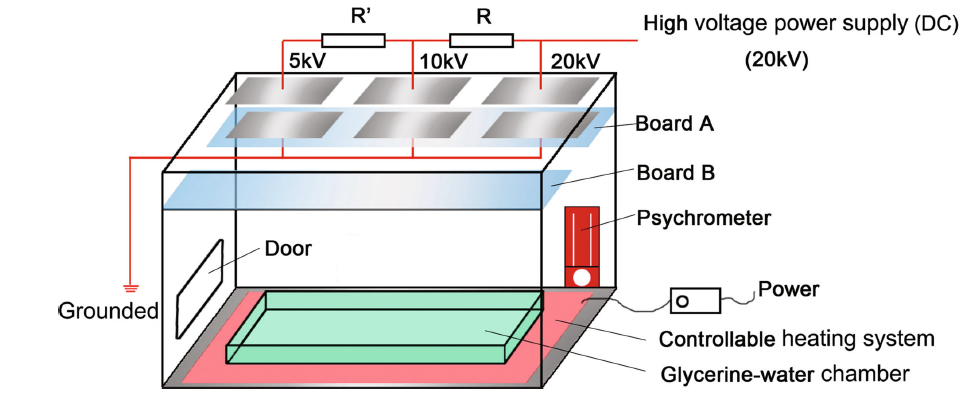
A self-designed chamber (PMMA made) system was established to provide a stable temperature and relative humidity (RH), generating a series of high voltages. As the Fig. 2 shows, in the inner space of the chamber, a heating cushion with controllable heating system was arranged at the bottom of the whole chamber to maintain a steady temperature at (28 ± 2) ° C. In addition, a trough was placed above the cushion, in which glycerin and water were mixed at the quantitative ratio of 3:1 to control the relative humidity around 60% ± 1. Some cupric sulfate (CuSO4) was added in the mixed glycerin and water solution to avoid mildewing. A dry and wet bulb thermometer was also put inside to determine the temperature and relative humidity. Two rectangle-shaped boards (Board A and Board B) were set up at the upper part of the system. One is prepared for the fixing of the electrode plates and the distance between the two plates was 50 mm; the other was used for placing the contrastive samples, around which there was no DC electric field. Another vital part was the system of generating the different DC electric field intensities, for the sake of which electrical system was self-established to build at the top outside of the chamber, a high-voltage power supply (DC) was employed to generate the stable high DC voltage (20 kV), with the help of the electrical system, and the different level of voltage, 20, 10 and 5 kV could be distributed to the three couples of electrode plates, respectively. Correspondingly, a series of DC electric field intensity 400, 200 and 100 kV/m were obtained, respectively. It should be noted that the high voltage may be dangerous, so it is necessary to provide a warning sign to ensure that electric shocks are avoided. In addition, the setup of DC electric field intensity in this study is according to the determination of practical DC electric field intensity around high-voltage transmission lines. Table 2 presents the placed location of the specimens and use of corresponding solutions. Complementally, with respect to the practical DC electric field environment where metal services, the electrode plates fixed on the Board A were grounded through the electrical wire.
Fig. 2 Schematic diagram of self-designed chamber for exposure experiments under the DC electric field
Table 2
Table 2
Table 2 Location of the specimens and corresponding solution medium
Location
DC electric field intensity (kV/m)
Number of the specimens
Solution medium
Board B (0 kV)
Blank (0)
1
NaCl
Board A (5 kV)
100
2
NaCl
Board A (10 kV)
200
3
NaCl
Board A (20 kV)
400
4
NaCl
Table 2 Location of the specimens and corresponding solution medium
After the temperature and humidity in the chamber were stable, the samples were placed on the surface of the electrode plate, each couple of electrode was loaded with three parallel substrates (to ensure the accuracy of the experiments), in which were filled with NaCl solution. Another board was set up without fixing the electrode plate onto which some contrastive specimens could be placed. The steel samples were weighted before all tests. During the passage of the exposure time, some water could evaporate from the solution; in this case, it is greatly necessary to supplement some water into the specimens, which avoids the disturbing arise from the change of the ion concentration. After the one-week exposure, the generated rust was cleaned with distilled water and ethanol to avoid accumulation of salt on the surface, drying in the oven at 50 ° C for 24 h. After that, the characterization of the corrosion products can be performed. The weight loss tests were also conducted according to ISO standards 8407-1991. The average values (three samples) of weight loss were also calculated.
2.3 Characterization
The techniques employed to characterize the corrosion products were XRD (for identification of crystalline phases), Raman spectroscopy (for characterization of amorphous phases) and SEM (for morphological studies and elemental analysis of the corrosion products). Raman spectroscopy of products was performed by using Horiba Raman spectra with exciting the laser beam of He-Ne of 532 nm wavelength on the samples. The power of the laser was kept lowest possible (6 mW) to avoid the transformation of rusts due to heating effect of laser. The locations of the specimens to be studied were focused through a microscope at the magnification of 50. The sample holder had motorized platform with Jokey to have a fine focusing at a suitable desired part of the sample. Prior to analysis of samples, the instrument was calibrated by using pure silicon at the peak of 522.28 cm-1. XRD measurements were carried out with X-ray diffraction (D8Advance, Bruker Germany) with CuK α radiation with 2θ in ranging from 10° to 75° at a scan rate of 2° /min at room temperature. The surface morphology of the corrosion products was characterized using scanning electron microscopy (SU1500, Japan).
3 Results
3.1 Weight Loss Test
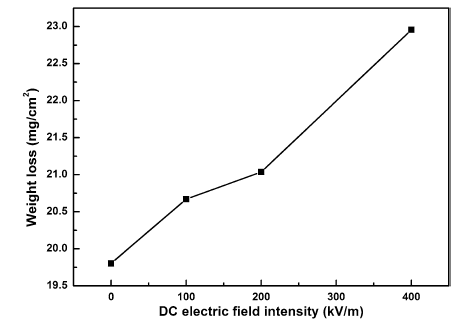
Figure 3 presents the weight loss results of the steels exposed under different DC electric field intensities. In case of the steel exposed under no DC electric field, the value of weight loss was 19.80 mg/cm2. With the existence of DC electric field, it is observed that the weight loss increases. The value of the weight loss increased from 20.67 to 21.03 mg/cm2 when the DC electric field intensity increased from 100 to 200 kV/m. It is obvious that the weight loss was 22.96 mg/cm2 when the DC electric field intensity was the largest (400 kV/m). The results obtained from the weight loss tests suggested that the existence of the DC electric field facilitates the corrosion of the steel; furthermore, the corrosion rate increased with the increase in the DC electric field intensity.
Fig. 3 Weight loss of the steels exposed under different DC electric field intensities
3.2 X-ray Diffraction and Raman Spectroscopy Tests of Formed Rusts
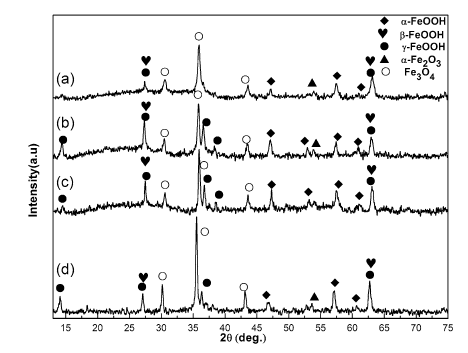
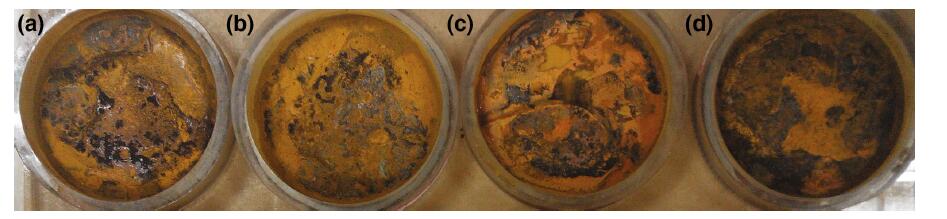
Figure 4 shows the corrosion appearance of the steel specimens immersed in NaCl solution for 1 week. It is clearly observed that some distinctions existed between these samples. In order to obtain more details on composition of the corrosion products formed on the surface of the steels, X-ray diffraction was employed to detect the rust. Figure 5 exhibits the XRD patterns of the corrosion products formed on specimens in NaCl solution under different DC electric field intensities. It is seen that under the condition of environment without the DC electric field, α -FeOOH, γ -FeOOH and Fe3O4 were detected among the products; γ -FeOOH and Fe3O4 are the main compositions in the products, and α -FeOOH is a minor component. Misawa et al. [2] have also reported the same products in the corrosion rust. It is known that the intensity of the diffraction peaks corresponds to the crystallized phase, while the broadening of the diffraction lines reflects a decrease in the particle size or crystallinity [12]. With the increase in DC electric field intensity up to 100 kV/m, no evident changes of the composition of the products appeared. However, the existence of DC electric field gives rise to the variation in the peak intensity of the corrosion products. Generally speaking, the peaks of γ -FeOOH displayed a higher intensity; moreover, as we can see in Fig. 5b, the several peaks of γ -FeOOH (2θ ≈ 14° , 32° , 38° , 62° ) arose in the pattern, and it gradually occupied as a leading composition among the corrosion products. Herein, it is necessary to point that the peaks of γ -FeOOH and β -FeOOH near 27° , 63° (2θ ) are very close. Additionally, the peak of α -FeOOH around 54° appeared in the pattern, and the intensity of typical peaks of α -FeOOH increased a little. For pattern in Fig. 5c, no obvious alteration was observed in the composition of the corrosion products, while the peaks of Fe3O4 (2θ ≈ 36° ) seem higher than that in Fig. 5b. When the DC electric field intensity increased up to 400 kV/m, it is more pronounced that the intensity of typical peaks of Fe3O4 turned much higher than that in Fig. 5b, c, and at the same time, the intensity of peak of α -FeOOH reduced obviously.
Fig. 5 XRD patterns of the products formed on the specimens in NaCl solution under different DC electric field intensities: a blank (0 kV/m), b 100 kV/m, c 200 kV/m, d 400 kV/m
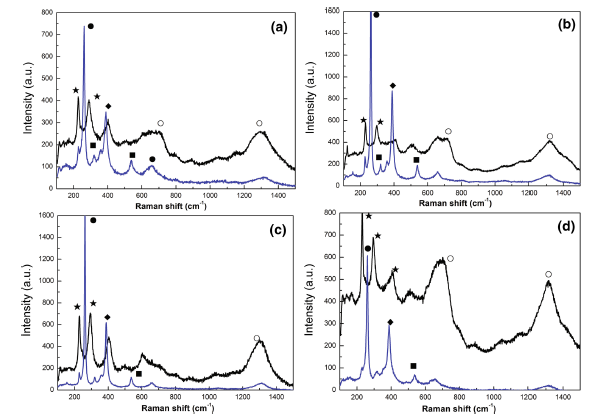
The corrosion rust was also subjected to Raman test, as Raman spectra shown in Fig. 6. Considering the accuracy of constituents of the corrosion products, different regions with different corrosion appearances were both detected. Blue and black curves in spectra stand for Raman tests in yellow and black zones, respectively. It is evident that the presence of α -FeOOH, γ -FeOOH, β -FeOOH, Fe3O4 and Fe2O3 were detected. The identification of corrosion products through Raman was also consistence with the results obtained by the other authors [12, 23]. It is noted that no presence of β -FeOOH appeared in XRD patterns, which is attributable to the presence of very low content of the phase in the rust because it is in below the critical sensitivity level of the XRD technique, as proposed by some researchers [23]. With the increase in DC electric field intensity to 100 kV/m, the peak intensity of γ -FeOOH increased obviously, while the peak intensity of α -FeOOH increased slightly. When the DC electric field intensity was up to 200 kV/m, it is found that no obvious changes occurred to γ -FeOOH and the peak intensity of α -FeOOH, however, further reduced. As seen in Fig. 6d, under the condition of highest DC electric field intensity in experiments, it is more obvious that the peaks in black zone exhibited the highest intensity. However, the Raman pattern in yellow zone showed inverse behavior. And the quantity of the corrosion products in black zone occupied the most part of the whole layer; this indicated that the severer corrosion of the steel occurred, which was consistent with XRD analysis.
3.3 Morphology of the Corrosion Products
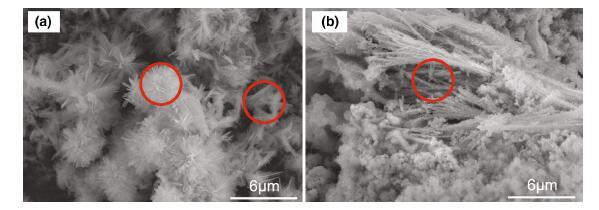
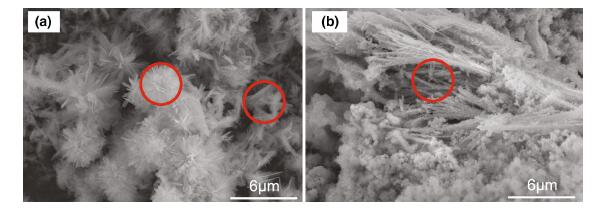
Figure 7 exhibits the micrographs of the corrosion products formed on the surface of the steels immersed in NaCl solution for 1 week. Figure 7a shows several typical corrosion products, some tiny cotton balls and plate-like products (shown in red circles) appeared surrounding the corrosion products. De la Fuente et al. [24] pointed out that the cotton balls are typical structure of α -FeOOH, and the plates are γ -FeOOH. As shown in Fig. 7b, some needle-shaped products appeared. According to the researchers mentioned previously [16, 17], cotton ball is the typical structure of α -FeOOH (semicrystalline), and acicular structure (crystalline α -FeOOH) is another typical structure of α -FeOOH. It is known that γ -FeOOH appeared in a form of flowery structure, which consists of many fine plates.
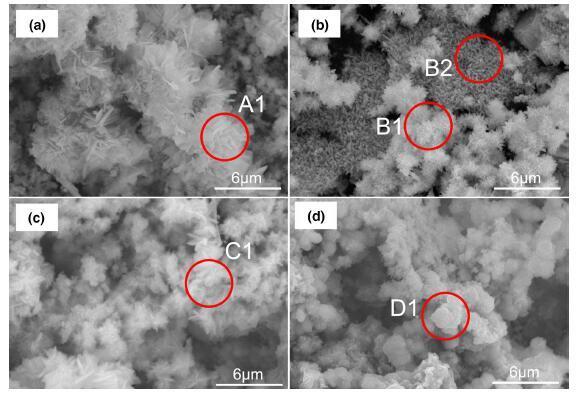
Figure 8 displays the corrosion products formed on the steel surface under different DC electric field intensities. Figure 8a exhibits the typical corrosion products formed on the surface of the steel without the existence of DC electric field, and it shows some well-formed cotton balls (shown in A1), around which are plate-like products. According to some authors [1, 25], the cotton balls are connected with each other as a compact layer, which protects the steel substrate from attacking by the corrosive ions. On the other hand, plate-like products appear without the protective ability due to spaces among their structure. In the presence of the DC electric field of 100 kV/m, it is seen in Fig. 8b that most cotton balls (as B1 displayed) and flowery structures (shown in B2) were formed on the steel surface; compared with that formed under no DC electric field (Fig. 8a), cotton balls formed more loosely and their size turned smaller. Compared with the previous studies [24, 26], it is also unlike the compact microstructure of the cotton balls in the references. It is suggested that the existence of DC electric field changed the crystallinity and the size of the α -FeOOH. With the further increase in the DC electric field intensity to 200 kV/m, the size of the α -FeOOH got smaller continuously; while its structure did not exhibit more compactness (seen in C1 in Fig. 8c), some plate-like products appear around the cotton balls. As seen in Fig. 8d, when the DC electric field intensity increased to 400 kV/m, there is no evident presence of α -FeOOH, which indicated that the much higher DC electric field suppressed the formation of α -FeOOH, but increased the possibility of transformation of γ -FeOOH to Fe3O4. And this would be vital for the whole layer due to the protective ability of α -FeOOH.
4 Discussion
As described above about the composition of the corrosion products formed in different simulated solutions under no DC electric field. α -, β -, γ -FeOOH, Fe3O4 and poorly crystallized iron oxides were detected through Raman and XRD, which was consistent with some researchers’ studies [2, 4, 27]. Obviously, according to XRD and Raman patterns corresponding to the steel specimens exposed under different DC electric field intensities, the existence of the DC electric field made no significant changes on the major composition of corrosion products. This can also be proved by means of comparing with other investigation on corrosion products of steel [1, 2, 8]. Some researches [6] also investigated the effects of anions on the formation of corrosion products. They proposed that anions such as Cl- can accelerate corrosion through promoting anodic dissolution in the way similar to some kind of catalysis. As the following expressed:
(1)
(2)
Raman et al. [26] studied the morphology of rust phases formed on steels. α -FeOOH exhibits as a cotton ball structure, which is compact and fine. This property can repel corrosive ions from surface of steels, which works as a stable and protective layer [2, 28]. Morphology of γ -FeOOH looks like flowery structure, inside which many open structures appear, and it is easier for outer corrosive ions having access to the structure to destroy the surface. It is also reported that γ -FeOOH can further transform into α -FeOOH in the further corrosion of steel [2, 29]. This transformation between the two types of corrosion products is very important for corrosion process. In other words, the smooth development of this transformation benefits improving the protective ability of rust layer. It is worth pointing that the free energy of Fe2O3 is higher than that of FeOOH [30], which suggests that FeOOH should be more thermodynamically stable than Fe2O3. Considering the medium of the experiment, FeOOH can hardly transform to Fe2O3 due to its low free energy. As mentioned previously [13], β -FeOOH and γ -FeOOH are instable products, and they can transform into Fe3O4 in the presence of Fe2+ ions in solution. Reaction can be expressed as follows:
(3)
Stratmann et al. [31] pointed out that Fe3O4 shows quite high conductivity, and therefore works as a large cathode area and will accelerate the next corrosion stage from an electrochemical point of view. This conclusion is in favor of the discussion in XRD.
Discussed as another critical factor introduced into exposed experiments, there are no changes occurred on the constituents of corrosion products, while some give rise to the typical products. As seen in Figs. 5 and 6, it is interesting that little higher DC electric field intensity supports the growth of γ -FeOOH and a little more Fe3O4 generated. According to some authors [2, 4], the α -FeOOH (cotton ball) was connected with each other and grew up to a compact morphology. SEM (as obtained in Figs. 7 and 8) studies, however, revealed that the crystallinity of α -FeOOH decreased under the DC electric field intensity of 100-400 kV/m, and the cotton balls get more loose and smaller, which will favor the access of corrosive ions like chloride ions and sulfate ions into the steel substrates. When the DC electric field intensity was 200 kV/m, no more obvious changes happened on the composition of corrosion products. Clearly, with the several times increasing in DC electric field intensity, changes observed through the tests and observation of Raman, XRD and SEM, the crystallinity and percentage of α -FeOOH dropped a lot, especially at the DC electric field intensity of 400 kV/m. Meanwhile, more Fe3O4 generated among the corrosion products. It is reasonable to believe that the much higher DC electric field intensity inhibits the growth of α -FeOOH and reduced the transformation of γ -FeOOH into α -FeOOH, which potentially increases the possibility of β - and γ -FeOOH reacting with Fe2+ions in solution. Likewise, as observed in Figs. 7 and 8, it is found that the much higher is the DC electric field intensity, the worse is the crystallinity and growth of α -FeOOH. The great loss of stable and protective layer will further facilitate the corrosion of steels. Micrograph studies by SEM are also in considerable agreement with the tests through Raman and XRD.
Fig. 6 Raman spectra of the rusts formed on the specimens in NaCl solution under different DC electric fields: ablank (0 kV/m), b 100 kV/m, c 200 kV/m, d 400 kV/m (filled circle γ -FeOOH, filled diamond α -FeOOH, filled square β -FeOOH, filled star α -Fe2O3, open circle Fe3O4)
Fig. 7 SEM images of typical corrosion products formed on the steels immersed in NaCl solution: a cotton balls and plate-like products, b needle-like and amorphous products
Fig. 8 SEM images of major corrosion products formed on surface of the steels under different levels of DC electric field intensity: a blank (0 kV/m), b 100 kV/m, c 200 kV/m, d 400 kV/m
In this study, it is shown that the effect of DC electric field on the corrosion products formed on the surface of steel is exactly obvious through XRD, Raman and SEM, especially on the microstructure and formation of α -FeOOH under different DC electric field intensities. The corresponding conclusions we obtained clearly are the existence of much higher DC electric field intensity affecting the transformation of rust from γ -FeOOH to α -FeOOH and further more generation of Fe3O4 (high conductivity and works as a large cathode area), which favors the successive corrosion of steels. But explaining how DC electric field affects the crystallinity of α -FeOOH and γ -FeOOH from a structural point of view still needs further studies.
5 Conclusions
The studies confirmed that the main compositions of corrosion products formed on the steel surface under DC electric field were the same with that formed under no DC electric field, and the corrosion rate of steel increased with the increase in DC electric field intensity according to weight loss tests. The existence of the DC electric field influences the growth and formation of the γ -FeOOH and α -FeOOH. Little higher DC electric field intensity (around 100-200 kV/m) promotes the crystallinity and growth of γ -FeOOH, and much higher DC electric field intensity (greater than 400 kV/m) prevents the growth of α -FeOOH, and more Fe3O4 is generated. The formation of α -FeOOH was hindered suggesting the loss of the protective ability of the corrosion layer. On the other hand, the suppression of the transformation of α -FeOOH from γ -FeOOH probably favors the yield of the Fe3O4, which works as a large cathode area among the corrosion products and would be about to quicken the subsequent corrosion of steel.
Acknowledgments
The work was financially supported by the National Natural Science Foundation of China (No. 51271110). This work was also supported by Science and Technology Commission of Shanghai Municipality (No. 14DZ2261000). Authors are grateful for Proofreading Service for checking the language and polishing the manuscript.
The authors have declared that no competing interests exist.
R. A. Antunes, J. Costa, D. L. Araujo, Mater. Res. 6, 403(2003)[Cite with in:3]
[2]
T. Misawa, K. Hashimoto, S. Shimodaira, Corros. Sci. 14, 131(1974)[Cite with in:7]
[3]
S. J. Oh, D. C. Cook, J. J. Carpio, J. Korean Phys. Soc. 36, 106(2000)[Cite with in:2]
[4]
T. Kamimura, S. Hara, H. Miyuki, M. Yamashita, H. Uchida, Corros. Sci. 48, 2799(2006)[Cite with in:4]
[5]
M. Yamashita, H. Konishi, T. Kozakura, J. Mizuki, H. Uchida, Corros. Sci. 47, 2492(2005)[Cite with in:2]
[6]
T. Ishikawa, S. Miyamoto, K. Kand ori, T. Nakayama, Corros. Sci. 47, 2510(2005)[Cite with in:2]
[7]
P. Dillmann, R. Balasubramaniam, G. Beranger, Corros. Sci. 44, 2231(2002)[Cite with in:1]
[8]
K. Xiao, C. F. Dong, X. G. Li, F. M. Wang, J. Iron. Steel Res. Int. 15, 42(2008)[Cite with in:2]
[9]
X. Zhang, K. Xiao, C. F. Dong, X. G. Li, Eng. Fail. Anal. 18, 1981 (2011)[Cite with in:1]
[10]
M. Yamashita, H. Miyuki, Y. Masuda, H. Nagano, T. Misawa, Corros. Sci. 36, 283(1994)[Cite with in:1]
[11]
D. D. N. Singh, S. Yadav, J. K. Saha, Corros. Sci. . 50, 93(2008)[Cite with in:1]
[12]
M. Carbucicchio, R. Ciprian, F. Ospitali, G. Palombarini, Corros. Sci. 50, 2605(2008)[Cite with in:3]
[13]
H. Tanaka, R. Mishima, N. Hatanaka, T. Ishikawa, T. Nakayama, Corros. Sci. 78, 384(2014)[Cite with in:2]
[14]
L. Hao, S. Zhang, J. Dong, W. Ke, Corros. Sci. 58, 175(2012)[Cite with in:1]
[15]
A. Raman, S. Nasrazadani, L. Sharma, A. Razavan, Prakt. Metallogr. 24, 577(1987)[Cite with in:1]
[16]
A. Raman, S. Nasrazadani, L. Sharma, A. Razvan, Pract. Methods24, 535 (1987)[Cite with in:3]
[17]
A. Raman, A. Razvan, B. Kuban, K. A. Clement, E. Graves, Corrosion42, 447 (1986)[Cite with in:2]
[18]
K. K. Corrosion49, 457 (1993)[Cite with in:1]
[19]
X. X. Zhang, M. Chen, Acta Phys. Chim. Sin. 30, 1208(2014)[Cite with in:1]
[20]
X. L. Ma, D. C. Yin, H. L. Cao, Lett. Biotechnol. 21, 897(2010)[Cite with in:1]
[21]
Y. G. Lu, X. L. Liang, Y. Q. Gong, X. J. Zheng, Z. Z. Liu, Acta Phys. Sin. 59, 8167(2010)[Cite with in:1]
[22]
Z. L. Zhao, B. Liu, R. Zhang, L. Liu, Mater. Rev. 9, 23(2001)[Cite with in:1]
[23]
J. K. Singh, D. D. N. Corros. Sci. 56, 129(2012)[Cite with in:2]
[24]
D. Fuente, I. Diaz, J. Simancas, B. Chico, M. Morcillo, Corros. Sci. 53, 604(2011)[Cite with in:2]
[25]
Y. T. Ma, Y. Li, F. H. Wang, Corros. Sci. 51, 997(2009)[Cite with in:1]
[26]
A. Raman, S. Nasrazadani, L. Sharma, Metallography22, 79(1989)[Cite with in:2]
[27]
Q. Guo, J. H. Liu, M. Yu, S. M. Li, Acta Metall. Sin (Engl. Lett. )28, 139 (2015)[Cite with in:1]
[28]
F. L. Sun, X. G. Li, F. Zhang, X. Q. Cheng, C. Zhou, N. C. WuY. Q. Yin, J. B. Zhao, ActaMetall. Sin (Engl. Lett. )26, 257(2013)[Cite with in:1]
[29]
K. Asami, M. Kikuchi, Corros. Sci. 45, 2671(2003)[Cite with in:1]
[30]
X. G. Li, The Behaviors and Mechanism of the Initial Stages of Atmospheric Corrosion for Metals (Science Press, Beijing, 2009)[Cite with in:1]
[31]
M. Stratmann, K. Bohnenkamp, T. Ramchand ran, Corros. Sci. 27, 905(1987)[Cite with in:1]
3
2003
0.0
0.0
... 1 IntroductionSteel is most commonly employed as metallic material in open-air environment and is widely used in equipment and metallic structures due to its low cost and excellent mechanical strength [1,2,3,4] ...
... According to some authors [1, 25], the cotton balls are connected with each other as a compact layer, which protects the steel substrate from attacking by the corrosive ions ...
... This can also be proved by means of comparing with other investigation on corrosion products of steel [1, 2, 8] ...
7
1974
0.0
0.0
... 1 IntroductionSteel is most commonly employed as metallic material in open-air environment and is widely used in equipment and metallic structures due to its low cost and excellent mechanical strength [1,2,3,4] ...
... [2] have also reported the same products in the corrosion rust ...
... studies [2, 4, 27] ...
... This can also be proved by means of comparing with other investigation on corrosion products of steel [1, 2, 8] ...
... This property can repel corrosive ions from surface of steels, which works as a stable and protective layer [2, 28] ...
... -FeOOH in the further corrosion of steel [2, 29] ...
... According to some authors [2, 4], the #cod#x003b1 ...
2
2000
0.0
0.0
... 1 IntroductionSteel is most commonly employed as metallic material in open-air environment and is widely used in equipment and metallic structures due to its low cost and excellent mechanical strength [1,2,3,4] ...
... -FeOOH and Fe3O4 are the major constituents, as well as some poorly crystallized iron oxides [3, 7] ...
4
2006
0.0
0.0
... 1 IntroductionSteel is most commonly employed as metallic material in open-air environment and is widely used in equipment and metallic structures due to its low cost and excellent mechanical strength [1,2,3,4] ...
... Considerable efforts have been dedicated to investigate the corrosion of the steel in various environments where the steel services in, especially the atmospheric surroundings containing anions [4,5,6] ...
... studies [2, 4, 27] ...
... According to some authors [2, 4], the #cod#x003b1 ...
2
2005
0.0
0.0
... Considerable efforts have been dedicated to investigate the corrosion of the steel in various environments where the steel services in, especially the atmospheric surroundings containing anions [4,5,6] ...
... Furthermore, the type of oxide layers formed on their surfaces primarily governed the corrosion rate of the steel in a climatic condition [5, 9] ...
2
2005
0.0
0.0
... Considerable efforts have been dedicated to investigate the corrosion of the steel in various environments where the steel services in, especially the atmospheric surroundings containing anions [4,5,6] ...
... Some researches [6] also investigated the effects of anions on the formation of corrosion products ...
1
2002
0.0
0.0
... -FeOOH and Fe3O4 are the major constituents, as well as some poorly crystallized iron oxides [3, 7] ...
2
2008
0.0
0.0
... These products can coexist partly as crystalline and partly as amorphous structures, the relative amounts of which vary depending on the different environmental conditions [8] ...
... This can also be proved by means of comparing with other investigation on corrosion products of steel [1, 2, 8] ...
1
1981
0.0
0.0
... Furthermore, the type of oxide layers formed on their surfaces primarily governed the corrosion rate of the steel in a climatic condition [5, 9] ...
1
1994
0.0
0.0
... -FeOOH is the most thermodynamically stable phase out of all these oxide products [10] ...
1
2008
0.0
0.0
... -FeOOH on an iron surface proceeds, the corrosion rate of the steel is considerably reduced [11] ...
3
2008
0.0
0.0
... [12], the presence of #cod#x003b2 ...
... It is known that the intensity of the diffraction peaks corresponds to the crystallized phase, while the broadening of the diffraction lines reflects a decrease in the particle size or crystallinity [12] ...
... The identification of corrosion products through Raman was also consistence with the results obtained by the other authors [12, 23] ...
2
2014
0.0
0.0
... [13] studied the reaction between Fe3O4 and FeOOH, when the iron powder treated with #cod#x003b3 ...
... As mentioned previously [13], #cod#x003b2 ...
1
2012
0.0
0.0
... [14] investigated the atmospheric corrosion of MnCuP weathering steel in simulated coastal and coastal-industrial atmosphere and found that the corrosion resistance of rust layer was improved by the increase in #cod#x003b1 ...
1
1987
0.0
0.0
... Additionally, the morphology of the corrosion products formed on the steels has been observed by many authors, and the information on the structural characteristic of these products can be acquired [15,16,17,18] ...
3
1987
0.0
0.0
... Additionally, the morphology of the corrosion products formed on the steels has been observed by many authors, and the information on the structural characteristic of these products can be acquired [15,16,17,18] ...
... -FeOOH appears as small crystalline globules (sandy crystals) or as flowery structures, which consist of many fine plates [16] ...
... According to the researchers mentioned previously [16, 17], cotton ball is the typical structure of #cod#x003b1 ...
2
1986
0.0
0.0
... Additionally, the morphology of the corrosion products formed on the steels has been observed by many authors, and the information on the structural characteristic of these products can be acquired [15,16,17,18] ...
... According to the researchers mentioned previously [16, 17], cotton ball is the typical structure of #cod#x003b1 ...
1
1993
0.0
0.0
... Additionally, the morphology of the corrosion products formed on the steels has been observed by many authors, and the information on the structural characteristic of these products can be acquired [15,16,17,18] ...
1
2014
0.0
0.0
... Recently, according to some researchers, the existence of homogeneous DC electric field has a huge influence on the structure and growth of crystal [19, 20] ...
1
2010
0.0
0.0
... Recently, according to some researchers, the existence of homogeneous DC electric field has a huge influence on the structure and growth of crystal [19, 20] ...
1
2010
0.0
0.0
... [21] investigated the effect of the DC electric field on the phase transitions of ferroelectric thin film ...
1
2001
0.0
0.0
... [22] studied the solidification of the metal under DC electric field and concluded that the presence of DC electric field alters the electromigration of the metal ions, as well as the size of metal crystal particles ...
2
2012
0.0
0.0
... The identification of corrosion products through Raman was also consistence with the results obtained by the other authors [12, 23] ...
... -FeOOH appeared in XRD patterns, which is attributable to the presence of very low content of the phase in the rust because it is in below the critical sensitivity level of the XRD technique, as proposed by some researchers [23] ...
2
2011
0.0
0.0
... [24] pointed out that the cotton balls are typical structure of #cod#x003b1 ...
... Compared with the previous studies [24, 26], it is also unlike the compact microstructure of the cotton balls in the references ...
1
2009
0.0
0.0
... According to some authors [1, 25], the cotton balls are connected with each other as a compact layer, which protects the steel substrate from attacking by the corrosive ions ...
2
1989
0.0
0.0
... Compared with the previous studies [24, 26], it is also unlike the compact microstructure of the cotton balls in the references ...
... [26] studied the morphology of rust phases formed on steels ...
1
2015
0.0
0.0
... studies [2, 4, 27] ...
1
2013
0.0
0.0
... This property can repel corrosive ions from surface of steels, which works as a stable and protective layer [2, 28] ...
1
2003
0.0
0.0
... -FeOOH in the further corrosion of steel [2, 29] ...
1
2009
0.0
0.0
... It is worth pointing that the free energy of Fe2O3 is higher than that of FeOOH [30], which suggests that FeOOH should be more thermodynamically stable than Fe2O3 ...
1
1987
0.0
0.0
... [31] pointed out that Fe3O4 shows quite high conductivity, and therefore works as a large cathode area and will accelerate the next corrosion stage from an electrochemical point of view ...
Influence of Direct Current Electric Field on the Formation, Composition and Microstructure of Corrosion Products Formed on the Steel in Simulated Marine Atmospheric Environment


 (1)
(1) (2)
(2) (3)
(3)

 ]
]