

Kinetics and Morphological Analysis of Silver Platinum Bimetallic Nanoparticles
[Fredrick Okumu, Mangaka Matoetoe ]
]
]
|
|


Kinetics of a one-pot core-shell synthesis of bimetallic (BM) silver-platinum (Ag-Pt) nanoparticles (NPs) by simultaneous reduction of 1:1 mol fraction of precursors H2PtCl6·6H2O and AgNO3 in aqueous solution is reported. Kinetics analysis was done by plotting UV-visible absorptions versus reaction time with a first-order fitting. Recorded constants of Ag NPs (0.079 s-1), Ag-Pt NPs 1:1 (0.082 s-1), and Pt NPs (0.006 s-1) were obtained. The NPs suspension solutions were clear, free from AgCl precipitate, and had characteristic optical properties of 450 nm (Ag NPs), while there were no observable bands for Pt and BM NPs. Morphological analysis using transmission electron microscopy, energy-dispersive X-ray spectroscopy (EDX), and selected area electron diffraction (SAED) depicted spherical aggregates of Ag NPs, Pt NPs and core shell Pt-Ag NPs 1:1 of average size of 60, 2.5, and 20 mm, respectively. Presence of the Ag and Pt elemental composition in the nanoparticle suspensions was confirmed by EDX. SAED ring patterns revealed a single face-centered cubic crystalline nature of Ag NPs and showed typical Pt-based BMs randomly overlapped ring pattern with sharp diffraction spots.
Received: 4 November 2015 / Revised: 7 January 2016 / Published online: 12 March 2016
Nanosized metals have attracted considerable interest because of their potential application in catalysis, microelectronics, electronic, and magnetic devices [1]. Application limitations of nanomaterials may be due to metal oxidation resulting in loss of sensitivity (Fe, Co, and Ni) [1] and susceptibility to poisoning (Pt) [2]. Bimetallic synthesis emerged as a solution to these problems. Introduction of another metal to produce a bimetallic (BM) nanoparticle results in increased oxidation resistance while maintaining magnetic properties. BM materials also have improved activity, selectivity, and resistance to deactivation as well as an increase in the diversity control of properties of interest.
Multimetallic nanoparticles is an old subject [3]. However, very limited investigation has been addressed to sensors [4, 5]. Interest in BM nanoclusters studies is due to their myriad properties and applications in optics [6], magnetism, catalysis [7], and others, mainly due to their high tenability and superior features compared with those of their monometallic counterparts [8]. Depending on the elements, relative concentrations, and details of the synthesis method, the BM may form core-shell structures, heterostructures, and ordered/random mixed-alloy nanocrystals, and this diversity increases the mass-specific activity (MSA) of the nanoparticles while also minimizing the production cost by using precious metals only in the surface of the particles [9, 10].
Core-shell nanomaterials have complex electron interactions between the electron-rich elements, a lattice strain, as well as the heterometallic bonding interactions resulting in modified surface electronic properties of the nanoparticles. Therefore, they often exhibit improved catalytic properties compared to their alloyed counterparts or to mixtures of monometallic nanoparticles [3]. For example, platinum BM nanoparticles, with magnetic metals such as Ni, Co, and Fe, have exhibited enhanced magnetic anisotropy and chemical stability in comparison with their monometallic Ni, Co, and Fe nanoparticles [11, 12]. High catalytic activity of platinum alloys (Pt-Co, Pt-Ni, and Pt-Fe) could enhance the detection limits of biosensors [13]. Ag-Pt alloy nanoparticles (NPs) are of research interest due to their novel application in dentistry, bone and breast surgical implants on account of their corrosion resistance, biocompatibility, and improved properties [14, 15, 16]. Silver nanoparticles are of interest because of their plasmon resonances, which are the collective oscillations of the conduction electrons in the metal. Kinetics in various media has been used in the synthesis of Ag-Pt, bovine serum albumin, and oleylamine at elevated temperatures [17]. However, minimum has been reported on the common reducing agent (citrate) in aqueous solutions.
Solution-based synthesis of Pt NPs with reactive non-noble metals has some problems, due to nucleation and growth deviation from thermodynamic to a kinetically controlled pathway by slowing down precursor decomposition, reduction via a weak reducing agent or by Ostwald ripening [4]. Thus, manipulation of BM nanomaterials properties involves detailed understanding of the mechanism and kinetics of precursor’ s reduction and particle growth [5, 11, 12]. It is also reported that BM particles depends on the mode of preparation, miscibility, and kinetics of reduction of metal ions [18]. Therefore, understanding the kinetics of the synthesis of these metal nanostructures and their structural arrangement is extremely important considering their numerous potential applications. This paper describes the kinetics of the one-pot aqueous synthesis of Ag (core)-Pt (shell) nanoparticles via citrate reduction method [19], monitored by UV-visible absorption. One-pot strategy is based on the difference in reduction kinetics of Ag and Pt where Ag is a seed for the growth of Pt [17]. Citrate reduces both Ag and Pt precursors at different rates and acts as a capping agent, thus preventing precipitation of AgCl. The morphology and composition of the synthesized nanomaterials are studied by using transmission electron microscopy (TEM), selected area electron diffraction (SAED), and energy-dispersive X-ray (EDX) spectroscopy.
AgNO3 (Aldrich, 99.9%), H2PtCl6· 6H2O (Aldrich, 99%), and trisodium citrate (Na3C6H5O7) (Aldrich, 99%) were chosen in this study. Deionised water purified by a milli-QTM system (Millipore) was used for aqueous solution preparation.
Silver nanoparticles were synthesized by the reduction of AgNO3 with trisodium citrate (Na3C6H5O7) according to described procedures [19]. A solution of 1.0 mmol/L AgNO3 was heated to boil in an Erlenmeyer flask. To this solution, Na3C6H5O7 was added dropwise with vigorously stirring and heated until a pale yellow color was observed. The mixture was removed from the heating surface and cooled to room temperature with stirring. Pt NPs were synthesized by chemical reduction of H2PtCl6· 6H2O in aqueous solution as described in the literature [20]. A solution of 1.0 mmol/L H2PtCl6· 6H2O was added to distilled water and heated to 80 ° C with stirring in a 250-mL flask. Sodium citrate solution was then added dropwise with vigorous stirring. The resulting solution was maintained at 80 ° C for about 1 h until the pale yellow solution turned dark brown. It was then removed from the heating surface and stirred until it cooled at room temperature.
A one-pot synthesis approach was used for the synthesis of BM Ag-Pt NPs with 1:1 molar ratio of the precursors in a glass-stopper flask fitted with a condenser to minimize evaporation. A solution mixture (1:1 molar ratio) of 10 mm H2PtCl6· 6H2O and AgNO3 was added to distilled water followed by dropwise addition of sodium citrate and the reaction mixture refluxed with the temperature regulated between 80 and 90 ° C for 1 h.
UV-visible absorption studies were performed with Cary 300 dual-beam spectrophotometer using 1-cm quartz cuvette in the wavelength range of 200-800 nm. To determine the rate of the nanoparticles formation, reactions were carried out as described above (Sect. 2.3) and the growth process monitored according to the method of Mie [21]. The progress of the reaction was followed by taking aliquots at definite time intervals (min) and measuring the absorbance at 450 nm for Ag NPs and 430 nm (λ max of yellow color) for Pt NPs and Ag-Pt NPs (1:1) as described by Mie [21]. The apparent rate constants (kapp, s-1) were calculated from the initial part of the slopes (between 0 min and 40 min) of the plots of ln(α 1-α )ln(α 1-α ) versus time with a fixed time method [22].
The particle size distribution studies of the NPs were performed using a high-resolution transmission electron microscope (HRTEM) from Tecnai G2F20 X-Twin MAT (US). The samples for TEM were prepared by placing a drop of working solution on a carbon-coated standard copper grid (300 mesh) operating at 80 kV. An EDX analyzer attached to the TEM operating in the transmission electron microscopy (TEM) mode was used to analyze the chemical compositions of the synthesized nanoparticles.
Spectra for monitoring the reduction reactions for monometallic and BM are depicted in Fig. 1a-c. Formation of Ag NPs (Fig. 1a) showed that within 5 min of boiling, a broad absorption band developed around 450 nm. As reaction time progressed, the absorption band intensity increased and then remained constant (Fig. 1a) due to continuous reduction of Ag+ ions. After 25 min, a noticeable constant reduction rate was observed suggesting that Ag0 was formed. Maximum absorbance was observed around 30 min, and similar observations have been reported [18, 19]. According to the literature, broad peaks in the beginning of formation are attributed to very small particles (seeds) [23].
 | Fig. 1 UV-visible spectra displaying time evolution of the formation of a Ag NPs; b Pt NPs; and c Ag-Pt NPs 1:1 |
Spectra for monitoring Pt NPs formation (Fig. 1b) depicted a progressive decrease in precursor’ s absorption band till it completely disappears after 2 h 20 min; this is in agreement with the literature [26]. BM Ag-Pt NPs 1:1 formation spectra (Fig. 1c) show a decreasing absorption band intensity and blue-shifting absorption band from the start (5 min). After 25 min of reaction, the mixture was completely colorless. This absorption band disappearance in the BM is due to the extreme sensitivity of the surface plasmon absorption peak of Ag NPs to the presence of the transition metal (Pt), thus indicating a possible gradual surface coverage of Ag NPs surface plasmon resonance (SPR) by Pt NPs.
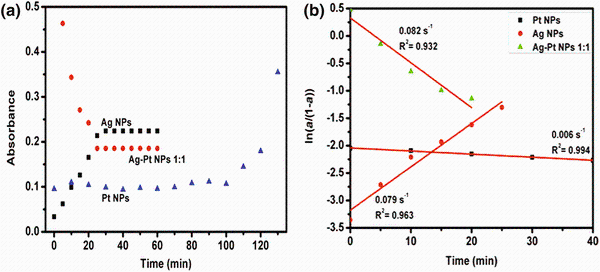
Plots of the absorbance against time for the formation of the NPs (Fig. 2a) and their kinetic data were fitted to first-order rate equations of ln 
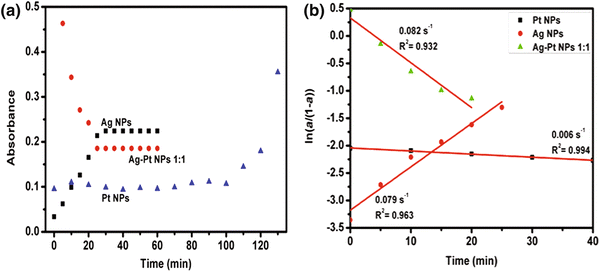 | Fig. 2 Absorbance versus time plots for various NPs a and plots of ln(α 1-α )ln(α 1-α ) as a function of reaction time (initial time of reduction) b |
In BM reduction, the precursor absorbance (λ max of pale yellow color 430 nm) decreased with time at relatively faster rate (30 min). The apparent rate constants (kapp) of particle formation trends were determined (Fig. 2b) as follows: Ag NPs > Ag-Pt NPs 1:1 > Pt NPs. Both Ag NPs and Ag-Pt NPs 1:1 had relative fast reduction rates compared to Pt NPs formation. The reaction time for the reduction process at boiling temperature was found to be important for achieving complete reduction, which is corroborated by Huang et al. [22].
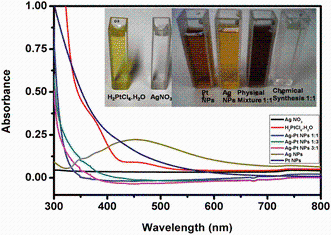
The final pale yellow (Ag NPs) and dark brown (Pt NPs) suspension of the NPs was clear, thus ruling out the formation of AgCl from addition of chlorine-containing compound like H2PtCl6· 6H2O into Ag+ ions solution. UV-visible optical spectra of the precursors and prepared NPs are depicted in Fig. 3. From Fig. 3, it is clear that the precursors have different optical properties from the final suspensions strongly indicating completion of reactions. The Ag NPs spectrum has characteristic broad peak at 450 nm due to surface plasmon [27], while the Pt NPs and the BM have no observable absorption band. The absence of the precursor ion (PtCl62-) around 430 nm arising due to the d-d transition [28] and the Ag NPs band in Pt NPs and BM, respectively, is due to completion of reaction and sensitivity of the Ag band to the presence of Pt as explained above. The absence of the Ag surface plasmon absorption peak in the spectrum of the BM rules out the possibility of the presence of isolated Ag clusters.
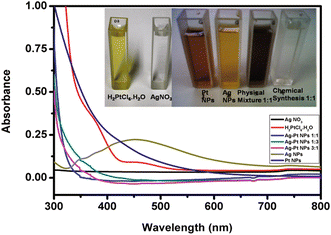 | Fig. 3 Absorption spectra of Ag, Pt, and Ag-Pt nanoparticles (1:1) and digital photographs (inset) of Ag, Pt, and BM Ag-Pt nanoparticles 1:1 |
HRTEM images with low magnifications (20 nm) for Ag, Pt, and Ag-Pt NPs (1:1) samples are depicted in Fig. 4a-c. The Ag NPs showed uneven spheres of sphere-stacked aggregation with an average diameter of 60 nm [29], as observed in Fig. 4a. The aggregation can be ascribed to the fact that as-grown Ag sphere easily combines with neighboring spheres together at higher temperatures during the reduction period, generating bulky silver islands [29]. The particle size of Pt NPs is 2.5 nm, which is much smaller than that of Ag NPs and the BM (Fig. 4b).
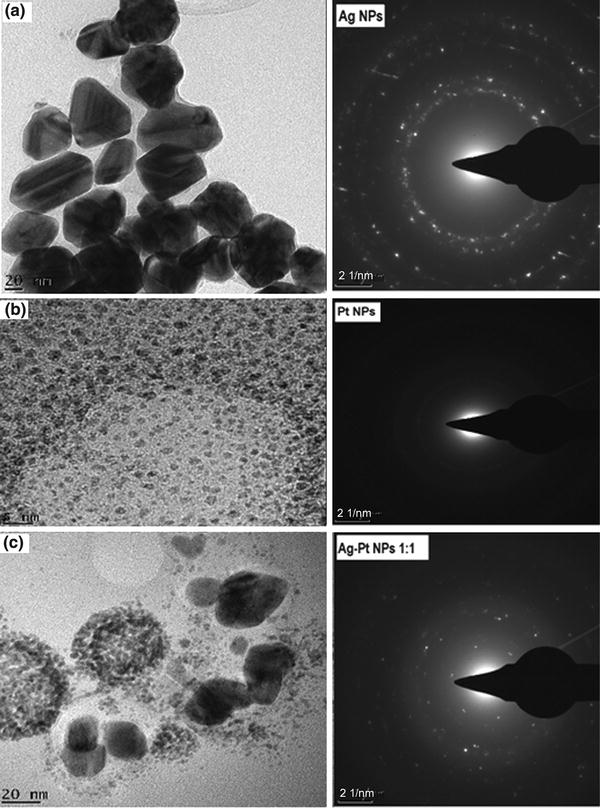 | Fig. 4 TEM micrographs of a Ag NPs; b Pt NPs; and c Ag-Pt core-shell nanoparticles 1:1 and their corresponding SAED patterns |
Microgram of the BM nanoparticles displayed an unusual “ core-shell” contrast and has a bright central part and dark outer part indicating the formation of core-shell nanostructure, where the bold central part corresponds to the expected Ag core (seed) and the chain like out part to the Pt shell (Fig. 4c). The average size trend was as follows: Ag NPs, Pt NPs, and Ag-Pt NPs 1:1 as 60 ± 9.4, 2.5 ± 0.5, and 20.7 ± 9.0 nm, respectively. de Dios et al. [27] argue that slower reaction results in more nucleation than growth; thus the longer time is taken during formation the smaller the particle size. This explains the high density of the Pt NPs (Fig. 4b) in our case. Particle morphology differences could be due to surface segregation or a change in the growth kinetics with AgNO3/PtCl62- molar ratio due to Ag seeding.
A representative detailed section of the SAED image in Fig. 4 further corroborates the crystalline nature of these metal nanoparticles as indicated by presence of ring patterns. These patterns reveal the single face-centered cubic (fcc) crystalline nature of the spherical nanoparticles as similarly reported [25, 30]. At higher magnifications, the crystalline nature of silver cores is visible by the appearance of lattice fringes. Electron diffraction reveals that the Ag and Pt BM nanoparticles are crystalline with fcc packing arrangements of bulk metals. The SAED pattern from BM NPs showed a ring pattern of randomly overlapped and sharp diffraction spots, which corresponds to the reported planes in Pt-based alloys [1]. Such interaction can be sensitive to the concentration of precursors and reaction condition. Although the atomic ratio of Ag and Pt in the core shell nanoparticles was found to be varied, core shell formation was good, as evidenced by TEM micrographs.
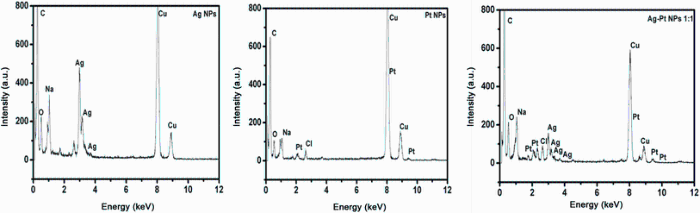
EDX results showed sharp strong signal in the silver region of between 2 and 4 keV [31] due to SPR, thus confirming the presence of elemental silver (Fig. 5 Ag NPs). The emission energy at 3 keV indicates the reduction of silver ions to element of silver. As for Pt NPs, presence of Pt in the suspension was confirmed by characteristic signals around 10 keV from the EDX spectra, as previously observed [31, 32]. From the Ag-Pt core-shell (1:1) NPs spectra, there are clearly five peaks located between 2 and 4 keV. The characteristic signal for Pt is equally visible, thus confirming presence of Pt and Ag in the BM NPs. All spectra had a maximum located on the left part of the spectrum at 0.2 keV due to carbon as well as strong Cu peaks which are attributed to the Cu-stubs used in sample preparations. The hardly visible maximum located at 0.5 keV is attributed to the oxygen characteristic line. The carbon and oxygen spectra as well as some of the weak signals for Na and Cl observed in the samples indicate the presence of stabilizers composed of alkyl chains and reagents remains/byproducts, respectively.
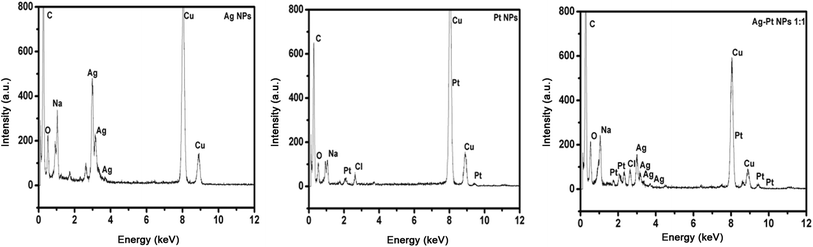 | Fig. 5 EDX characterization spectra obtained for Ag, Pt, and Ag-Pt 1:1 nanoparticles |
Kinetics and first-order fitting of the formation of core-shell Ag-Pt NPs (1:1) are reported. Fast first-order kinetics constants for Ag and the BM opposed to the ten times slower Pt indicates that BM formation kinetics is reduced as a result of Ag seeding of the Pt formation. These findings are supported by the literature as indicated above. Successful synthesis of 20-nm-sized BM from the one-pot reduction with a citrate in aqueous solutions is rare. Common practice involves usage of non-aqueous solutions to reduce size and ensure absence of AgCl precipitate. The advantages of this one-pot synthesis are the reduced synthesis time and fewer impurities from by products, capping agents and solvents. From the morphological studies, Ag has been identified as the core and the Pt as the shell, which corroborates the kinetics of the monometallic. This study, through EDX data, has proved that all NPs are capped with the citrate used for the reduction of their precursors. The data indicate a possibility of nanomaterials size manipulating based on precursor ratios as well as synthesis reduction time.
The authors thank Cape Peninsula University of Technology for funding and DAAD Germany for their support.
The authors have declared that no competing interests exist.
| [1] |
|
| [2] |
|
| [3] |
|
| [4] |
|
| [5] |
|
| [6] |
|
| [7] |
|
| [8] |
|
| [9] |
|
| [10] |
|
| [11] |
|
| [12] |
|
| [13] |
|
| [14] |
|
| [15] |
|
| [16] |
|
| [17] |
|
| [18] |
|
| [19] |
|
| [20] |
|
| [21] |
|
| [22] |
|
| [23] |
|
| [24] |
|
| [25] |
|
| [26] |
|
| [27] |
|
| [28] |
|
| [29] |
|
| [30] |
|
| [31] |
|
| [32] |
|