Analysis of Stored Energy in Cold-Rolled Copper Using Bulk and Microstructure-Based Techniques
|
Analysis of Stored Energy in Cold-Rolled Copper Using Bulk and Microstructure-Based Techniques |
| Shan-Quan Deng, Andy Godfrey, Wei Liu |
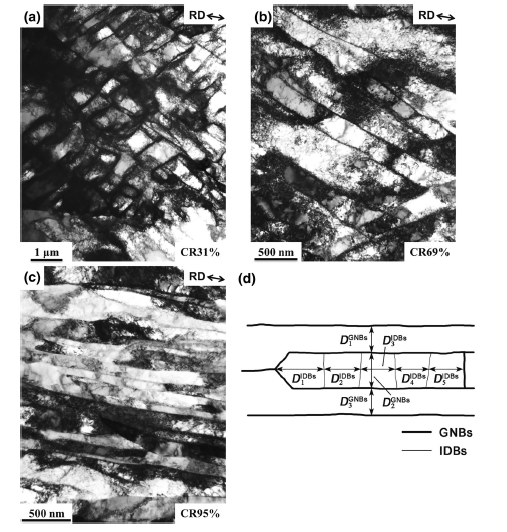
| Fig. 1 Example TEM images showing typical dislocation cell-block morphologies in samples of Cu cold-rolled to strains of 0.42 a, 1.36 b and 3.43 c; d schematic showing the approach used for determination of the dislocation boundary data from the TEM observations. In this case, three individual GNB spacings |
|
|