Arash Fattah-Alhosseini, Mojtaba Vakili-Azghandi, Mohsen K. Keshavarz. Influence of Concentrations of KOH and Na2SiO3 Electrolytes on the Electrochemical Behavior of Ceramic Coatings on 6061 Al Alloy Processed by Plasma Electrolytic Oxidation . Acta Metallurgica Sinica(English Letters), 2016, 29(3): 274-281
Copyright reserved, Editorial board of Acta Metallurgica Sinica(English Letters)
Influence of Concentrations of KOH and Na2SiO3 Electrolytes on the Electrochemical Behavior of Ceramic Coatings on 6061 Al Alloy Processed by Plasma Electrolytic Oxidation
Arash Fattah-Alhosseini1, Mojtaba Vakili-Azghandi1, Mohsen K. Keshavarz2
1 Department of Materials Engineering, Bu-Ali Sina University, Hamedan 65178-38695, Iran
2 Department of Engineering Physics, Polytechnique Montreal,Montreal, Canada
In this study, ceramic coatings were deposited on 6061 Al alloy using a plasma electrolytic oxidation (PEO) technique, and the effect of concentrations of KOH and Na2SiO3 as electrolytes for PEO process was studied on microstructure, chemical composition, and electrochemical behavior of PEO coatings formed on the 6061 Al alloy. The results indicated that the increase in concentration of KOH led to rise in electrical conductivity of electrolyte. Consequently, the breakdown voltage reduced, which in turn improved the surface quality and the corrosion behavior. Moreover, the increase in concentration of Na2SiO3 resulted in the increase in incorporation of Si in the coating, which led to a higher corrosion potential in the concentration of 4 g L-1. According to this investigation, the best protection behavior of coatings can be obtained when the KOH and Na2SiO3 concentrations in PEO electrolyte are equal to 4 g L-1.
The applications of light metals, especially Al alloys, have been developing in various industries such as aerospace and automotive in the past few decades. This is due to the low density of these alloys compared to steel, their strength-to-weight ratio, and their great potential for recycling as well as less complicated fabrication processes of Al alloys [1]. These metals are reactive and rather soft, and therefore, they need careful finishing treatment that lead to the production of coatings on their surfaces with suitable resistance to both wear and corrosion [2, 3, 4].
Plasma electrolytic oxidation (PEO) is a widely used surface treatment process to form a fairly thick ceramic coating on Al and other light alloys [5, 6]. In the PEO process, there is a high electrical voltage between two electrodes in an electrolyte. The growth of the oxide coating layer (ceramic) on the Al surface, which works as anode electrode, is due to electrical discharges on the surface [7, 8, 9].
There are two types of factors that affect the formation and microstructure of PEO coatings, i.e., intrinsic (electrolyte compositions and pH value) and extrinsic factors (applied potential types, electrical parameters, and electrolyte temperature) [6, 10]. The intrinsic effects of the electrolyte can be abstracted as follows: (1) the first and most important effect; promoting metal passivation to form a thin insulating layer, which is a basic prerequisite for dielectric breakdown to induce spark discharge; (2) providing the oxysalt needed for oxidation as oxygen source; (3) as the medium to conduct current, and transmission of the essential energy required for anode oxidation to occur at the interface of substrate/electrolyte; (4) finally and also interestingly, modification and improvement of the PEO coating properties by incorporation of components, which are present in the electrolyte, into the coatings. Accordingly, the investigations have shown that the best electrolytes for PEO process are KOH and NaOH (pH 7-12) [11, 12].
Additives such as silicates, aluminates, and phosphates are widely used as basic constituents of the electrolytes to provide the prerequisite of dielectric breakdown. These additives decrease the sparking voltage, thus save time and improve coating quality. On the other hand, components supplied in the electrolyte (such as SiO32-, AlO2-, and PO43-) increase the coating growth rate and thickness by poly-reactions and deposition on the surface [6, 13, 14].
The formed ceramic coating by PEO in various alkaline electrolytes contains a mixture of phases and compositions that solidified on the anode surface. In the silicate alkaline electrolyte, the PEO layers are commonly consisted of gamma alumina (γ -Al2O3), alpha alumina (α -Al2O3), mullite, and amorphous alumina. After solidification, the PEO coating surface consists of some solidified pools around the craters and microcracks due to surface tension. Therefore, corrosion behavior of coating, which depends on its phases and microstructure, alters by varying the electrolyte chemistry [15, 16].
Although some studies have been reported on the corrosion behavior of the coatings formed on the Al alloys during PEO process, there is still lack of knowledge on the electrochemical behavior of such coatings on 6061 Al alloy. In the present work, the effects of chemistry of silicate alkaline electrolytes on the discharge characteristics, structure, composition, and corrosion behavior of oxide layer formed by PEO process are studied. Also, the surface morphology and microstructure of coatings are investigated. For this purpose, electrolytes containing KOH and Na2SiO3 with different concentrations were used. The surface characteristics of the coatings were investigated by scanning electron microscopy (SEM) and X-ray diffraction (XRD) analysis. Also, potentiodynamic polarization and electrochemical impedance spectroscopy (EIS) were applied to study the electrochemical behavior of PEO coatings.
2 Experimental
2.1 PEO Coating Process
Specimens were fabricated from a thick plate of 6061 Al alloy with the following chemical composition (in wt pct): Mg 0.9, Si 0.7, Fe 0.35, Cu 0.23, Cr 0.19, Mn 0.02, Ti 0.01, Zr 0.06, and balance Al. All samples were ground to P2500 (FEPA Standard) grit and cleaned with deionized water prior to coating process.
The main components of electrolyte systems were KOH and Na2SiO3. The PEO process was applied to two sets of samples. Samples of set S1 to S3 were in electrolytes with different concentrations of KOH (2-4 g L-1) in Na2SiO3 (2 g L-1), while a constant DC current density of (10 A dm-2) was used with processing time of 1800 s at 30 ° C. The coatings on the samples of set S3 to S5 were formed in electrolytes with different concentrations of Na2SiO3 (2-4 g L-1) in optimized KOH obtained from the set S1 to S3 (optimized concentration was 4 g L-1) when the rest of processing parameters were kept the same as for samples of set S1 to S3. Different chemistry conditions are listed in Table 1.
Table 1
Table 1
Table 1 Different chemistry conditions of electrolytes used for PEO coating process of 6061 Al alloy samples
Samples
S1
S2
S3
S4
S5
KOH (g L-1)
2
3
4
4
4
Na2SiO3 (g L-1)
2
2
2
3
4
Table 1 Different chemistry conditions of electrolytes used for PEO coating process of 6061 Al alloy samples
2.2 Characterization of PEO Coatings
The surface morphologies of PEO-treated samples were investigated by SEM (JEOL JSM-840A). Phase analysis of the coatings was carried out using XRD analysis with Italstructures APD2000 diffractometer using CuKα radiation with diffraction angle 2θ range of 10° -80° .
2.3 Electrochemical Measurements
The corrosion resistance was measured by using a µ Autolab Type III/FRA2 electrochemical measurement apparatus with three-electrode system: The reference electrode was Ag/AgCl (in saturated KCl solution); auxiliary electrode was platinum; working electrodes were coated and uncoated samples; and corrosion medium was 3.5 wt% NaCl solution, pH 7. Prior to the electrochemical measurements, working electrodes were immersed at open-circuit potential conditions for 3600 s in 3.5 wt% NaCl solution to form a steady state.
1. A scan rate of 1 mV s-1 was used to obtain potentiodynamic polarization curves starting from -0.25 V (vs. corrosion potential (Ecorr)).
2. EIS tests were implemented at open-circuit potential conditions and AC potential with the amplitude of 10 mV and a frequency range of 100 kHz to 62.7 MHz. To model the EIS data and use curve-fitting method, the EIS analyzer software was used.
3 Results and Discussion
3.1 Voltage-Time Response
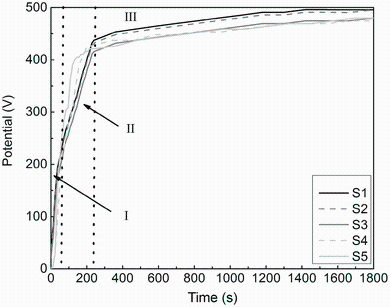
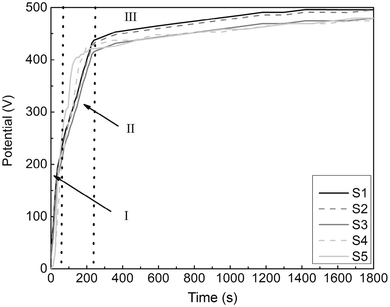
Variation in electrolytes affects the voltage-time curves during the PEO process. The changes in the voltage in the electrolyte by variation in concentrations of KOH and Na2SiO3 in the solution are shown in Fig. 1. Former studies have shown that during the PEO process, there are three stages in the voltage-time curve [17, 18, 19, 20]. In the stage I, due to the formation of barrier (passive or oxide) layer on anode surface, the voltage increases rapidly with time. In the stage II, around 60 s from the beginning of the PEO process, the voltage continuously increases with time, but with lower slope of the voltage-time response compared to that of the first stage. Eventually, the voltage surpasses the breakdown voltage, and lots of small white sparks appear, which are uniformly dispersed and move quickly on the anode surface. In the stage III, the increase in the voltage reaches a relatively stable value, and the sparks become more evident where their color changes from white to orange/red. In Fig. 1, it can be seen that the values of breakdown voltage reduced with the increase in KOH concentration. The value of breakdown voltage decreases as the electrolyte conductivity increases [18, 19]. According to Fig. 1, addition of Na2SiO3 to optimized KOH solution (optimized concentration of KOH is 4 g L-1) increased the rate of formation of barrier (passive or oxide) layer, and consequently, the spark discharges appeared in a shorter period of time.
Fig. 1 Time versus voltage curves of PEO-treated 6061 Al alloy samples at different concentrations of KOH and Na2SiO3
3.2 Potentiodynamic Polarization Measurements
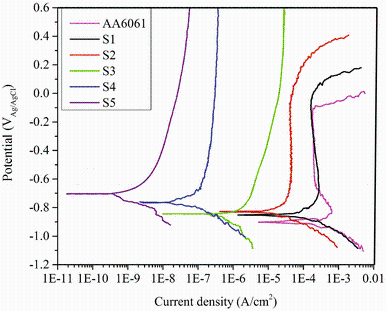
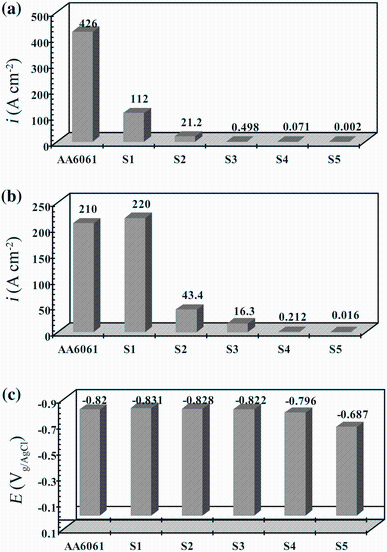
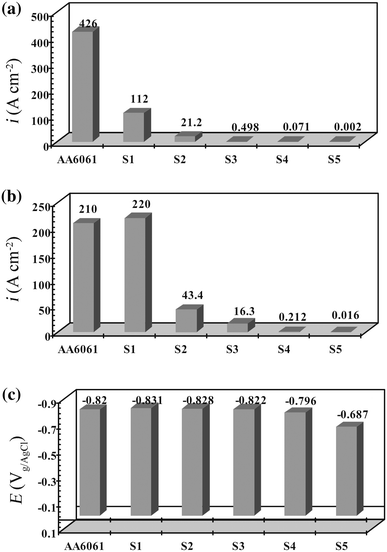
The polarization curves of different PEO-coated and uncoated samples, in 3.5 wt% NaCl solution, are illustrated in Fig. 2. The effect of KOH and Na2SiO3 concentrations on potentiodynamic polarization behavior is shown in Fig. 2. The key factors of corrosion resistance are the corrosion potential (Ecorr), the corrosion current density (icorr), and the oxide layer corrosion rate (iox), which is obtained from the polarization curves. The corrosion current density was obtained based on the Tafel linear extrapolation method [21]. This can be obtained when the extrapolation of Tafel line with good linear relationship intersects the corrosion potential. The effect of different concentrations of KOH and Na2SiO3 on the corrosion current density, passive corrosion density, and corrosion potential of 6061 Al alloy with and without PEO coatings is shown in Fig. 3.
Fig. 3 Variations in the corrosion current density a, passive corrosion density b, and corrosion potential c of 6061 Al alloy with and without PEO coatings
Comparing the potentiodynamic polarization curves of PEO coatings with bare alloy revealed that after PEO treatment, especially when a thick film was formed, both anodic and cathodic polarization curves are shifted to lower current densities. This means that the anodic and cathodic processes were controlled by the PEO coatings in different concentrations of KOH and Na2SiO3. It is also seen that the corrosion potentials of PEO-coated samples increased compared to that of bare alloy sample, while corrosion current densities of coated samples decreased after PEO process.
As shown in Fig. 3, when the KOH concentration increased, the corrosion potential of PEO-coated alloy increased as well. However, corrosion current density dropped. This is attributed to the decrease in breakdown voltage with increasing KOH concentration. The decrease in breakdown voltage can create PEO coating with finer features and smaller craters as a result of finer sparks with higher spatial density [22, 23].
As reported in Fig. 3, increasing the Na2SiO3 concentration led to augmentation in the corrosion potential of PEO-coated alloy while the corrosion current density decreased. Also, the addition of Na2SiO3 in optimized KOH solution enhanced the growth rate, which may be attributed to the promotion of the Si-rich species formation on the coating surface, as a result of the incorporation of more silicate into the coating structure [24, 25, 26]. Therefore, corrosion potential abruptly moved to positive values.
3.3 EIS Measurements
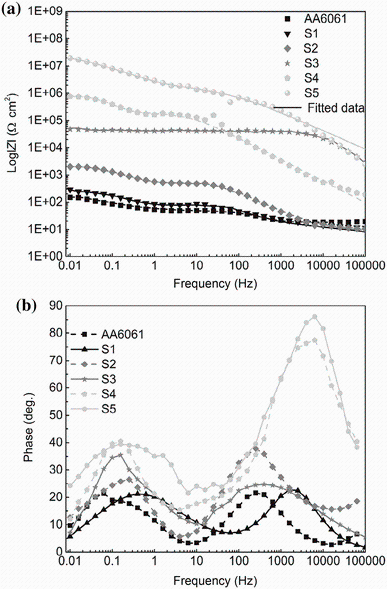
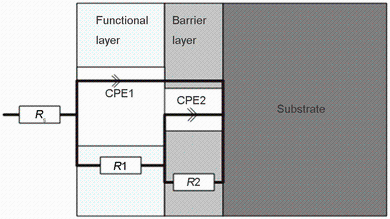
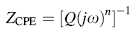
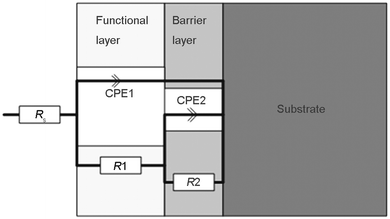
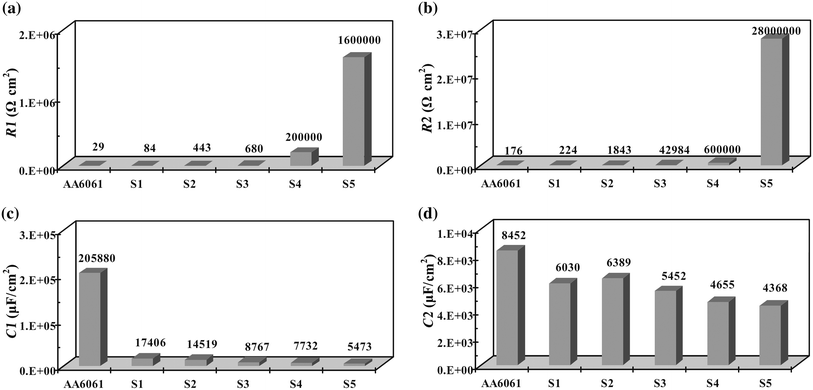
Using the EIS measurements, we investigated the effect of KOH and Na2SiO3 concentrations on the corrosion characteristics of uncoated and the PEO-coated 6061 Al alloys, in a 3.5 wt% NaCl solution. The Bode and phase plots of PEO-coated and uncoated 6061 Al alloy in different concentrations of KOH and Na2SiO3 are shown in Fig. 4. As illustrated in these figures, there are two time constants in the spectra of all the testing times. Also, two steps can be found in the corresponding Bode module, and two bumps can be seen in the corresponding phase plots: The first one appeared at high frequency, which corresponds to the resistance of the pores and defects such as the discharge channels in the outer functional layer of the PEO coating, and the second one appeared at low frequency, which represents the inner barrier layer of 6061 Al alloy in the corrosion medium [4, 27]. The increase in the step levels by increasing KOH and Na2SiO3 in the solution indicates that the corrosion resistance of PEO-coated alloys enhanced at those concentrations. The equivalent circuit is illustrated in Fig. 5. Using this circuit, we fitted the experimental data. In this equivalent circuit, Rs represents the solution resistance between the PEO-coated or uncoated samples and the reference electrode. The value of Rs depends primarily on the geometry of the electrochemical cell and the conductivity of the corrosion test solution. In our investigation, the obtained values of Rs were consistently small (< 50 Ω cm-2). Also, R1 stands for the resistance of the pores and defects in the outer functional layer of the PEO coating, and is in parallel with a constant phase element (CPE), CPE1. R2 is the resistance of the barrier layer of the PEO coating and is in parallel with a constant phase element, CPE2 [27, 28, 29, 30, 31]. The impedance of a CPE can be represented by the following formula [27, 28]:
(1)
where Q is the CPE constant, j represents the imaginary unit, ω is the angular frequency (rad/s) of the sine wave defined as ω = 2π f (f is the frequency in Hz), and n indicates CPE exponent representing the physical meaning of the CPE that varies in a range from 0 to 1. A value of zero for n implies pure resistance (R), and a value of 1 indicates pure capacitance (C).
Fig. 5 Equivalent electrical circuits used to fit the impedance data of 6061 Al alloy with and without PEO coatings
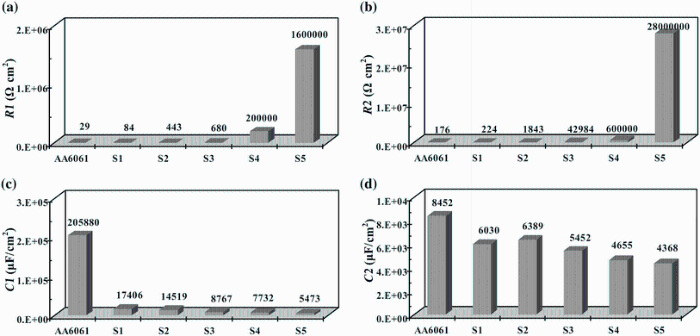
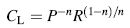
Figure 6 presents the fitted parameters of circuit elements of EIS tests. The results showed that corrosion resistance of oxide layer on the surface of electrode was improved by PEO processing, and capacitance of layers (CL) decreased with increase in KOH and Na2SiO3 concentrations. The significant reduction in capacitance, when the KOH and Na2SiO3 concentrations increase, is attributed to the modification and improvement of structure of the ceramic layer on the 6061 Al alloy surface. According to Eqs. (2) and (3), this reduction in CL is due to the changes in characteristics of layers at the surface [32, 33, 34].
Fig. 6 Variations in the corrosion resistance of functional layer a, corrosion resistance of barrier b, capacitance of functional layer c, and capacitance of barrier layer d of 6061 Al alloy with and without PEO coatings
In Eq. (2) P, n, and R are the constant phase element parameter, deviation parameter, and resistance of layers on 6061 Al alloy, respectively, and in Eq. (3), d is the thickness of the layer, S stands for the surface area of the electrode, ε 0 represents the permittivity of the air, and ε is the local dielectric constant. The decrease in C can be attributed to the formation of a thicker protective layer at electrode surface and/or reduction in local dielectric constant as a result of variation in the composition of the layer with the increase in KOH and Na2SiO3 concentrations [27, 32, 35]. The results of impedance measurement showed that a minimum corrosion resistance is observed for the 6061 Al alloy with the maximum value recorded for the sample S5. Therefore, it can be concluded that the total resistance of the system (R), i.e., the sum of R1 andR2 values, increases at higher KOH and Na2SiO3 concentrations.
3.4 SEM Morphologies
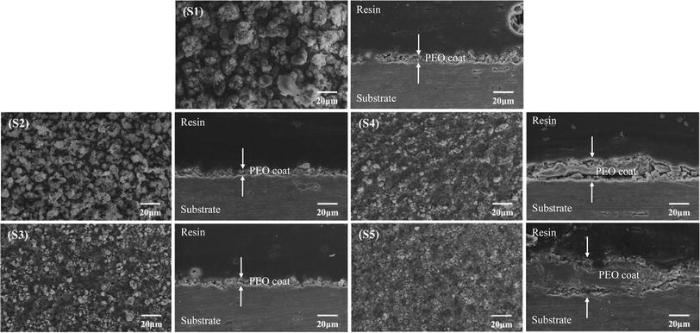
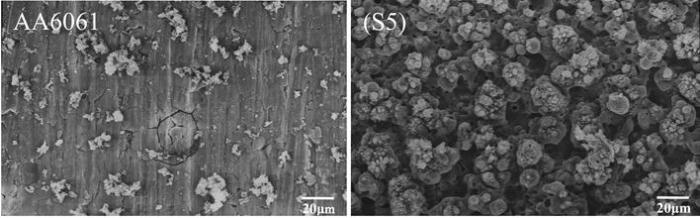
Figure 7 shows SEM morphology of coatings formed on 6061 Al alloy samples at different concentrations of KOH and Na2SiO3. The agglomeration of particles on the surface can be seen for samples S1 and S2. These agglomerated particles became smoother in sample S3, and some crater-like features turned out of the surface. It was observed that the size of these crater-like features tended to decrease, and surface was more thickly covered with nodular features as the KOH concentration increased, while the morphology of PEO coating did not have much change and the coating thickness increased as the Na2SiO3 concentration increased in samples S4 and S5 [4, 24]. These SEM micrographs confirmed the results achieved from the potentiodynamic polarization and EIS results.
Fig. 7 SEM micrographs of cross sections and surfaces of coatings of samples S1, S2, S3, S4, and S5, respectively
3.5 Phase Analysis
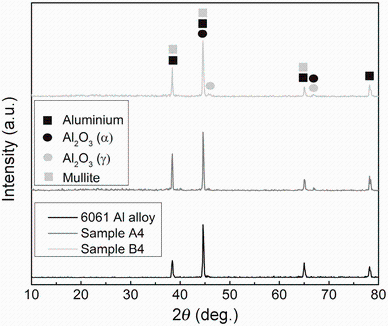
The XRD patterns of PEO layers produced by the optimum concentrations of KOH and Na2SiO3, as well as uncoated alloy, are shown in Fig. 8. The strong diffraction peaks of the Al substrate were detected in all samples since the PEO layers are thin and porous; thus, the X-rays can easily penetrate them. As it is shown, the main phases of PEO layers are α -Al2O3 and γ - Al2O3, which are similar to the reported in Refs. [9, 16].
Fig. 8 XRD patterns of 6061 Al alloy, sample S3, and sample S5
In addition, mullite (Al2O3· nSiO2), which is a well-known ceramic phase considered as a phase with good thermal and chemical stabilities, was also identified in XRD patterns of coated samples. The α -Al2O3 is a well-known phase with trigonal crystal structure, high stability, and a high melting point of 2050 ° C, where meta-stable γ -Al2O3 phase transforms into α -Al2O3 in the temperature interval between 800 and 1200 ° C [36, 37].
In the PEO process of Al alloys, first and before plasma discharge, a thin film of gamma alumina is formed during the preliminary oxidation step. Previous studies have shown that through the solidification of alumina droplets in the plasma spraying process, α -Al2O3 tends to form if the cooling rate is high. Also, the molten γ -Al2O3 is injected into the electrolyte passing through the discharging channel, so it will be quenched in a high cooling rate as soon as it becomes in contact with the electrolyte; consequently, α -Al2O3 favors to form at the outer surface [9, 38].
3.6 Effect of Corrosion Duration
The corroded surfaces of the PEO-coated [in 4 g L-1 KOH and Na2SiO3 solution (S5)] and uncoated samples, which were immersed in 3.5 wt% NaCl solution for 600 h, are studied by SEM. As illustrated in Fig. 9, after immersion in NaCl solution, the initially polished surface of 6061 Al alloy became rough and severely corroded; as a result, a distribution of several pits and cracks can be clearly seen on the surface of uncoated alloy. Also, the surface of the sample was covered with a thick inhomogeneous layer and dispersion of corrosion products, due to the localized attack of the chloride ions. In contrast, on the surface of sample S5, which is PEO-coated, there is less evidences of corrosion attack and the surface of the specimen is practically unchanged.
Fig. 9 SEM micrographs of surfaces of 6061 Al alloy a, and sample S5 b after 600-h immersion in 3.5 wt% NaCl solution
4 Conclusions
1. The increase in concentration of KOH leads to augmentation of the electrolyte electrical conductivity and, consequently, reduces the breakdown voltage, which can create PEO coatings with finer crater and feature. Higher concentrations of Na2SiO3 in the PEO electrolyte result in the increase in Si incorporation in the coat, which leads to increase in the coat thickness and corrosion potential.
2. The PEO layers are composed of gamma alumina (γ -Al2O3), alpha alumina (α -Al2O3), mullite (Al2O3· nSiO2), and amorphous alumina. By increasing the Na2SiO3 concentration from 2 to 4 g L-1, the average thickness of the PEO coat increases.
The authors have declared that no competing interests exist.
M. Shokouhfar, C. Dehghanian, M. Montazeri, A. Baradaran, Appl. Surf. Sci. 258, 2416(2012)[Cite with in:4]
[28]
R. O. Hussein, D. O. Northwood, X. Nie, Surf. Coat. Technol. 237, 357(2013)[Cite with in:2]
[29]
N. M. Alanazi, A. Leyland , A. L. Yerokhin, A. Matthews, Surf. Coat. Technol. 205, 1750(2010)[Cite with in:1]
[30]
X. L. Zhang, Y. F. Zhang, L. M. Chang, Z. H. Jiang, Z. P. Yao, X. W. Liu, Mater. Chem. Phys. 132, 909(2012)[Cite with in:1]
[31]
A. Venugopal, R. Pand a, S. Manwatkar, K. Sreekumar, L. R. Krishna, G. Sundararajan, Trans. Nonferrous Met. Soc. China22, 700 (2012)[Cite with in:1]
[32]
M. V. Azghand i, A. Davoodi, G. A. Farzi, A. Kosari, Corros. Sci. 64, 44(2012)[Cite with in:2]
[33]
B. Hirschorn, M. E. Orazem, B. Tribollet, V. Vivier, I. Frateur, M. Musiani, Electrochim. Acta55, 6218 (2010)[Cite with in:1]
[34]
A. Ehsani, M. Nasrollahzadeh, M. G. Mahjani, R. Moshrefi, H. Mostaanzadeh, J. Ind. Eng. Chem. 20, 4363(2014)[Cite with in:1]
[35]
F. Bentiss, M. Traisnel, M. Lagrenee, Corros. Sci. 42, 127(2000)[Cite with in:1]
[36]
H. H. Wu, Z. S. Jin, B. Y. Long, F. R. Yu, X. Y. Li, Chin. Phys. Lett. 20, 1815(2003)[Cite with in:1]
[37]
T. B. Wei, F. Y. Yan, J. Tian, J. Alloys Compd. 389, 169(2005)[Cite with in:1]
[38]
M. S. J. Gani, R. Mcferson, Thermochim. Acta7, 251 (1973)[Cite with in:1]
1
2004
0.0
0.0
... This is due to the low density of these alloys compared to steel, their strength-to-weight ratio, and their great potential for recycling as well as less complicated fabrication processes of Al alloys [1] ...
1
2010
0.0
0.0
... These metals are reactive and rather soft, and therefore, they need careful finishing treatment that lead to the production of coatings on their surfaces with suitable resistance to both wear and corrosion [2,3,4] ...
1
2000
0.0
0.0
... These metals are reactive and rather soft, and therefore, they need careful finishing treatment that lead to the production of coatings on their surfaces with suitable resistance to both wear and corrosion [2,3,4] ...
3
2013
0.0
0.0
... These metals are reactive and rather soft, and therefore, they need careful finishing treatment that lead to the production of coatings on their surfaces with suitable resistance to both wear and corrosion [2,3,4] ...
... Also, two steps can be found in the corresponding Bode module, and two bumps can be seen in the corresponding phase plots: The first one appeared at high frequency, which corresponds to the resistance of the pores and defects such as the discharge channels in the outer functional layer of the PEO coating, and the second one appeared at low frequency, which represents the inner barrier layer of 6061 Al alloy in the corrosion medium [4, 27] ...
... It was observed that the size of these crater-like features tended to decrease, and surface was more thickly covered with nodular features as the KOH concentration increased, while the morphology of PEO coating did not have much change and the coating thickness increased as the Na2SiO3 concentration increased in samples S4 and S5 [4, 24] ...
1
2009
0.0
0.0
... Plasma electrolytic oxidation (PEO) is a widely used surface treatment process to form a fairly thick ceramic coating on Al and other light alloys [5, 6] ...
3
2010
0.0
0.0
... Plasma electrolytic oxidation (PEO) is a widely used surface treatment process to form a fairly thick ceramic coating on Al and other light alloys [5, 6] ...
... , intrinsic (electrolyte compositions and pH value) and extrinsic factors (applied potential types, electrical parameters, and electrolyte temperature) [6, 10] ...
... On the other hand, components supplied in the electrolyte (such as SiO32-, AlO2-, and PO43-) increase the coating growth rate and thickness by poly-reactions and deposition on the surface [6, 13, 14] ...
1
2013
0.0
0.0
... The growth of the oxide coating layer (ceramic) on the Al surface, which works as anode electrode, is due to electrical discharges on the surface [7,8,9] ...
1
2013
0.0
0.0
... The growth of the oxide coating layer (ceramic) on the Al surface, which works as anode electrode, is due to electrical discharges on the surface [7,8,9] ...
3
2009
0.0
0.0
... The growth of the oxide coating layer (ceramic) on the Al surface, which works as anode electrode, is due to electrical discharges on the surface [7,8,9] ...
... [9, 16] ...
... -Al2O3 favors to form at the outer surface [9, 38] ...
1
2007
0.0
0.0
... , intrinsic (electrolyte compositions and pH value) and extrinsic factors (applied potential types, electrical parameters, and electrolyte temperature) [6, 10] ...
1
2015
0.0
0.0
... Accordingly, the investigations have shown that the best electrolytes for PEO process are KOH and NaOH (pH 7-12) [11, 12] ...
1
2012
0.0
0.0
... Accordingly, the investigations have shown that the best electrolytes for PEO process are KOH and NaOH (pH 7-12) [11, 12] ...
1
2009
0.0
0.0
... On the other hand, components supplied in the electrolyte (such as SiO32-, AlO2-, and PO43-) increase the coating growth rate and thickness by poly-reactions and deposition on the surface [6, 13, 14] ...
1
2013
0.0
0.0
... On the other hand, components supplied in the electrolyte (such as SiO32-, AlO2-, and PO43-) increase the coating growth rate and thickness by poly-reactions and deposition on the surface [6, 13, 14] ...
1
2009
0.0
0.0
... Therefore, corrosion behavior of coating, which depends on its phases and microstructure, alters by varying the electrolyte chemistry [15, 16] ...
2
2014
0.0
0.0
... Therefore, corrosion behavior of coating, which depends on its phases and microstructure, alters by varying the electrolyte chemistry [15, 16] ...
... [9, 16] ...
1
1999
0.0
0.0
... Former studies have shown that during the PEO process, there are three stages in the voltage-time curve [17,18,19,20] ...
2
2006
0.0
0.0
... Former studies have shown that during the PEO process, there are three stages in the voltage-time curve [17,18,19,20] ...
... The value of breakdown voltage decreases as the electrolyte conductivity increases [18, 19] ...
2
2005
0.0
0.0
... Former studies have shown that during the PEO process, there are three stages in the voltage-time curve [17,18,19,20] ...
... The value of breakdown voltage decreases as the electrolyte conductivity increases [18, 19] ...
1
2012
0.0
0.0
... Former studies have shown that during the PEO process, there are three stages in the voltage-time curve [17,18,19,20] ...
1
2005
0.0
0.0
... The corrosion current density was obtained based on the Tafel linear extrapolation method [21] ...
1
2013
0.0
0.0
... The decrease in breakdown voltage can create PEO coating with finer features and smaller craters as a result of finer sparks with higher spatial density [22, 23] ...
1
2010
0.0
0.0
... The decrease in breakdown voltage can create PEO coating with finer features and smaller craters as a result of finer sparks with higher spatial density [22, 23] ...
2
1996
0.0
0.0
... Also, the addition of Na2SiO3 in optimized KOH solution enhanced the growth rate, which may be attributed to the promotion of the Si-rich species formation on the coating surface, as a result of the incorporation of more silicate into the coating structure [24,25,26] ...
... It was observed that the size of these crater-like features tended to decrease, and surface was more thickly covered with nodular features as the KOH concentration increased, while the morphology of PEO coating did not have much change and the coating thickness increased as the Na2SiO3 concentration increased in samples S4 and S5 [4, 24] ...
1
2012
0.0
0.0
... Also, the addition of Na2SiO3 in optimized KOH solution enhanced the growth rate, which may be attributed to the promotion of the Si-rich species formation on the coating surface, as a result of the incorporation of more silicate into the coating structure [24,25,26] ...
1
2013
0.0
0.0
... Also, the addition of Na2SiO3 in optimized KOH solution enhanced the growth rate, which may be attributed to the promotion of the Si-rich species formation on the coating surface, as a result of the incorporation of more silicate into the coating structure [24,25,26] ...
4
2012
0.0
0.0
... Also, two steps can be found in the corresponding Bode module, and two bumps can be seen in the corresponding phase plots: The first one appeared at high frequency, which corresponds to the resistance of the pores and defects such as the discharge channels in the outer functional layer of the PEO coating, and the second one appeared at low frequency, which represents the inner barrier layer of 6061 Al alloy in the corrosion medium [4, 27] ...
... R2 is the resistance of the barrier layer of the PEO coating and is in parallel with a constant phase element, CPE2 [27,28,29,30,31] ...
... The impedance of a CPE can be represented by the following formula [27, 28]: ...
... The decrease in C can be attributed to the formation of a thicker protective layer at electrode surface and/or reduction in local dielectric constant as a result of variation in the composition of the layer with the increase in KOH and Na2SiO3 concentrations [27, 32, 35] ...
2
2013
0.0
0.0
... R2 is the resistance of the barrier layer of the PEO coating and is in parallel with a constant phase element, CPE2 [27,28,29,30,31] ...
... The impedance of a CPE can be represented by the following formula [27, 28]: ...
1
2010
0.0
0.0
... R2 is the resistance of the barrier layer of the PEO coating and is in parallel with a constant phase element, CPE2 [27,28,29,30,31] ...
1
2012
0.0
0.0
... R2 is the resistance of the barrier layer of the PEO coating and is in parallel with a constant phase element, CPE2 [27,28,29,30,31] ...
1
2012
0.0
0.0
... R2 is the resistance of the barrier layer of the PEO coating and is in parallel with a constant phase element, CPE2 [27,28,29,30,31] ...
2
2012
0.0
0.0
... (2) and (3), this reduction in CL is due to the changes in characteristics of layers at the surface [32,33,34] ...
... The decrease in C can be attributed to the formation of a thicker protective layer at electrode surface and/or reduction in local dielectric constant as a result of variation in the composition of the layer with the increase in KOH and Na2SiO3 concentrations [27, 32, 35] ...
1
2010
0.0
0.0
... (2) and (3), this reduction in CL is due to the changes in characteristics of layers at the surface [32,33,34] ...
1
2014
0.0
0.0
... (2) and (3), this reduction in CL is due to the changes in characteristics of layers at the surface [32,33,34] ...
1
2000
0.0
0.0
... The decrease in C can be attributed to the formation of a thicker protective layer at electrode surface and/or reduction in local dielectric constant as a result of variation in the composition of the layer with the increase in KOH and Na2SiO3 concentrations [27, 32, 35] ...
1
2003
0.0
0.0
... C [36, 37] ...
1
2005
0.0
0.0
... C [36, 37] ...
1
1973
0.0
0.0
... -Al2O3 favors to form at the outer surface [9, 38] ...
Influence of Concentrations of KOH and Na2SiO3 Electrolytes on the Electrochemical Behavior of Ceramic Coatings on 6061 Al Alloy Processed by Plasma Electrolytic Oxidation
[Arash Fattah-Alhosseini1, Mojtaba Vakili-Azghandi1, Mohsen K. Keshavarz2]


 , Mojtaba Vakili-Azghandi