The structure, the morphology and the thermal, optical and the surface properties of nanocrystalline CeO2doped with Mn have been studied by X-ray diffraction (XRD), field-emission transmission electron microscopy (FE-TEM), energy-dispersive X-ray analysis, thermogravimetric analysis, UV-Vis absorption spectroscopy and Fourier transform infrared spectroscopy. The XRD results confirmed the successful incorporation of Mn into the CeO2 lattice through the formation of nanoscale face-centered cubic solid solution. The FE-TEM observations supported the nanocrystalline nature of the solid solutions. The presence of structural defects and their role on the band gap have been discussed on the basis of absorption spectral studies. The structural differences correlate with results from temperature-programmed reaction (TPR) experiments with H2 consumption. The TPR measurements showed an enhanced bulk reduction at much lower temperatures, indicating increased oxygen mobility in the samples, which enable to enhanced oxygen diffusion at lower temperatures.
Keyword:
Cerium oxide nanoparticle; Manganese; Band gap energy; Redox property
Recently, researches in semiconducting metal oxide nanoparticles are attracted considerable interest owing to their wide applications in nanoelectronics, photonics, data storage and sensing [1, 2, 3, 4]. In general, due to the peculiar characteristics and size effects, semiconducting metal oxide nanomaterials often exhibit the novel physical properties compared to those of bulk analogue. This gives rise to new possibilities to further modify the systems and to improve them with respect to technological applications [2, 3]. The innovative structures were being exploited for optical, electrical and magnetic applications in electrochemical and spintronics devices [2]. Among the semiconductor metal oxides, cerium oxide (CeO2) has attracted much interest owing to its distinctive properties including high mechanical strength, oxygen ion conductivity, optically active, high isoelectric point (IEP), excellent high adsorption capability and oxygen storage capacity for development of desired electrochemical devices [2, 3]. Its catalytic property can be attributed to its good oxygen storage capacity and unique redox properties, which can be affected by diverse structural factors such as large surface areas, mesoporous structures, lattice defects and synergistic effects [5, 6]. Moreover, some impurities (dopants) within the lattice can also affect the crystallographic structure or oxygen storage capacity, which promote the catalytic properties of CeO2 nanomaterials [2, 5, 6]. It is well known that the catalytic properties significantly improve after substitution of transition-metal ions into ceria lattice, because it depends on the type of dopant ion, dopant concentration, oxygen vacancy concentration and defect association enthalpy [2]. So that, these dopant ions greatly enhanced the number of oxygen vacancies owing to their charge compensation within lattice [2, 6, 7, 8]. These free oxygen vacancies within lattice were responsible to amplification catalytic properties of the nanomaterials [2, 7].
In recent scenario, the methods to introduce new magnetic materials into ceria lattice enhanced the magnetic, optical, electronic, photophysical or photochemical properties of CeO2 nanocrystals [9, 10, 11]. Efforts have recently been made to tailor the catalytic properties of CeO2 by the addition of transition-metal ions to enhance thermal, optical, magnetic, electrical and surface properties, and these novel materials have been exploited for applications toward catalytic and electrochemical biosensors [3, 4, 6, 12, 13, 14]. Tan et al. [15] prepared monodispersed Ni-doped CeO2 nanoparticles to promote catalytic properties of Pt/C. In another report, NiO-doped CeO2 nanorods greatly enhanced the NH3-selective catalytic reduction of nitric oxide as compared to pure CeO2 nanorods or NiO nanoparticles [16]. Yen et al. [11] reported enhanced performance for preferential oxidation of CO at low temperature based on mesostructured Cu-doped ceria catalyst. Zhang group synthesized 3D-ordered macroporous Ce0.75Zr0.2M0.05O2-δ (M = Fe, Cu, Mn, Co) through a colloidal crystal template strategy for a comparative study on the selective catalytic reduction of NO with NH3[14]. Some other groups have synthesized different transition-metal ion-doped macroporous CeO2 and investigated their catalytic activity for CO oxidation [9]. In this case, the interaction at the interface between the CeO2 and the added metal or metal oxides may promote this behavior and consequently the catalytic activity for CO oxidation, perhaps via creation of active sites at oxide-metal boundary. This is conventionally described as strong metal-substrate interaction [9, 14]. Currently, a significant interest has been exhibited in achieving magnetic functionality in CeO2 nanoparticles [17, 18]. Transition-metal-doped CeO2 has been investigated as a promising dilute magnetic semiconductor for implementing spintronic device concepts, and progress has been achieved in the fabrication of spintronic devices [9, 14]. So far, for the Mn-doped CeO2nanocomposite, there have been few reports focused on its effective reaction characteristics [9, 14, 17, 18]. Therefore, further study on the redox properties of the Mn-doped CeO2 nanoparticles is necessary for academic and practical interests.
Herein, we report the synthesis of Mn-doped CeO2 nanoparticles and their physiochemical properties at room temperature. For semiconductor metal oxides, doping was a powerful tool to tailor the structural, optical, magnetic, electrical and redox properties, facilitating the construction of many electronic and optoelectronic devices. These physiochemical properties of semiconductor metal oxides depend on the amount and nature of oxygen vacancies that were generated during its synthesized. So that oxygen vacancies are normally controlled by doping concentrations added within the CeO2 lattice. Therefore, it was very important to understand the effects of these dopant concentrations on structure and nonlinear properties of this type CeO2nanoparticles. In the present work, we systematically investigated the structure, thermal, optical and redox (temperature-programmed reduction) properties of Mn-doped CeO2 nanoparticles in order to understand the effect of Mn-doping concentration on physiochemical properties, which are responsible to enhanced the catalytic properties of the materials. The nanoparticles of Mn-doped CeO2 prepared using polyol-assisted co-precipitation method were characterized using X-ray diffraction (XRD), field-emission transmission electron microscopy (FE-TEM), energy-dispersive X-ray analysis (EDX), thermogravimetric analysis, Fourier transform infrared (FTIR), UV-Vis absorption spectra and redox behavior based on hydrogen consumption through temperature-programmed reduction technique.
2 Experimental
2.1 Materials and Methods
Cerium nitrate (99.99%, BDH Chemicals Ltd, England), manganese nitrate (E-Merck, Germany) ethylene glycol, ethanol and ammonia were used as starting materials without any further purification. Nanopure water was used for preparation of solutions. The ultrapure deionized water was prepared using a Milli-Q system (Millipore, Bedford, MA, USA). All other chemicals used were of reagent grade.
2.2 Preparation of Mn Ion-Doped Cerium Oxide Nanoparticles
In typical reaction, 0.02 mol/L, Ce(NO3)3· 6H2O (different percentages, mol%) was dissolved in 50 mol/L ethylene glycol and heated on hot plate up to 80 ° C. Separately 0.02 mol/L manganese nitrate (different percentages for doping, mol%) dissolved in ethylene glycol was added dropwise in the forgoing reaction, and whole solution was kept under magnetic stirring on hot plate at 80 ° C to obtain homogenously mixture. Later this homogenously mixed solution was transferred in 250-mL flask fitted with reflux condenser and hydrolyzed for 24 h. A required amount of ammonia was added to hydrolyzed solution, and the precipitate was obtained. The obtained gray colored precipitate was centrifuged and washed several times with distilled water to remove excess amount of ammonium and nitrate ions and dried the obtained product at 100 ° C. As-prepared samples were annealed at 400 ° C in air for 2 h. We examined systematic changes in the color of the cerium hydroxide precipitate. The color of the prepared cerium hydroxide precipitate was changed gradually from gray to yellow after being exposed to air, maybe due to the oxidation of peroxide Ce(OH)3OOH to Ce(OH)4 by oxygen. This procedure was repeated for synthesis and purification of different Mn-doped CeO2 concentrations.
2.3 Characterization
The crystallinity of the powder samples was examined by XRD at room temperature with the use of Rigaku-Dmax 2500 diffractometer equipped with CuK α (λ = 0.154056 nm) radiations as X-ray source. Thermogravimetric analysis (TGA) was performed with TGA/DTA, Mettler Toledo AG, Analytical CH-8603, Schwerzenbach, Switzerland. The size and morphology of the samples were inspected using a field-emission transmission electron microscope (FE-TEM) equipped with the EDX (FE-TEM, JEM-2100F, JEOL, Japan) operating at an accelerating voltage of 200 kV. EDX analysis was used to confirm the presence of the elements. The samples for TEM were prepared by depositing a drop of a colloidal ethanol solution of the powder sample onto a carbon-coated copper grid. The FTIR spectra were recorded on a PerkinElmer 580B IR spectrometer using KBr pellet technique in the range 4000-400 cm-1. The UV-Vis absorption spectra were measured in the PerkinElmer Lambda-40 spectrophotometer in the range 200-600 nm, with the sample contained in 1-cm3 stoppered quartz cell of 1 cm path length. All measurements were taken at room temperature. Temperature-programmed reduction (TPR) profiles were obtained using the Micromeritics Autochem model 2910 instrument. The samples were pretreated with high-purity (99.98%) argon (20 mL/min) at 500 ° C for 1 h. After cooling to ambient temperature, the argon atmosphere was replaced by a 5% H2 in argon mixture, and the catalyst was heated to 500 ° C at a rate of 5 K/min. The flow rate of the H2-Ar mixture used for this purpose was 40 mL/min. The water produced during the reduction step was condensed and collected in a cold trap immersed in the slurry of an isopropanol-liquid nitrogen mixture.
3 Results and Discussion
3.1 Crystallographic and Morphological Structure
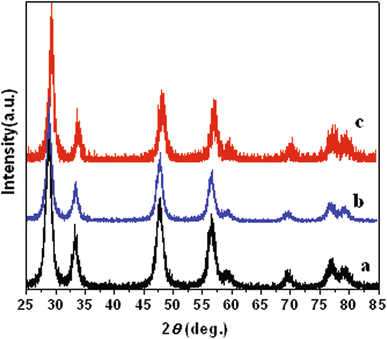
The typical XRD patterns of the prepared CeO2 nanoparticles with doped different concentrations of manganese are shown in Fig. 1. The patterns contain all characteristic peaks correspond to (111), (200), (220), (311) and (222) planes, which can be indexed to be a pure cubic fluorite structure of CeO2 (space group: Fm3m) as identified using standard data JCPDS 78-0694 [2, 4, 5]. The diffraction peaks of Mn species are absent in the XRD observation, which may be related to the small amount of addition and their homogeneously dispersion on the catalyst surface. It indicates all samples and formation of homogeneous Ce-M-O solid solutions. However, it is worth noticing that the characteristic diffraction peaks of Ce-Mn oxide solid solution become weaker and broader after in situ doping, indicating decreased crystal size and crystallinity degree. The lattice parameters of the obtained products are also calculated using the XRD patterns to be 5.3700, 5.3884 and 5.3938 nm, respectively, which are slightly lower than their bulk counterpart (5.411 nm) [9, 14]. The peaks broadening and 2θ shifts observed for nanometer-sized CeO2particles result from size-induced lattice relaxation effects and an increase in the lattice parameter. The results of lattice parameters suggest that by the addition of Mn ion in CeO2 crystal, the lattice parameter increased, because Mn4+ (0.056 nm) has a smaller ion radius than Ce4+ (0.097 nm). The introduced additional lattice perturbation and structural stress cause extrinsic defects both near the grain boundaries and on the plane surface [19]. The grain size calculated by the Debye-Scherrer equation with the most prominent peak (111) is 9.8, 9.3 and 8.9 nm for 2, 4 and 7 mol% doping concentrations of Mn in CeO2nanoparticle, respectively. The decrease in the grain size is caused by relaxation of strain induced by substitution of Ce4+ ions of radius 0.097 nm by Mn4+ ions of smaller radius 0.056 nm. But the reduction of Ce4+ to Ce3+ facilitated substitution free of strain as ionic radius of Ce3+ is 0.1143 nm. The reduction results in release of O2- vacancies and formation of Ce3+ vacancy associates that have resulted in the intermediate decrease in the particle size. Furthermore, the result suggests the doping of Mn can efficiently inhibit growth of the cubic phase, which agrees well with the previous reports [20, 21]. As the decrease in the grain size is conductive to the contact between catalysts and reactant gas flow [22], Mn dopant should have promotion effect on catalytic performance.
Fig. 1 X-ray diffraction patterns of a CeO2:Mn2%, b CeO2:Mn4%, c CeO2:Mn7% nanoparticles
We also find that the diffraction peaks of Mn-doped CeO2 slightly shift to larger Bragg angles, indicating that a part of manganese species might have entered into lattice [23, 24]. One possible explanation might be that incorporation of Mn into the lattice sites of CeO2 or that there is too small an amount of compound to be detected by XRD [25] and the structure of the as-generated Mn-doped ceria remains the same upon doping. This behavior indicates that Mn ions are inserted into the CeO2 lattice to form the solid solution. In addition, the XRD results reveal that Mn ion effectively doped into the CeO2-Mn, which could contribute to strong interaction between the dopants and Ce-Mn-O solid solution [26]. Moreover, the ionic radius of Mn4+(0.056 nm) and Mn3+ (0.062 nm) is smaller than that of Ce4+ (0.097 nm) [27], and this is another important factor, which is responsible for shifting of reflection peaks.
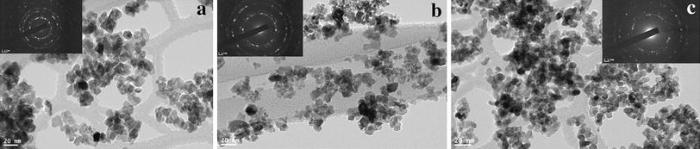
High-resolution transmission electron microscopy (HE-TEM) is used to get information about the shape, the size and presence of any secondary phase in Mn-doped CeO2 nanoparticles. The size and the morphology of prepared Mn-doped CeO2 nanoparticles are analyzed by the TEM as shown in Fig. 2, which are typical images of the as-prepared powder. The morphology of the as-precipitated material shows the presence of well-crystallized nanoparticles with spherical morphologies and the sizes ranging from 10 to 18 nm, which is in good agreement with that obtained from XRD data. The morphologies of all three Mn-doped CeO2nanoparticles do not change much after increase doping concentration of manganese. However, their agglomeration and size distribution become higher due to the decrease in the particle size. The particle size distribution, measured directly from TEM images, is very narrow as shown in Fig. 2. This consistency suggests that these individual particles obtained are nanocrystallites.
Fig. 2 TEM images of a CeO2:Mn2%, b CeO2:Mn4%, c CeO2:Mn7% nanoparticles
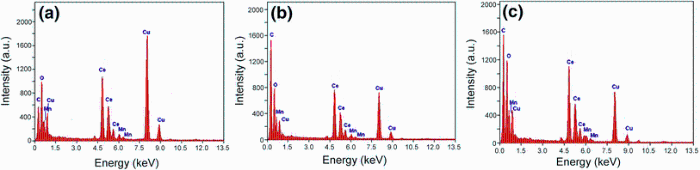
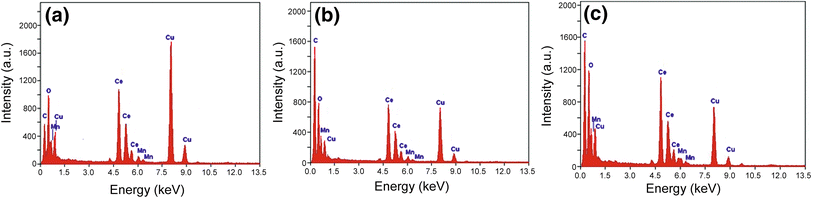
Furthermore, in order to see the impurity phase, nanocrystallinity and crystallography of the prepared doped samples, we performed selected area electron diffraction analysis (SAED) and HR-TEM measurements. It can be observed that most of them exhibit lattice fringes of distances about 0.3 nm that well correspond to the (111) lattice plane of a fluorite-like cubic structure. Corresponding SAED patterns, shown in the insets of Fig. 2, exhibit four broad rings with d-spacings about 0.31, 0.27 and 0.22 nm, which could be attributed to (111), (200), (220) and (311) reflections of the fluorite cubic CeO2 structure, respectively. Moreover, FE-TEM measurements are also taken at different parts of the sample to investigate the presence of any secondary phase related to Mn oxide in Mn-doped CeO2 nanoparticles. A careful analysis of the inter-planer distance calculated from FE-TEM image (see insets in Fig. 2a-c) is found to decreases with Mn doping and indicates the planes of cubic CeO2. FE-TEM image taken on the samples with different Mn concentrations also indicate that individual nanoparticle is a single crystal. The broadening of the diffraction rings suggests that the particles are small and/or are of low crystallinity. In addition, it indicated that the particles are crystallized and diffraction rings match the XRD peaks very well. FE-TEM image results suggest that the Mn-doped CeO2nanoparticles are highly porous in nature, which is suitable for catalytic application. Figure 3 shows the EDX of the synthesized samples from which it is seen that their chemical composition correlates well to that of the Ce, Mn and O. C and Cu signals are from Cu grid (substrate) on which the sample is deposited.
Fig. 3 EDX of a CeO2:Mn2%, b CeO2:Mn4%, c CeO2:Mn7% nanoparticles
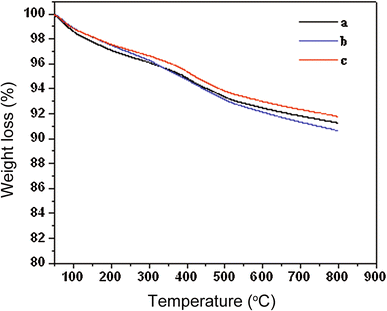
3.2 Thermogravimetric Analysis
Figure 4 illustrates the results of the thermogravimetric analysis of the Mn-doped CeO2 nanoparticles. The three curves reveal remarkable thermal stability and similar decomposition pattern, which further confirmed (XRD analysis) the purity of the materials. All thermograms are similar in shape, and first thermal degradation of the materials occurs between 100 and 355 ° C. The initial mass loss at lower temperatures is mainly due to the removal of crystalline water (water and carbon dioxide), which is adsorbed at different forms. A sluggish weight loss is observed in all thermograms between 355 and 800 ° C, and almost no weight loss could be observed at above 800 ° C, its possibility due to removal of surface capping oxygen and bulk oxygen species, suggesting the formation of crystalline CeO2 as a decomposed product. This is confirmed by the XRD and FTIR spectroscopy results as shown in Figs. 1 and 5, respectively.
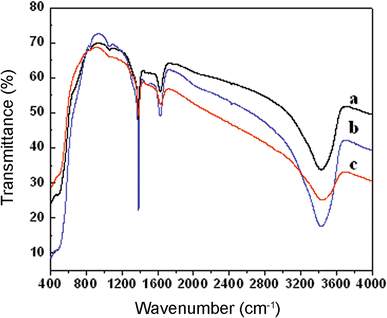
Fig. 5 FTIR spectra of a CeO2:Mn2%, b CeO2:Mn4%, c CeO2:Mn7% nanoparticles
3.3 Optical Properties
FTIR spectra were recorded to examine the role of the reactants and the phase purity of the prepared Mn-doped CeO2 nanoparticles as shown in Fig. 5, which shows a group of strong intense bands at 3440, 1635 cm-1 and below 700 cm-1. In light of the proposed assignments of such peaks in other similar systems [28, 29], the observed bands can be assigned as follows: the intense band at 3426 and 1625 cm-1corresponds to ν (O-H) mode of (H-bonded) water molecules, and δ (OH), respectively. Residual water and hydroxyl groups are usually detected in the as-prepared CeO2 samples regardless of synthesis method used [28, 29]. Additional band is in between 1400 and 1300 most probably associated with the presence of residual organic or the formation of “ carbonate-like” species on the CeO2 surface [28]. The low intensity associated with these groups of the peaks is indication of low content of organic material in ceria prepared under polyol-assisted co-precipitation conditions. The FTIR spectra of the as-prepared ceria also exhibit strong broad band below 700 cm-1, which is due to the envelope of phonon band of metal oxide (Ce-O-Mn) network [28, 29]. The absence of other functional groups such as C-H, C=C, those represents reactants confirms the phase purity of prepared nanoparticles.
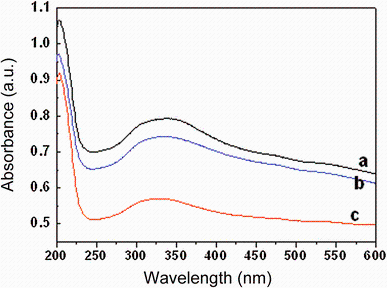
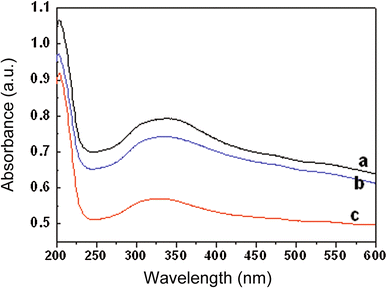
The effect of Mn substitution on cubic fluorite structure of CeO2 lattice is further confirmed using UV-visible optical spectroscopy measured in the range 200-600 nm. Figure 6 shows the room-temperature optical absorption spectra of undoped and Mn-doped CeO2 nanoparticles. The spectra distinctly exhibited a strong absorption band at the UV region due to charge-transfer transitions from O2p to Ce4f and block damage by UV radiation [30]. However, no absorption is detected above 500 nm in wavelength. The absorption band edge of undoped CeO2 is observed at 351 nm, and it gets shifted toward lower wavelength (blue shift) region for 2, 4 and 7 mol% Mn-doped CeO2 samples. The observed blue shift in absorption band edge with Mn doping in CeO2 may be due to d-f exchange interactions between band electrons and localized d-electrons of the Mn3+ ions. Such a blue shift in band edge with increasing Mn dopant is a clear indication of the incorporation of Mn ions into the Ce site of the CeO2 matrix [30, 31, 32, 33, 34, 35]. It may be noted that the band gap of pure MnO2 is in the range of 2.0-3.5 eV. So the doping is not tuning of the band gap in the direction of MnO2 at lower doping amount. Perhaps, it is not surprising that the band gap upon doping is a consequence of interaction between Mn and CeO2 states. This band gap reduction at lower percentage of Mn could be attributed to introduction of Mn states, which lowers the valance band states. Instead, at higher % of Mn substitution there is increased MnO2 sub-lattice like phase, which may not adhered to CeO2 lattice; therefore, MnO2 sub-lattice is dominating for the higher band gap occurrence. Otherwise, the quantum confinement effect directly shows the variation of band gap with crystallite size.
Fig. 6 UV-Vis absorption spectra of a CeO2:Mn2%, b CeO2:Mn4% and c CeO2:Mn7% nanoparticles
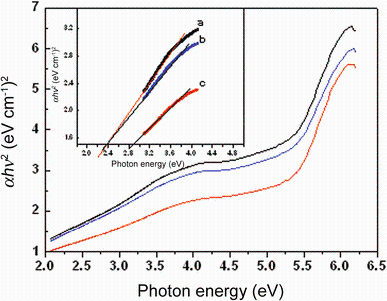
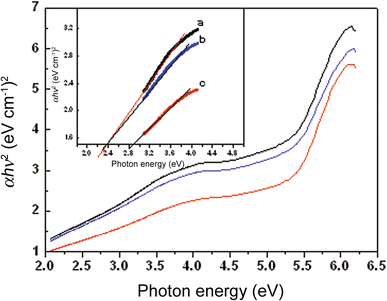
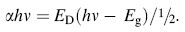
Optical absorption spectra were employed to reveal the correlation between the band gap energies and the grain sizes for prepared Mn-doped ceria nanocrystals (Fig. 6). According to the absorption spectral data, the relation between the absorption coefficient (α ) and incident photon energy (hν ) can be estimated by fitting absorption data to direct transition equation by extrapolating the linear portions of curves to absorption equal to zero (Fig. 7)
Fig. 7 Plot of (α hν )2 versus photon energy (hν ) of a CeO2:Mn2%, b CeO2:Mn4%, c CeO2:Mn7% nanoparticles
The plots of (α hν ) versus photon energy of various Mn concentrations doped CeO2 nanoparticles are shown in Fig. 7, where α is the absorption coefficient, hν is photon energy, Eg is the direct band gap, and ED is a constant. A quantitative evaluation of the band gap energy (Eg) can be performed by plotting (α hν )½ versushν and extrapolated from linear part of the curve as shown in Fig. 6. The intercept of tangent to the plot will give a good approximation of the direct band gap energies of samples. The band gap energies estimated from the intercept of tangents to the plots are 2.36, 2.37 and 2.88 eV for 2, 4 and 7 mol% Mn ion doping, respectively. The lower band gap energy of Mn-doped CeO2 (2.36-2.88 eV) observed compared with that of pure CeO2 (3.13 eV) is due to doping, as evidenced by their absorbance in the UV region. These values also basically agree with those for CeO2 nanoparticles synthesized by the micromulsion method (2.87 eV for 2.6 nm and 2.73 eV for 4.1 nm) [35]. Yin et al. [36] have reported direct band gap values ranging from 3.03 to 3.68 eV for CeO2 nanoparticles synthesized using sonochemical synthesis [31]. Ho et al. [34] have reported direct band gap values ranging from 3.36 to 3.62 eV for mesoporous CeO2 nanostructures prepared using polyol method. Most recently, Chen and Chang [37] have reported direct band gap values ranging from 3.56 to 3.71 eV for CeO2 nanoparticles prepared using a precipitation method. We believe that this is due to the quantum confinement effect, which follows the effective mass approximation approach using a simple particle in a box model [31, 32, 33, 34, 35, 36, 37, 38].
In addition, we compare our results with the band gaps obtained by other authors using various doping metal ions into ceria lattice. Wang et al. [31, 39] have reported the optical band gap values ranging from 2.91 eV for CeO2 nanosheets, 2.50 eV for Eu3+-doped CeO2 nanosheets, and 2.38 eV for Eu3+-doped CeO2 nanobelts, respectively. Yue and Zhang [40] have reported that doping CeO2 with Mn ions could reduce the band gap of CeO2 more effectively than do other transition-metal dopants. Saranya et al. [32] have reported the band gap energy for Co-doped CeO2 ranging from 3.13, 3.07 and 2.84 eV. This phenomenon is similar to that of the Ni-doped CeO2 reported by Thurber et al. [41]. They found that the band gap changed from 3.80 to 3.23 eV when the CeO2 was doped with 4% Ni. Thurber et al. [41] attributed this change to the extensive structural changes caused by the incorporation of interstitial Ni. Doping with Mn ions creates oxygen vacancies and favors the formation of Ce3+ from Ce4+. This increases the amount of Ce3+ states, resulting in the formation of localized energy states that are closer to the conduction band and thereby decreasing the band gap [42, 43]. In addition, the band gap energy increases along with increasing Mn contents into CeO2 lattice with decreasing the crystallite size by either lowering the reaction temperature or increasing the oxygen content. The blue-shifting phenomenon in the UV absorption spectra of CeO2 nanocrystals has attracted the interest of many researchers in recent years. Generally, the absorption of ceria in the UV region originates from the charge-transfer transition between the O2p and Ce4f states in O2- and Ce4+. This absorption is much stronger than the 4f1-5d1 transition from the Ce3+ species in the mixed valence ceria system [44]. It is theoretically deduced that the value of blue shifting resulting from the reduction of the particle size is inversely proportional to the square of the size due to quantum confinement effect. Tsunekawa et al. stated that the blue shifts could also be explained by the change in the electronic band structure [45]. On the other hand, the ionic radius (0.054 nm) of Mn4+ is smaller than that of Ce3+ (0.114 nm), and the Mn4+ cation could occupy the Ce3+ sites without creating additional charge defects, which may introduce structural disorder, especially in the position of oxygen. The overlap of the conduction band due to Ce(f) of Ce oxide and the Mn d orbit may be essential to decrease the energy gap between Ce(f) and O(p) orbitals of Ce oxide and to enable the visible light to be adsorbed. In the present case, smaller grain size of doped ceria nanocrystals, higher degree of agglomeration and more hydroxyl groups adsorbed onto surfaces of the nanocrystals are verified by the former combined results of TEM, FTIR and TG-DTA analysis.
3.4 Redox Properties
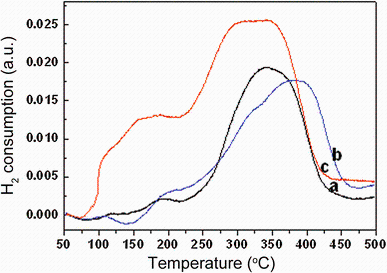
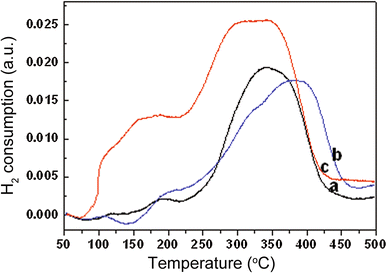
The H2-TPR analysis is conducted to evaluate the influence of the in situ doping on redox property of Mn-doped CeO2 nanoparticles within the range 50-500 ° C (Fig. 8). The effect of Mn addition is studied as well for three Mn-doping compositions. The profiles depicted in Fig. 8 demonstrate the higher reducibility of the Mn-containing samples in terms of lower temperature reduction and H2 consumption. The CeO2 shows two typical characteristic reduction peaks; the low-temperature peak is assigned to the easily reducible surface capping oxygen (~120 ° C), whereas the high-temperature peak is due to removal of bulk oxygen (~402 ° C data not shown in Fig. 8). The incorporation of Mn into the CeO2 lattice strongly modified the reduction behavior of CeO2 by shifting surface and bulk reduction to lower temperatures. As seen in Fig. 8a, three reduction peaks are observed at 115, 186 and 344 ° C. The high-intensity reduction peak observed at 344 ° C and a lower-intensity peaks at 115, 186 ° C, indicating the existence of at least two manganese species. The peak at around 115 ° C can be attributed to the replacement of Ce4+ by Mn2+ into the lattice of CeO2. Due to this charge imbalance, lattice distortion would occur that leads to the formation of Mn-O-Ce solid solution [32]. As a result, reactive oxygen species are generated that may be reduced easily at low temperatures. The second reduction peak at 186 ° C can be attributed to the reduction of strongly interactive MnO2 species with CeO2 supports, whereas the third reduction peak at 344 ° C may be assigned to the high-temperature reduction peak due to bulk MnO2. In spite of a low doping concentration, the doped products present remarkably increased activity in oxidization reaction. It can be concluded that the incorporation of Mn into the CeO2 fluorite lattice creates additional lattice perturbation and structural stress and induces extrinsic defects, thus improving the O2- mobility; such mobility would elevate the catalytic property. Other evidence validates the higher reactivity of doped CeO2 as well.
Fig. 8 Temperature-programmed reduction spectra of a CeO2:Mn2%, b CeO2:Mn4%, c CeO2:Mn7% nanoparticles
In the case of Mn0.04Ce0.96O2 sample (Fig. 8b), the reduction peaks are at 108, ~ 200 and 381 ° C, while in the Mn0.07Ce0.93O2 sample (Fig. 8c), the reduction peaks shift to the lower temperature. The former shows reduction temperature at 200 and 381 ° C and the latter at 156 and 321 ° C. It is obvious that the Mn0.07Ce0.93O2 nanoparticles show high redox properties at the lowest temperature among Mn-doped CeO2 nanoparticles with various manganese contents. As we know, ceria can uptake and release oxygen via the transformation between Ce3+ and Ce4+. When doping Mn elements, as we discussed above, the Ce1-xMn x O2 solid solution might form partially. So the Mn-doped CeO2 nanoparticles can easily uptake and release oxygen via the transition of Mn2+/Mn4+ and Ce3+/Ce4+, and at the meantime the surface oxygen can participate in the CO oxidation. Furthermore, as observed in Fig. 8c the bulk reduction temperature was much lowered compared to that of pure CeO2. One possible reason for this behavior is the enhancement of oxygen vacancies (as evidenced lattice distortion in XRD results), which increases the oxygen mobility in the lattice. It is known that Mn addition induces ordered arrangements of vacancies, thereby creating a pathway for oxygen diffusion [44, 46]. This would promote the oxygen ion diffusion from the bulk to the surface, enabling the bulk reduction at low temperatures. The oxygen storage/release property of ceria is the most important factor which contributes to the catalytic activity of ceria in oxidation reactions. The oxygen storage capacity of CeO2 relies on transport properties like oxygen diffusion at the surface and/or in the bulk of oxides, which will help in understanding of CO oxidation activity of CeO2 [44, 46]. Oxygen diffusion is mainly determined by the presence, concentration, and mobility of lattice defects (such as oxygen vacancies). The incorporation of Mn into the CeO2 lattice increased the bulk reduction, and the oxygen atoms bonded to both Ce and Mn (reducible elements) can contribute to the oxygen storage capacity [32]. Moreover, due to possible valence change of both ions from 3+ to 4+ or from 2+ to 3+ and 4+, the up-down swings of oxygen defects accompanied with valence change are achieved. Thus, it will have a high diffusivity of oxygen and ability to store more oxygen as well. Hence, high oxygen storage capacity of CeO2-Mn is due to simultaneous presence of mobile oxygen vacancies and corresponding Ce3+/4+/Mn2+/3+/4+ redox couples. Consequently, the Mn0.07Ce0.93O2 sample may exhibit an excellent catalytic performance at lowest temperature as a result of highest redox properties, which is also supported by the reports [17, 18].
4 Conclusions
Nanostructured CeO2 samples doped with different concentrations of Mn were successfully synthesized by using polyol-assisted co-precipitation method from cerium and manganese nitrates as precursors. This work focuses on understanding of the effects of the Mn addition in Mn-doped CeO2 nanoparticles. The XRD results confirmed the formation of thermally stable CeO2:Mn oxide solid solutions with a cubic phase of fluorite structure. The parameter of the unit cell, obtained by Rietveld refinement, presented a small variation between 5.3700, 5.3884 and 5.3938 nm. The amplification in density of cell with an increase in doping of Mn ions was also observed. Owing to defects and impurities, absorption spectra of CeO2 show that the peak shifts from ultraviolet region to visible light region after being doped with Mn ions. Defects in CeO2 lattice and an absorption band were verified by the electronic transference created by Mn3+ ions. By UV-Vis spectroscopy, we also established the values for band gap of each material, and we observed a small enhancement of band gap with increasing doping. The following functions were identified for Mn species in this material: (1) the increase in Mn content decreases the grain size; (2) the increase in Mn contents increases the lattice constant; (3) as a temperature reduction promoter, the increase in the proportion of Mn reduces the reduction temperature; and (4) as a promoter, the redox property enhance is likely by enhancing the electronic transport. Experiments on temperature-programmed reduction showed that 7 mol% Mn-doped CeO2 had higher catalytic capability compared with that of the pure CeO2 or 2 and 4 mol% Mn ion-doping catalyst. The enhancement in redox efficiency of CeO2 nanoparticles upon Mn doping may be due to the increase in charge transport rate. This indicates that 7 mol% Mn-doped CeO2 nanoparticle is a promising material and may potentially be used for electrochemical biosensors or catalytic devices.
Acknowledgments
The authors extend their sincere appreciations to the Deanship of Scientific Research at King Saud University for its funding this Prolific Research Group (PRG-1436-26).
The authors have declared that no competing interests exist.
J. Wang, D. N. Tafen, J. P. Lewis, Z. Hong, A. Manivannan, M. Zhi, M. Li, N. Wu, J. Am. Chem. Soc. 131, 12290(2009)[Cite with in:1]
[2]
C. L. Robert, J. W. Long, K. A. Pettigrew, R. M. Stroud, D. R. Rolison, Adv. Mater. 19, 1734(2007)[Cite with in:9]
[3]
A. A. Ansari, P. R. Solanki, B. D. Malhotra, Appl. Phys. Lett. 93, 263901(2008)[Cite with in:4]
[4]
A. A. Ansari, P. R. Solanki, B. D. Malhotra, J. Biotechnol. 142, 179(2009)[Cite with in:3]
[5]
S. Patil, S. Seal, Y. Guo, A. Schulte, J. Norwood, Appl. Phys. Lett. 88, 243110(2006)[Cite with in:3]
[6]
A. A. Ansari, G. Sumana, M. K. Pand ey, B. D. Malhotra, J. Mater. Res. 24, 1667(2009)[Cite with in:4]
[7]
S. Banerjee, P. S. Devi, D. Topwal, S. Mand al, K. Menon, Adv. Funct. Mater. 17, 2847(2007)[Cite with in:2]
[8]
T. Y. Yu, J. Zeng, B. Lim, Y. N. Xia, Adv. Mater. 22, 5188(2010)[Cite with in:1]
[9]
J. C. Zhang, J. X. Guo, W. Liu, S. P. Wang, A. R. Xie, X. F. Liu, J. Wang, Y. Z. Yang, Eur. J. Inorg. Chem. 6, 969(2015)[Cite with in:6]
[10]
S. Mahammadunnisa, P. M. K. Reddy, N. Lingaiah, C. Subrahmanyam, Catal. Sci. Technol. 3, 730(2013)[Cite with in:1]
[11]
H. Yen, Y. Seo, S. Kaliaguine, F. Kleitz, Angew. Chem. Int. Ed. 51, 12032(2012)[Cite with in:2]
[12]
L. Liao, H. X. Mai, Q. Yuan, H. B. Lu, J. C. Li, C. Liu, C. H. Yan, Z. X. Shen, T. Yu, J. Phys. Chem. C112, 9061 (2008)[Cite with in:1]
[13]
A. A. Ansari, G. Sumana, R. Khan, B. D. Malhotra, J. Nanosci. Nanotechnol. 9, 4679(2009)[Cite with in:1]
[14]
S. X. Cai, D. S. Zhang, L. Zhang, L. Huang, H. R. Li, R. H. Gao, L. Y. Shi, J. P. Zhang, Catal. Sci. Technol. 4, 93(2014)[Cite with in:6]
[15]
Q. Tan, C. Y. Du, Y. R. Sun, L. Du, G. P. Yin, Y. Z. Gao, J. Power Sources263, 310 (2014)[Cite with in:1]
[16]
P. Maitarad, J. Han, D. Zhang, L. Shi, S. Namuangruk, T. Rungrotmongkol, J. Phys. Chem. C118, 9612 (2014)[Cite with in:1]
[17]
C. H. Xia, C. G. Hu, P. Chen, B. Y. Wan, X. S. He, Y. S. Tian, Mater. Res. Bull. 45, 794(2010)[Cite with in:3]
[18]
S. Kumar, F. Ahmed, M. S. Anwar, H. K. Choi, H. Chung, B. H. Koo, Mater. Res. Bull. 47, 2980(2012)[Cite with in:3]
[19]
A. V. Thorat, T. Ghoshal, J. Holmes, P. M. G. Nambis-san, M. A. Morris, Nanoscale6, 608 (2014)[Cite with in:1]
[20]
K. Z. Li, H. Wang, Y. G. Wei, D. X. Yan, Appl. Catal. B97, 361 (2010)[Cite with in:1]
[21]
Y. L. Wang, C. Z. Ge, L. Zhan, C. Li, W. M. Qiao, L. C. Ling, Ind. Eng. Chem. Res. 51, 11667(2012)[Cite with in:1]
[22]
X. J. Yao, C. J. Tang, Z. Y. Ji, Y. Dai, Y. Cao, F. Gao, L. Dong, Y. Chen, Catal. Sci. Technol. 3, 688(2013)[Cite with in:1]
[23]
M. Machida, M. Uto, D. Kurogi, T. Kijima, Chem. Mater. 12, 3158(2000)[Cite with in:1]
[24]
H. F. Li, G. Z. Lu, Y. Q. Wang, Y. Guo, Y. L. Guo, Catal. Commun. 11, 946(2010)[Cite with in:1]
[25]
B. Choudhury, A. Choudhury, Curr. Appl. Phys. 13, 217(2013)[Cite with in:1]
[26]
L. W. Jia, M. Q. Shen, J. J. Hao, T. Rao, J. Wang, J. Alloys Compd. 454, 321(2008)[Cite with in:1]
[27]
X. D. Wu, L. Qing, W. Duan, F. Jun, R. Rui, Catal. Today126, 430 (2007)[Cite with in:1]
[28]
A. A. Ansari, J. Semicond. 31, 053001(2010)[Cite with in:4]
[29]
A. A. Ansari, A. Kaushik, P. R. Solanki, B. D. Malhotra, Electrochem. Commun. 10, 1246(2008)[Cite with in:3]
[30]
A. A. Ansari, S. P. Singh, B. D. Malhotra, J. Alloys Compd. 509, 262(2011)[Cite with in:2]
[31]
Z. L. Wang, Z. W. Quan, J. Lin, Inorg. Chem. 46, 5237(2007)[Cite with in:4]
[32]
J. Saranya, K. S. Ranjith, P. Saravanan, D. Mangalaraj, R. T. R. Kumar, Mater. Sci. Semicond. Process. 26, 218(2014)[Cite with in:5]
[33]
H. Gu, M. D. Soucek, Chem. Mater. 19, 1103(2007)[Cite with in:2]
[34]
C. Ho, J. C. Yu, T. Kwong, A. C. Mak, S. Lai, Chem. Mater. 17, 4514(2005)[Cite with in:3]
[35]
T. Masui, K. Fujiwara, K. Machida, G. Adachi, Chem. Mater. 9, 2197 (1997)[Cite with in:3]
[36]
L. Yin, Y. Wang, G. Pang, Y. Koltypin, A. Gedanken, J. Colliod Interface Sci. 246, 78(2002)[Cite with in:2]
[37]
H. I. Chen, H. Y. Chang, Ceram. Int. 31, 795(2005)[Cite with in:2]
[38]
D. E. Zhang, X. J. Zhang, X. M. Ni, J. M. Song, H. G. Zheng, Chem. Phys. Chem. 7, 2468(2006)[Cite with in:1]
[39]
Z. L. Wang, G. R. Li, Y. N. Ou, Z. P. Feng, D. L. Qu, Y. X. Tong, J. Phys. Chem. C115, 351 (2011)[Cite with in:1]
[40]
L. Yue, X. M. Zhang, J. Alloys Compd. 475, 702(2009)[Cite with in:1]
[41]
A. Thurber, K. M. Reddy, V. Shutthanand an, Phys. Rev. B76, 165206 (2007)[Cite with in:2]
[42]
W. F. Chen, F. S. Li, J. Y. Yu, Mater. Lett. 60, 57(2006)[Cite with in:1]
[43]
P. Patsalas, S. Logothetidis, L. Sygelloou, S. Kennou, Phys. Rev. B Cond. Matter Mater. Phys. 68, 03510(2003)[Cite with in:1]
[44]
P. Dutta, S. Pal, M. S. Seehra, Y. Shi, E. M. Eyring, R. D. Ernst, Chem. Mater. 18, 5144(2006)[Cite with in:3]
[45]
S. Tsunekawa, J. T. Wang, Y. Kawazoe, A. Kasuya, J. Appl. Phys. 94, 3654(2003)[Cite with in:1]
[46]
S. Deshpand e, S. Patil, S. V. N. T. Kuchibhatla, S. Seal, Appl. Phys. Lett. 87, 133113(2005)[Cite with in:2]
1
2009
0.0
0.0
... 1 IntroductionRecently, researches in semiconducting metal oxide nanoparticles are attracted considerable interest owing to their wide applications in nanoelectronics, photonics, data storage and sensing [1,2,3,4] ...
9
2007
0.0
0.0
... 1 IntroductionRecently, researches in semiconducting metal oxide nanoparticles are attracted considerable interest owing to their wide applications in nanoelectronics, photonics, data storage and sensing [1,2,3,4] ...
... This gives rise to new possibilities to further modify the systems and to improve them with respect to technological applications [2, 3] ...
... The innovative structures were being exploited for optical, electrical and magnetic applications in electrochemical and spintronics devices [2] ...
... Among the semiconductor metal oxides, cerium oxide (CeO2) has attracted much interest owing to its distinctive properties including high mechanical strength, oxygen ion conductivity, optically active, high isoelectric point (IEP), excellent high adsorption capability and oxygen storage capacity for development of desired electrochemical devices [2, 3] ...
... Moreover, some impurities (dopants) within the lattice can also affect the crystallographic structure or oxygen storage capacity, which promote the catalytic properties of CeO2 nanomaterials [2, 5, 6] ...
... It is well known that the catalytic properties significantly improve after substitution of transition-metal ions into ceria lattice, because it depends on the type of dopant ion, dopant concentration, oxygen vacancy concentration and defect association enthalpy [2] ...
... So that, these dopant ions greatly enhanced the number of oxygen vacancies owing to their charge compensation within lattice [2, 6,7,8] ...
... These free oxygen vacancies within lattice were responsible to amplification catalytic properties of the nanomaterials [2, 7] ...
... The patterns contain all characteristic peaks correspond to (111), (200), (220), (311) and (222) planes, which can be indexed to be a pure cubic fluorite structure of CeO2 (space group: Fm3m) as identified using standard data JCPDS 78-0694 [2, 4, 5] ...
4
2008
0.0
0.0
... 1 IntroductionRecently, researches in semiconducting metal oxide nanoparticles are attracted considerable interest owing to their wide applications in nanoelectronics, photonics, data storage and sensing [1,2,3,4] ...
... This gives rise to new possibilities to further modify the systems and to improve them with respect to technological applications [2, 3] ...
... Among the semiconductor metal oxides, cerium oxide (CeO2) has attracted much interest owing to its distinctive properties including high mechanical strength, oxygen ion conductivity, optically active, high isoelectric point (IEP), excellent high adsorption capability and oxygen storage capacity for development of desired electrochemical devices [2, 3] ...
... Efforts have recently been made to tailor the catalytic properties of CeO2 by the addition of transition-metal ions to enhance thermal, optical, magnetic, electrical and surface properties, and these novel materials have been exploited for applications toward catalytic and electrochemical biosensors [3, 4, 6, 12,13,14] ...
3
2009
0.0
0.0
... 1 IntroductionRecently, researches in semiconducting metal oxide nanoparticles are attracted considerable interest owing to their wide applications in nanoelectronics, photonics, data storage and sensing [1,2,3,4] ...
... Efforts have recently been made to tailor the catalytic properties of CeO2 by the addition of transition-metal ions to enhance thermal, optical, magnetic, electrical and surface properties, and these novel materials have been exploited for applications toward catalytic and electrochemical biosensors [3, 4, 6, 12,13,14] ...
... The patterns contain all characteristic peaks correspond to (111), (200), (220), (311) and (222) planes, which can be indexed to be a pure cubic fluorite structure of CeO2 (space group: Fm3m) as identified using standard data JCPDS 78-0694 [2, 4, 5] ...
3
2006
0.0
0.0
... Its catalytic property can be attributed to its good oxygen storage capacity and unique redox properties, which can be affected by diverse structural factors such as large surface areas, mesoporous structures, lattice defects and synergistic effects [5, 6] ...
... Moreover, some impurities (dopants) within the lattice can also affect the crystallographic structure or oxygen storage capacity, which promote the catalytic properties of CeO2 nanomaterials [2, 5, 6] ...
... The patterns contain all characteristic peaks correspond to (111), (200), (220), (311) and (222) planes, which can be indexed to be a pure cubic fluorite structure of CeO2 (space group: Fm3m) as identified using standard data JCPDS 78-0694 [2, 4, 5] ...
4
2009
0.0
0.0
... Its catalytic property can be attributed to its good oxygen storage capacity and unique redox properties, which can be affected by diverse structural factors such as large surface areas, mesoporous structures, lattice defects and synergistic effects [5, 6] ...
... Moreover, some impurities (dopants) within the lattice can also affect the crystallographic structure or oxygen storage capacity, which promote the catalytic properties of CeO2 nanomaterials [2, 5, 6] ...
... So that, these dopant ions greatly enhanced the number of oxygen vacancies owing to their charge compensation within lattice [2, 6,7,8] ...
... Efforts have recently been made to tailor the catalytic properties of CeO2 by the addition of transition-metal ions to enhance thermal, optical, magnetic, electrical and surface properties, and these novel materials have been exploited for applications toward catalytic and electrochemical biosensors [3, 4, 6, 12,13,14] ...
2
2007
0.0
0.0
... So that, these dopant ions greatly enhanced the number of oxygen vacancies owing to their charge compensation within lattice [2, 6,7,8] ...
... These free oxygen vacancies within lattice were responsible to amplification catalytic properties of the nanomaterials [2, 7] ...
1
2010
0.0
0.0
... So that, these dopant ions greatly enhanced the number of oxygen vacancies owing to their charge compensation within lattice [2, 6,7,8] ...
6
2015
0.0
0.0
... In recent scenario, the methods to introduce new magnetic materials into ceria lattice enhanced the magnetic, optical, electronic, photophysical or photochemical properties of CeO2 nanocrystals [9,10,11] ...
... Some other groups have synthesized different transition-metal ion-doped macroporous CeO2 and investigated their catalytic activity for CO oxidation [9] ...
... This is conventionally described as strong metal-substrate interaction [9, 14] ...
... Transition-metal-doped CeO2 has been investigated as a promising dilute magnetic semiconductor for implementing spintronic device concepts, and progress has been achieved in the fabrication of spintronic devices [9, 14] ...
... So far, for the Mn-doped CeO2nanocomposite, there have been few reports focused on its effective reaction characteristics [9, 14, 17, 18] ...
... 411 nm) [9, 14] ...
1
2013
0.0
0.0
... In recent scenario, the methods to introduce new magnetic materials into ceria lattice enhanced the magnetic, optical, electronic, photophysical or photochemical properties of CeO2 nanocrystals [9,10,11] ...
2
2012
0.0
0.0
... In recent scenario, the methods to introduce new magnetic materials into ceria lattice enhanced the magnetic, optical, electronic, photophysical or photochemical properties of CeO2 nanocrystals [9,10,11] ...
... [11] reported enhanced performance for preferential oxidation of CO at low temperature based on mesostructured Cu-doped ceria catalyst ...
1
2008
0.0
0.0
... Efforts have recently been made to tailor the catalytic properties of CeO2 by the addition of transition-metal ions to enhance thermal, optical, magnetic, electrical and surface properties, and these novel materials have been exploited for applications toward catalytic and electrochemical biosensors [3, 4, 6, 12,13,14] ...
1
2009
0.0
0.0
... Efforts have recently been made to tailor the catalytic properties of CeO2 by the addition of transition-metal ions to enhance thermal, optical, magnetic, electrical and surface properties, and these novel materials have been exploited for applications toward catalytic and electrochemical biosensors [3, 4, 6, 12,13,14] ...
6
2014
0.0
0.0
... Efforts have recently been made to tailor the catalytic properties of CeO2 by the addition of transition-metal ions to enhance thermal, optical, magnetic, electrical and surface properties, and these novel materials have been exploited for applications toward catalytic and electrochemical biosensors [3, 4, 6, 12,13,14] ...
... (M = Fe, Cu, Mn, Co) through a colloidal crystal template strategy for a comparative study on the selective catalytic reduction of NO with NH3[14] ...
... This is conventionally described as strong metal-substrate interaction [9, 14] ...
... Transition-metal-doped CeO2 has been investigated as a promising dilute magnetic semiconductor for implementing spintronic device concepts, and progress has been achieved in the fabrication of spintronic devices [9, 14] ...
... So far, for the Mn-doped CeO2nanocomposite, there have been few reports focused on its effective reaction characteristics [9, 14, 17, 18] ...
... 411 nm) [9, 14] ...
1
2014
0.0
0.0
... [15] prepared monodispersed Ni-doped CeO2 nanoparticles to promote catalytic properties of Pt/C ...
1
2014
0.0
0.0
... In another report, NiO-doped CeO2 nanorods greatly enhanced the NH3-selective catalytic reduction of nitric oxide as compared to pure CeO2 nanorods or NiO nanoparticles [16] ...
3
2010
0.0
0.0
... Currently, a significant interest has been exhibited in achieving magnetic functionality in CeO2 nanoparticles [17, 18] ...
... So far, for the Mn-doped CeO2nanocomposite, there have been few reports focused on its effective reaction characteristics [9, 14, 17, 18] ...
... 93O2 sample may exhibit an excellent catalytic performance at lowest temperature as a result of highest redox properties, which is also supported by the reports [17, 18] ...
3
2012
0.0
0.0
... Currently, a significant interest has been exhibited in achieving magnetic functionality in CeO2 nanoparticles [17, 18] ...
... So far, for the Mn-doped CeO2nanocomposite, there have been few reports focused on its effective reaction characteristics [9, 14, 17, 18] ...
... 93O2 sample may exhibit an excellent catalytic performance at lowest temperature as a result of highest redox properties, which is also supported by the reports [17, 18] ...
1
2014
0.0
0.0
... The introduced additional lattice perturbation and structural stress cause extrinsic defects both near the grain boundaries and on the plane surface [19] ...
1
2010
0.0
0.0
... Furthermore, the result suggests the doping of Mn can efficiently inhibit growth of the cubic phase, which agrees well with the previous reports [20, 21] ...
1
2012
0.0
0.0
... Furthermore, the result suggests the doping of Mn can efficiently inhibit growth of the cubic phase, which agrees well with the previous reports [20, 21] ...
1
2013
0.0
0.0
... As the decrease in the grain size is conductive to the contact between catalysts and reactant gas flow [22], Mn dopant should have promotion effect on catalytic performance ...
1
2000
0.0
0.0
... We also find that the diffraction peaks of Mn-doped CeO2 slightly shift to larger Bragg angles, indicating that a part of manganese species might have entered into lattice [23, 24] ...
1
2010
0.0
0.0
... We also find that the diffraction peaks of Mn-doped CeO2 slightly shift to larger Bragg angles, indicating that a part of manganese species might have entered into lattice [23, 24] ...
1
2013
0.0
0.0
... One possible explanation might be that incorporation of Mn into the lattice sites of CeO2 or that there is too small an amount of compound to be detected by XRD [25] and the structure of the as-generated Mn-doped ceria remains the same upon doping ...
1
2008
0.0
0.0
... In addition, the XRD results reveal that Mn ion effectively doped into the CeO2-Mn, which could contribute to strong interaction between the dopants and Ce-Mn-O solid solution [26] ...
1
2007
0.0
0.0
... 097 nm) [27], and this is another important factor, which is responsible for shifting of reflection peaks ...
4
2010
0.0
0.0
... In light of the proposed assignments of such peaks in other similar systems [28, 29], the observed bands can be assigned as follows: the intense band at 3426 and 1625 cm-1corresponds to #cod#x003bd ...
... Residual water and hydroxyl groups are usually detected in the as-prepared CeO2 samples regardless of synthesis method used [28, 29] ...
... species on the CeO2 surface [28] ...
... The FTIR spectra of the as-prepared ceria also exhibit strong broad band below 700 cm-1, which is due to the envelope of phonon band of metal oxide (Ce-O-Mn) network [28, 29] ...
3
2008
0.0
0.0
... In light of the proposed assignments of such peaks in other similar systems [28, 29], the observed bands can be assigned as follows: the intense band at 3426 and 1625 cm-1corresponds to #cod#x003bd ...
... Residual water and hydroxyl groups are usually detected in the as-prepared CeO2 samples regardless of synthesis method used [28, 29] ...
... The FTIR spectra of the as-prepared ceria also exhibit strong broad band below 700 cm-1, which is due to the envelope of phonon band of metal oxide (Ce-O-Mn) network [28, 29] ...
2
2011
0.0
0.0
... The spectra distinctly exhibited a strong absorption band at the UV region due to charge-transfer transitions from O2p to Ce4f and block damage by UV radiation [30] ...
... Such a blue shift in band edge with increasing Mn dopant is a clear indication of the incorporation of Mn ions into the Ce site of the CeO2 matrix [30,31,32,33,34,35] ...
4
2007
0.0
0.0
... Such a blue shift in band edge with increasing Mn dopant is a clear indication of the incorporation of Mn ions into the Ce site of the CeO2 matrix [30,31,32,33,34,35] ...
... 68 eV for CeO2 nanoparticles synthesized using sonochemical synthesis [31] ...
... We believe that this is due to the quantum confinement effect, which follows the effective mass approximation approach using a simple particle in a box model [31,32,33,34,35,36,37,38] ...
... [31, 39] have reported the optical band gap values ranging from 2 ...
5
2014
0.0
0.0
... Such a blue shift in band edge with increasing Mn dopant is a clear indication of the incorporation of Mn ions into the Ce site of the CeO2 matrix [30,31,32,33,34,35] ...
... We believe that this is due to the quantum confinement effect, which follows the effective mass approximation approach using a simple particle in a box model [31,32,33,34,35,36,37,38] ...
... [32] have reported the band gap energy for Co-doped CeO2 ranging from 3 ...
... Due to this charge imbalance, lattice distortion would occur that leads to the formation of Mn-O-Ce solid solution [32] ...
... The incorporation of Mn into the CeO2 lattice increased the bulk reduction, and the oxygen atoms bonded to both Ce and Mn (reducible elements) can contribute to the oxygen storage capacity [32] ...
2
2007
0.0
0.0
... Such a blue shift in band edge with increasing Mn dopant is a clear indication of the incorporation of Mn ions into the Ce site of the CeO2 matrix [30,31,32,33,34,35] ...
... We believe that this is due to the quantum confinement effect, which follows the effective mass approximation approach using a simple particle in a box model [31,32,33,34,35,36,37,38] ...
3
2005
0.0
0.0
... Such a blue shift in band edge with increasing Mn dopant is a clear indication of the incorporation of Mn ions into the Ce site of the CeO2 matrix [30,31,32,33,34,35] ...
... [34] have reported direct band gap values ranging from 3 ...
... We believe that this is due to the quantum confinement effect, which follows the effective mass approximation approach using a simple particle in a box model [31,32,33,34,35,36,37,38] ...
3
1997
0.0
0.0
... Such a blue shift in band edge with increasing Mn dopant is a clear indication of the incorporation of Mn ions into the Ce site of the CeO2 matrix [30,31,32,33,34,35] ...
... 1 nm) [35] ...
... We believe that this is due to the quantum confinement effect, which follows the effective mass approximation approach using a simple particle in a box model [31,32,33,34,35,36,37,38] ...
2
2002
0.0
0.0
... [36] have reported direct band gap values ranging from 3 ...
... We believe that this is due to the quantum confinement effect, which follows the effective mass approximation approach using a simple particle in a box model [31,32,33,34,35,36,37,38] ...
2
2005
0.0
0.0
... Most recently, Chen and Chang [37] have reported direct band gap values ranging from 3 ...
... We believe that this is due to the quantum confinement effect, which follows the effective mass approximation approach using a simple particle in a box model [31,32,33,34,35,36,37,38] ...
1
2006
0.0
0.0
... We believe that this is due to the quantum confinement effect, which follows the effective mass approximation approach using a simple particle in a box model [31,32,33,34,35,36,37,38] ...
1
2011
0.0
0.0
... [31, 39] have reported the optical band gap values ranging from 2 ...
1
2009
0.0
0.0
... Yue and Zhang [40] have reported that doping CeO2 with Mn ions could reduce the band gap of CeO2 more effectively than do other transition-metal dopants ...
2
2007
0.0
0.0
... [41] ...
... [41] attributed this change to the extensive structural changes caused by the incorporation of interstitial Ni ...
1
2006
0.0
0.0
... This increases the amount of Ce3+ states, resulting in the formation of localized energy states that are closer to the conduction band and thereby decreasing the band gap [42,43] ...
1
2003
0.0
0.0
... This increases the amount of Ce3+ states, resulting in the formation of localized energy states that are closer to the conduction band and thereby decreasing the band gap [42,43] ...
3
2006
0.0
0.0
... This absorption is much stronger than the 4f1-5d1 transition from the Ce3+ species in the mixed valence ceria system [44] ...
... It is known that Mn addition induces ordered arrangements of vacancies, thereby creating a pathway for oxygen diffusion [44, 46] ...
... The oxygen storage capacity of CeO2 relies on transport properties like oxygen diffusion at the surface and/or in the bulk of oxides, which will help in understanding of CO oxidation activity of CeO2 [44, 46] ...
1
2003
0.0
0.0
... stated that the blue shifts could also be explained by the change in the electronic band structure [45] ...
2
2005
0.0
0.0
... It is known that Mn addition induces ordered arrangements of vacancies, thereby creating a pathway for oxygen diffusion [44, 46] ...
... The oxygen storage capacity of CeO2 relies on transport properties like oxygen diffusion at the surface and/or in the bulk of oxides, which will help in understanding of CO oxidation activity of CeO2 [44, 46] ...
Synthesis, Structural and Optical Properties of Mn-Doped Ceria Nanoparticles: A Promising Catalytic Material
[Anees A. Ansari1, Joselito P. Labis1, Manawwer Alam2, Shahid M. Ramay3, Naushad Ahmad2, Asif Mahmood4]


 , Joselito P. Labis