


Effects of Nitrogen on the Glass Formation and Mechanical Properties of a Ti-Based Metallic Glass
[Di Cao, Yuan Wu, Hui Wang , Xiong-Jun Liu, Z. P. Lu]
, Xiong-Jun Liu, Z. P. Lu]
|
|


Effects of nitrogen addition on glass formation and mechanical properties of the Ti42.5Cu40Zr10Ni5Sn2.5metallic glass were systematically investigated. It was found that a small amount of nitrogen addition facilitated the glass formation by suppressing formation of the competing eutectic structure. Unlike large atomic size elements such as Hf and Pd which usually deteriorate specific strength, nitrogen can also increase the specific strength of the current Ti-based BMGs. The results are not only helpful for understanding glass-forming ability in general, but also useful in developing cost-effective, high-performance Ti-based bulk metallic glasses with enhanced glass-forming ability.
Among a variety of bulk metallic glasses (BMGs) developed so far, Ti-based BMGs and their composites are of particular interest due to their high specific strength and good corrosion resistance [1, 2, 3, 4, 5]. However, compared with the other BMG-forming systems such as Mg [6, 7], Cu [8, 9] and Fe [10], glass-forming ability (GFA) of Ti-based metallic glasses is relatively lower [11, 12, 13]. Development of Ti-based BMGs with higher specific strength and larger GFA is expected to expand applications of these lightweight amorphous alloys. Along this line, various composition design methods, such as minor alloying, have been employed to enhance the GFA. Recently, Ti-based BMGs with large GFA have been developed via alloying Be [1, 2, 14], Hf [15, 16] or Pd [17]. Unfortunately, Be is extremely toxic, Pd and Hf sacrifice either cost advantages or high specific strength. Therefore, it is critical to develop cost-effective Ti-based BMGs with improved GFA and specific strength.
Nitrogen is the most abundant elements in the atmosphere. Because of strong interactions with most of metal elements at high temperature, it is difficult to exclude nitrogen during the melting and machining of metallic materials. For widespread industrial applications of BMGs, it is thus vital to understand and explore effects of nitrogen on the GFA. Recently, it was reported that proper addition of nitrogen could be beneficial for glass formation in Zr-based BMGs [18]; nevertheless, it remains unclear about effects of N on GFA and mechanical properties of Ti-based alloy systems.
In this work, roles of N in glass formation and deformation behavior will be studied in detail and the related underlying mechanisms will also be discussed.
Multi-component Ti-based alloy ingots with a nominal composition of Ti42.5Cu40Zr10Ni5Sn2.5 [19] (it is referred as base alloy) were prepared by arc-melting a mixture of constituent pure metals with purity higher than 99.9% in a Ti-gettered argon atmosphere. To adjust nitrogen concentration in the current Ti-based alloys, different amounts of nitrogen, i.e., 0.05, 0.1, 0.2, 0.3, 0.5 and 1.0 at%, were added by TiN with purity larger than 99.99%. Ingots were melted more than eight times to ensure that TiN was homogeneously dissolved in the alloys. To avoid the influence of nitrogen in environment, vacuum of the chamber was pumped below 1 × 10⁻³ Pa before each melting process. Cylindrical rods with a diameter ranging from 1.5 to 5 mm were fabricated by copper mold casting. Phase identification of the as-cast samples was conducted by X-ray diffraction (XRD) with CuKα radiation (Rigaku Dmax-RB). Cross-section surfaces of the as-cast samples were examined by scanning electron microscopy (SEM) in a ZEISS SUPRA 55 instrument equipped with an energy-dispersive X-ray spectrometer (EDS). Transmission electronic microscopy (TEM) experiment was carried out with a JEOL-2100 microscopy. Thermal properties associated with glass transition, supercooled liquid region, crystallization and melting behavior were investigated by a differential scanning calorimeter (DSC) with a Netzsch STA404F at a heating rate of 0.333 K/s. Nitrogen content in the samples was measured using a LECO instruments inert gas fusion (IGF) machine with IR detection. Density (ρ ) measurements were taken by using Archimedes method with a sample weight larger than 1.0 g, and five tests were carried out to reduce the measuring uncertainties. Compression tests of the samples (Φ 2 mm × 4 mm) were conducted in a CMT4305 machine at an engineering strain rate of 2 × 10⁻⁴ s-1. A small strain gauge was used to calibrate and measure the strain during loading.
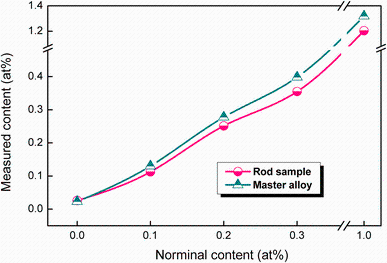
Figure 1 shows the IGF analysis results of nitrogen contents in master alloys and as-cast rod samples with different N additions. As-cast base alloy has a nitrogen concentration of 0.026 at%, which may come from the raw materials and/or the melting process. The nitrogen concentration gradually increased from 0.113 to 1.204 at% as the N doping content is increased from 0.1 to 1.0 at%. It shows the same tendency in the master alloy from 0.130 to 1.319 at% which is slightly higher than that in rod samples. These measurement results indicate that nitrogen has been successfully added into the master alloys and as-cast rod samples by using TiN in this study.
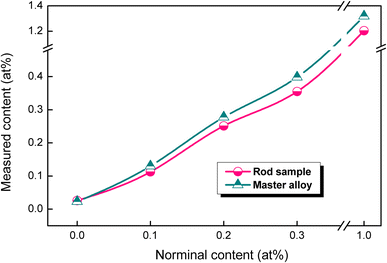 | Fig. 1 Measured concentration of nitrogen in master alloys and as-cast rod samples with different N additions |
Microstructure evolution of the as-cast specimens with different nitrogen contents is shown in Fig. 2. Base alloy sample (i.e., no nitrogen added) with a diameter of 3 mm shows a featureless structure (Fig. 2a), while the center of the base alloy specimen with a diameter of 4 mm displayed a fully crystalline structure (Fig. 2b), with an amorphous ring in a thickness of about 1 mm (not shown), suggesting that the critical diameter of base alloy is 3 mm. When 0.1 at% nitrogen was added, a featureless amorphous phase was obtained in the 4-mm diameter rod (Fig. 2c), indicating that the GFA of this alloy has been improved. As the diameter is increased to 5 mm, a composite structure consisting of glass matrix, needlelike phase and spherical phase was formed (Fig. 2d). Based on observation, this spherical particle is the main competing phase that limited the GFA of the alloys with 0.1 and 0.2 at% N. For the alloy doped with 0.2 at% N, the spherical phase grew much larger than that in the 5-mm-diametered 0.1 at% N alloy (Fig. 2e) from several micrometers to about 20 μ m, indicating more addition of N promotes the growth of this phase. From the SEM observation, this spherical particle is the main competing phase that limited the GFA of the alloys with 0.1 and 0.2 at% N. Further increasing the nitrogen content to 0.5 at%, black particles with a size of about 2 μ m and needlelike phase randomly dispersed were seen even in the rod with a diameter of 1.5 mm, indicating that excessive nitrogen appreciably deteriorated the GFA and the critical size for glass formation in the alloy added with 0.5 at% N is smaller than 1.5 mm.
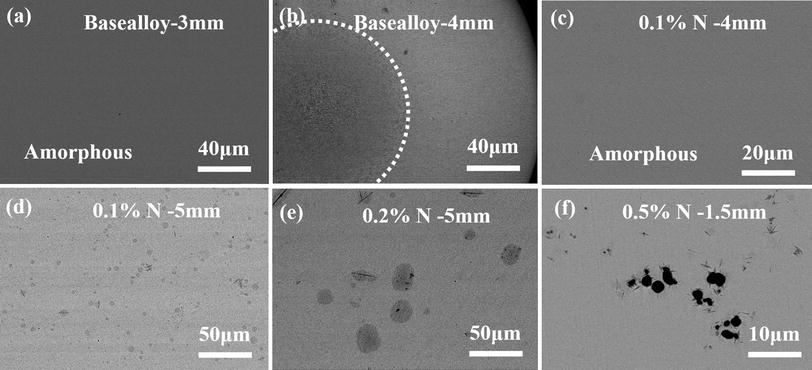 | Fig. 2 Microstructures of different samples: a 3-mm-diametered rod of base alloy; b 4-mm-diametered base alloy; c4-mm-diametered rod with 0.1 at% N; d center of 5-mm-diametered rod with 0.1 at% N; e 5-mm-diametered rod with 0.2 at% N; and f 1.5-mm-diametered rod with 0.5 at% N |
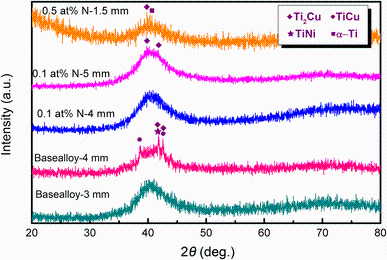
Phase identification was conducted by XRD and EDS. Typical XRD patterns of the specimens with different nitrogen contents and diameters are shown in Fig. 3. The 3-mm-diametered cylindrical rod of base alloy yielded a fully amorphous structure, and no crystalline diffraction peaks were detected. Nevertheless, sharp crystalline peaks identified as Ti2Cu, TiNi and TiCu phases superimposed on the halo were observed in the 4-mm-diametered cylindrical rod of base alloy, indicating that the eutectic structure observed in Fig. 2b is composed of these three phases. With 0.1 at% N addition, 4 mm sample illustrates a typical amorphous hump and no appreciable sharp crystalline peaks can be observed. Two small peaks indexed as Ti2Cu are identified in the 5-mm rod with 0.1 at% N. For the sample added with 0.5 at% N, several peaks identified as α -Ti and Ti2Cu appeared in the XRD pattern, which corresponds to the dark spherical and needlelike phases in Fig. 2f.
 | Fig. 3 XRD patterns of as-cast rod samples with different N additions and diameters |
Based on the above results, it is known that addition of 0.1 at% N gave rise to the highest GFA. To understand the underlying mechanism, EDS and TEM characterization were conducted for this alloy. Based on the EDS results, the needlelike phase (in Fig. 2d) has a composition close to Ti2Cu which is consistent with the peaks indexed as Ti2Cu with space group of I4/mmm appear in the XRD pattern (Fig. 3), while the spherical phase has a similar composition to the glassy matrix, indicating that polymorphous crystallization [20] takes place during the solidification of the alloy with 0.1 at% N. It is to be noticed that no crystalline peak on the XRD curves corresponding to this phase was seen. From the selected area electron diffraction (SAED) pattern in the TEM image (Fig. 4), it is clear that this spherical phase has a quasicrystalline structure.
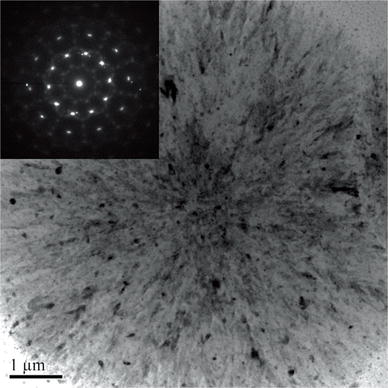 | Fig. 4 Bright-field image of the spherical phase in alloy doped with 0.1 at% N, and inset is the corresponding SAED pattern |
Figure 5 is the composition-cooling rate-phase formation diagram of the Ti-based BMG alloys added with different amounts of N. The competing phases of different alloys are listed in Table 1. It can be seen that the GFA of this alloy is sensitive to the N content. With the addition of 0.1 at% N, the GFA was appreciably enhanced. Nevertheless, when the N content exceeded 0.1 at% (e.g., 0.2 and 0.3 at% N), the GFA of the alloy was deteriorated due to the promotion of quasicrystals and the critical diameter dropped from 4 to 2 mm. With further increase in N content higher than 0.5 at%, the GFA was severely decreased owing to the easy precipitation of α -Ti and the critical diameter was smaller than 1.5 mm. Therefore, the optimum content for N addition in the current Ti-based BMG is about 0.1 at%.
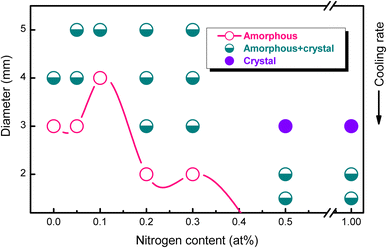 | Fig. 5 Dependence of microstructure on the N content and cooling rate in the Ti42.5Cu40Zr10Ni5Sn2.5 alloy |
| Table 1 Thermal properties and GFA indicators of the alloys with different nitrogen additions |
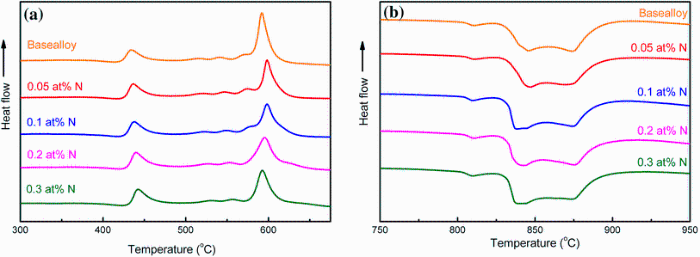
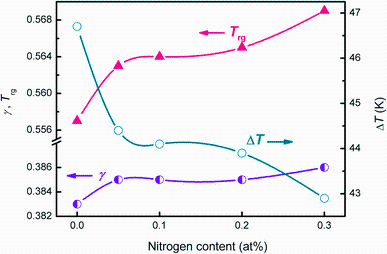
To understand the beneficial effect of N, thermal properties of all the N-doped Ti-based alloys were studied. Figure 6 shows the DSC and DTA curves of the as-cast alloys added with different N additions. The glass transition temperature Tg, onset crystalline temperature Tx, supercooled liquid region Δ T, onset melting temperature Tm, liquidus temperature Tl, reduced glass transition temperature Trg = Tg/Tl [21] and γ = Tx/(Tg + Tl) [22, 23] for all the investigated alloys are listed in Table 1. It can be seen that addition of no more than 0.3% N did not significantly change the crystallization and melting behavior of the current Ti-based alloy.Tg and Tx gradually shifted to higher temperatures with nitrogen addition, e.g., increase from 375.7 and 422.4 ° C for base alloy to 389.4 and 432.3 ° C for the alloy with 0.3 at% N, respectively. Tm varied around 803 ° C as the nitrogen concentration changed, while Tl hovered around 890 ° C. Based on the theoretical work on crystal nucleation in supercooled liquid metals, the glass-forming ability proposed by Turnbull [21] should increase with Trg. Afterward, γ was also proposed to has a good interrelationship with GFA from both aspects of liquid phase stability and crystallization resistance [22]. As shown in Fig. 7, GFA indicator parameters Trg and γ rise with the nitrogen content from 0.557 and 0.383 for base alloy to 0.569 and 0.386 for the alloy with 0.3 at% N, respectively. Nevertheless, the supercooled liquid region, Δ T, which indicates the thermal stability of a metallic glass [24] decreased with the N addition. It can thus be seen that all GFA indicators Trg and γ can reflect the beneficial effect of the N addition, but seemingly cannot accurately pinpoint the best GFA.
 | Fig. 6 DSC and DTA curves of the as-cast alloys with different nitrogen additions |
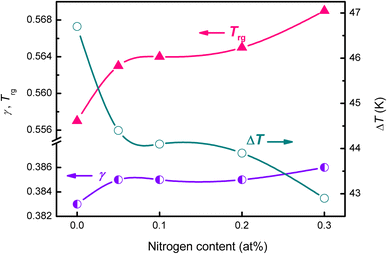 | Fig. 7 GFA indicator parameters and supercooled liquid region dependence on nitrogen content |
Glass formation is virtually to avoid crystallization during solidification, which is a competing process between liquid phase and the resulting crystalline phases. The GFA of BMGs is related to two aspects: liquid phase stability and the stability of competing crystalline phases [23]. Either increasing the liquid phase stability or destabilizing the competing crystalline phases can increase the GFA of glass-forming liquids.
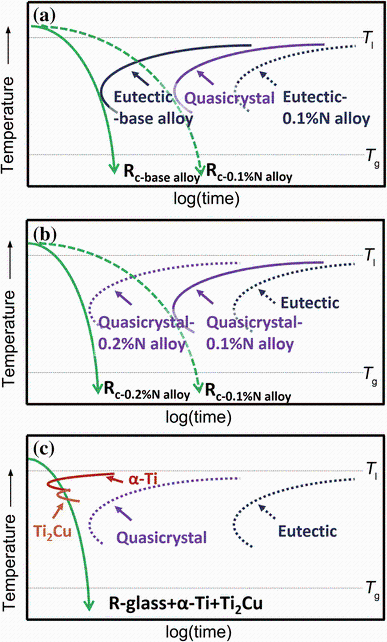
The melting curves in Fig. 5b clearly show that nitrogen addition do not change the melting behavior of this alloy; namely, minor addition of nitrogen has no significant effect on the stability of the liquid phase which is different from N in Zr-based metallic glass [18]. Then, frustration of competing crystalline phases by proper nitrogen additions could be responsible for the enhancement of glass formation in the current Ti-based alloy. The competing crystalline phase in base alloy is a eutectic structure composed of Ti2Cu, TiNi and TiCu. With the addition of 0.1 at% N, formation of the eutectic was suppressed and the competing crystalline phases changed to quasicrystals. With further increase in N addition, the competing crystalline phase stays the same, while the quasicrystal precipitates much more easily. These observations indicate that an appropriate content of N destabilized the initial eutectic phase, thus enhancing the glass formation, while excessive nitrogen promoted the formation of quasicrystal and decreased the GFA. This scenario can be easily understood by an illustration of time-temperature-transformation (TTT) diagram shown in Fig. 8. To form a fully glassy structure in base alloy, the cooling rate has to be fast enough to bypass the nose of the eutectic structure [25].
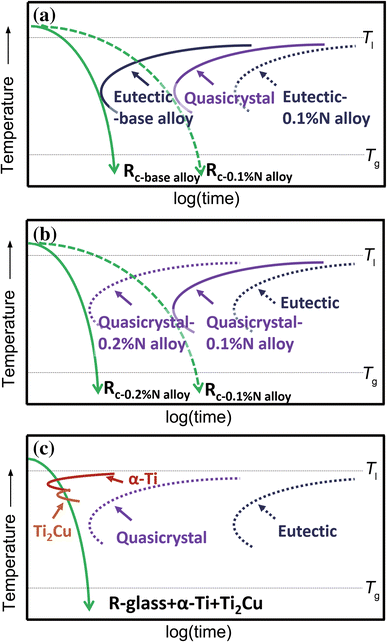 | Fig. 8 Schematic time-temperature-transformation (TTT) diagrams for base alloy and alloy with 0.1 at% N a, alloys with 0.1 and 0.2 at% N, and the alloy with 0.5 at% N c |
With the 0.1 at% N addition, the TTT curve for the eutectic moves toward the longer time, and glass formation actually competes with the formation of the quasicrystal phase (shown in Fig. 8a). Nitrogen has a small atomic radius of 0.075 nm, the solubility of N in ordered intermetallic compounds is limited, and long-range redistribution is necessary during the formation of TiNi, TiCu and Ti2Cu upon solidification. A high concentration layer of nitrogen atoms would be built up ahead of the solid-liquid interface, furthering retarding the nucleation and growth of these intermetallic compounds [26]. Therefore, proper addition of N suppressed formation of these crystalline phases and reduced the critical cooling rate, leading to a larger GFA [27].
With the increase in N addition to 0.2 at%, formation of quasicrystals was promoted and its TTT curve moves to the shorter time scale as shown in Fig. 8b, resulting in a faster cooling rate and reduction in the GFA [25]. With the further increase in N addition to 0.5 at%, nevertheless, formation of α -Ti became dominant. It is well known that nitrogen is the α -Ti stabilizer and its addition tends to enlarge the α -Ti region, as clearly demonstrated in the Ti-N binary phase diagram [28]. As a result, α -Ti formed rapidly during cooling and its TTT curve shifted toward the upper left of the diagram (Fig. 8c) due to its fast kinetics and high liquidus temperature [29]. Consequently, the critical cooling rate for the alloy 0.5 at% was significantly increased and the as-cast 1.5-mm diameter rod of this alloy even showed a microstructure composed of glass matrix, α -Ti and Ti2Cu,
Formation of quasicrystals has been reported in as-cast or annealed Al-based [30], Zr-based [31, 32] and Ti-based [33] MGs. Based on our SEM observation, quasicrystal formation is promoted by N doping. Saida [34] suggested a criteria for formation of quasicrystals, i.e., an alloy with more than three components, large difference in atomic size (> 10%) and at less one atomic pair with nearly zero or positive heat of mixing. In addition to the large atomic size difference (from 0.162 nm for Sn to 0.125 nm for Ni) and positive heat of mixing pairs (Hmix Cu-Ni = 4 kJ/mol) in this alloy, a small amount of nitrogen may stabilize quasicrystalline structure in these alloys owing to its small atomic size [35, 36] which tightens local atomic arrangement. The crystal size increases from several micrometers to about 20 μ m due to the stabilization effect of N. Considering the similar composition between the glass matrix and quasicrystals, it probably can be treated as a mediate phase between glass and the stable eutectic phase during casting [37]. The formation of quasicrystal depends on the cooling rate. A lower or higher cooling rate will result in eutectic or glass phase, respectively. However, N addition enlarges the cooling rate range of the quasicrystals by a slowing down of diffusion caused by a tightening of local atomic arrangement. As discussed above, stability of the competing phase is the main factor controlling the GFA in this alloy. Rapid growth of quasicrystal induced by nitrogen addition should be the origin results in the failure of pinpointing the best glass former based on the GFA indicators Trg and γ in nitrogen-doped alloys [22].
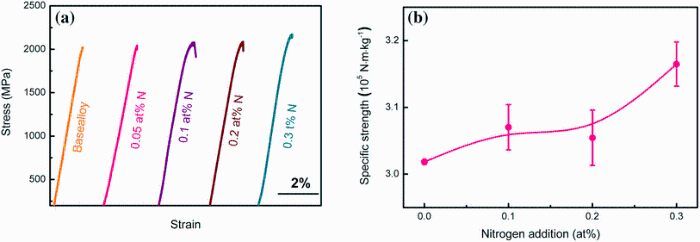
Compression tests of the current Ti-based BMGs with a different amount of N were carried out at room temperature. The corresponding stress-strain curves are shown in Fig. 9. Yielding stress σ y, fracture stressσ f and plastic strain ε p are compiled in Table 2. Yield stress of base alloy is 2023 MPa, and no plastic deformation was observed. With the addition of nitrogen, yield stress increased gradually to 2160 MPa in the sample with 0.3 at% sample. Nevertheless, all the samples exhibited limited plastic deformation and fractured in a brittle manner.
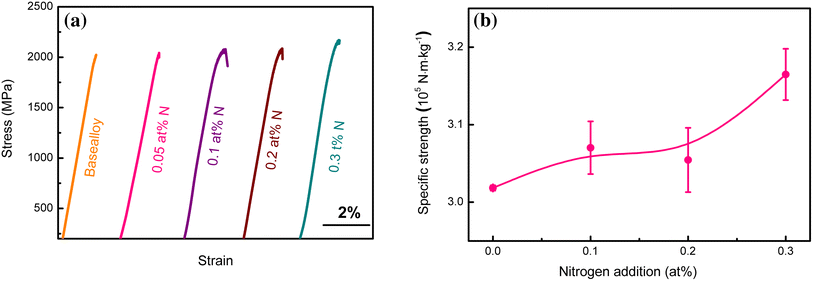 | Fig. 9 Compressive stress-strain curve of Ti-based BMGs with different N additions a, and variation of specific strength with nitrogen addition b |
| Table 2 Yielding stress, fracture stress, plastic strain and specific strength for different alloys |
It is known that Ti-based BMGs with low density and high specific strength are attractive to engineering application [1, 2]. In the present work, since the addition of N did not significantly vary the density while improved the yield strength over 100 MPa, the specific strength (defined as yield strength/density) of these Ti-based metallic glasses was appreciably increased. The 0.1 at% N added alloy shows a specific strength of (3.070 ± 0.034) × 105 Nm/kg, together with a critical size of 4 mm for glass formation. Particularly, the 0.3 at% N BMG possesses a specific strength of (3.165 ± 0.033) × 105 Nm/kg, 5% larger than that of base alloy ((3.018 ± 0.003) × 105 Nm/kg). Therefore, nitrogen addition is an effective way to improve the GFA and specific strength for Ti-based metallic glasses simultaneously.
According to Liu et al. [38] and Yang et al. [39], higher Tg always implies higher yield or fracture strength since plastic flow and mechanical failure in MGs are a consequences of stress-induced glass transition [40]. From Tables 1 and 2, there is a positive correlation between σ y and Tg for the current Ti-based metallic glasses. Liu et al. [38] suggested a simple relation between yield strength and glass transition temperature τ y = 3R (Tg - TR)/V, where τ y ≈ 2σ y is yield shear stress, R is gas constant, TR is room temperature andV is molar volume. In the present work, τ y correlates with (Tg - RT)/V by a slope parameter of 25.03 ± 6.32, which is close to 3R (24.94) based on Ref. [38]. Nitrogen addition tends to introduce covalent bonds which are stronger than metallic bonds. In addition, small N atoms can enhance the topological ordering, leading to the formation of a highly dense random packed structure [41]. As a result, the alloy has good ability to resist shearing and therefrom possesses higher yield strength [42]. A denser packing structure also indicates that bonding lengths between adjacent atoms are shorter, i.e., a smaller characteristic length λ , giving rise to stronger bonding forces among constitute elements [43, 44] and higher yield strength eventually [44]. Therefore, the increment in the strength can be well interpreted as a consequence of bonding type and bonding length changes resulted from the N addition.
Effects of nitrogen addition on the glass formation and mechanical properties in the Ti42.5Cu40Zr10Ni5Sn2.5BMG were systematically investigated. Proper addition of N facilitated the glass formation in the Ti42.5Cu40Zr10Ni5Sn2.5 alloy by suppressing the formation of the primary eutectic phase. In addition, addition of N was increased the specific strength of the current Ti-based metallic glasses due to its small atomic size. Our findings not only shed new insights into understanding of glass formation, but also are important for mass production of Ti-based BMGs.
The authors have declared that no competing interests exist.
作者声明: 无竞争性利益关系
| [1] |
|
| [2] |
|
| [3] |
|
| [4] |
|
| [5] |
|
| [6] |
|
| [7] |
|
| [8] |
|
| [9] |
|
| [10] |
|
| [11] |
|
| [12] |
|
| [13] |
|
| [14] |
|
| [15] |
|
| [16] |
|
| [17] |
|
| [18] |
|
| [19] |
|
| [20] |
|
| [21] |
|
| [22] |
|
| [23] |
|
| [24] |
|
| [25] |
|
| [26] |
|
| [27] |
|
| [28] |
|
| [29] |
|
| [30] |
|
| [31] |
|
| [32] |
|
| [33] |
|
| [34] |
|
| [35] |
|
| [36] |
|
| [37] |
|
| [38] |
|
| [39] |
|
| [40] |
|
| [41] |
|
| [42] |
|
| [43] |
|
| [44] |
|