
Tearing Toughness of Ductile Metals
[Cui-Hong Li, Qi-Qiang Duan, Zhe-Feng Zhang ]
]
]
|
|


A new parameter, i.e., tearing toughness, was employed to characterize the mechanical properties of some ductile metals (Cu, Cu-2 wt% Be, Cu-Al alloys, and some steels) by using three-leg trousers tearing tests. The experimental results demonstrate that their tearing toughness is not a physical constant and shows a close relationship with the materials’ types and microstructures. It can be inferred that the tearing toughness of different ductile metals has their respective variation range, expectantly, and may be represented by the comprehensive mechanical properties of strength and ductility for various ductile materials.
Tensile properties are very valuable in selecting materials for various applications and are also referenced in research and development to compare new materials or processes. With plasticity theory, the tensile stress-strain curves can be used to predict the mechanical behaviors of materials under forms of loading other than uniaxial tension. On speaking of a structural material, strength, the primary concern among their tensile properties, is the resistance to plastic flow [1, 2], and no doubt it is an important parameter in engineering applications. However, the increase in strength is usually accompanied with a loss of ductility, of which the trade-off between strength and ductility has made great trouble for the selection among various engineering materials, indicating that the strength is by no means the only important one and usually a material must provide comprehensive properties [3, 4].
Toughness often refers to as the resistance of a material to the propagation of a crack [2]. Materials’ toughness is useful for engineering design because it is coupled to the fracture toughness, which is the design parameter for materials containing cracks or flaws [5], to measure the tendency of cracks with given dimensions to propagate under the special stress conditions [4]. The fracture toughness (KIC) has been successfully employed to characterize the mechanical properties of those high-strength or brittle materials [6, 7, 8]; nevertheless, it is inapplicable to the ductile materials because of the complex fracture processes and dependence on the loading formats and specimen shape [7, 8, 9].
Attempt on toughness evaluation of ductile materials has been performed at full stretch. Notch and high stress ratio was introduced to change the strain state of the ductile metals for using the concept of fracture toughness. However, for the thin ductile materials, especially sheet materials, it is difficult to make the tests for measuring the fracture toughness as those high-strength or brittle materials. Besides, there is another testing method, which is called as tearing test with various loading formats (uniaxial, biaxial, or multiple) [10, 11, 12, 13, 14, 15] and different specimen shapes [7, 8, 9] for thin sheet of ductile materials, and correspondingly, a series of assessment parameters (tearing strength [16], tearing energy [17], the essential work of fracture we [6, 8, 18], and fracture toughness R [14, 19, 20]) have been proposed and used [11, 21, 22, 23, 24]. Based on the tearing tests, it is wondered whether the method can be utilized to evaluate the resistance to crack propagation or to measure the toughness of ductile materials; furthermore, it can be applied for the comprehensive mechanical properties of ductile materials in engineering application. In our previous study [25], a new parameter, tearing toughness γ , which is defined to represent the fracture work dissipated per unit area of a tearing crack in evaluating the resistance to the crack propagation of ductile materials, was proposed when the 20 steel thin sheets were torn. In this work, several typical ductile metals are also measured by using the three-leg trousers tearing test to demonstrate the feasibility of the tearing toughness for better understanding the comprehensive properties of various ductile materials.
Cold-rolled 20 steel sheets, cold-rolled T2 copper sheets, as-hot-forged Cu-2 wt% Be alloy bars, three different cold-rolled and annealed Cu-Al alloy plates (Cu-2.3 at% Al, Cu-7.2 at% Al, and Cu-11.6 at% Al), and some high manganese steels (20 wt% Mn, 25 wt% Mn) with composition of Fe-Al-Mn-Si were used in this study. Both of the specimens for tensile and three-leg trousers tearing tests were cut along the rolling direction. The gauge section of tensile specimens has dimensions of 16 mm × 3 mm × 3 mm, and the three-leg trousers tearing specimens were cut from the sheet materials to have dimensions of 40 mm × 20 mm × 0.5 mm. With an interval of 12 mm, two initial notches of 20 mm in length were cut on one of the short edges of the thin sheets for tearing, just as shown in Fig. 1a. Before mounting the tearing specimen, the middle leg and the other two-edged leg of the three-leg trousers testing specimens were bent to the optical direction to suit for the testing machine, and once tearing cracks propagate, stable tearing processing can be obtained, as shown in Fig. 1b. Some tensile and tearing specimens for 20 steel sheets were quenched at 920 ° C and then tempered at 200, 400, 600, and 700 ° C for 2 h, respectively. Cold-rolled Cu sheets were annealed at 200, 400, and 600 ° C for 2 h, respectively. For those Cu-2 wt% Be alloy specimens, there are four heat treatment procedures: solution-treated at 780 ° C for 20 min and quenched in water, as-hot-forged at 700-780 ° C, under-aged at 280 ° C for 20 min, and two-step-aged at 220 ° C for 90 min and then at 320 ° C for 120 min, and the specimens are defined as A, B, C and D, respectively. All the annealed Cu-Al alloy specimens were annealed at 800 ° C for 2 h. Those as-hot-forged high manganese steel bars (25 mm × 25 mm) were solution-treated at 1100 ° C for 1 h and then were hot-rolled to be plates of 7 mm in thickness. The tensile tests were performed using an Instron 5982 testing machine, and the tearing tests were performed at a constant displacement rate of 1 mm/min using an Instron E1000 testing machine.
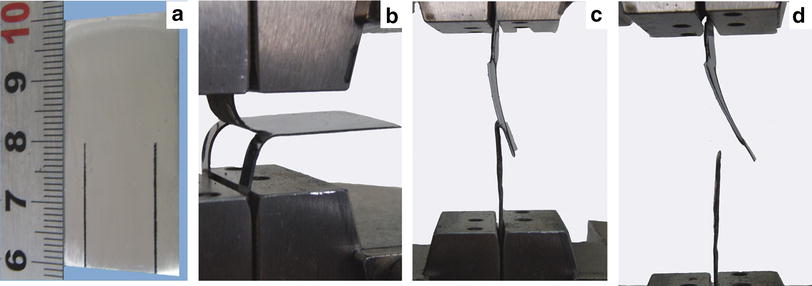 | Fig. 1 a Typical tearing specimen and tearing tests at different stages, b onset of tearing, c stable propagation of tearing crack, d final tearing fracture |
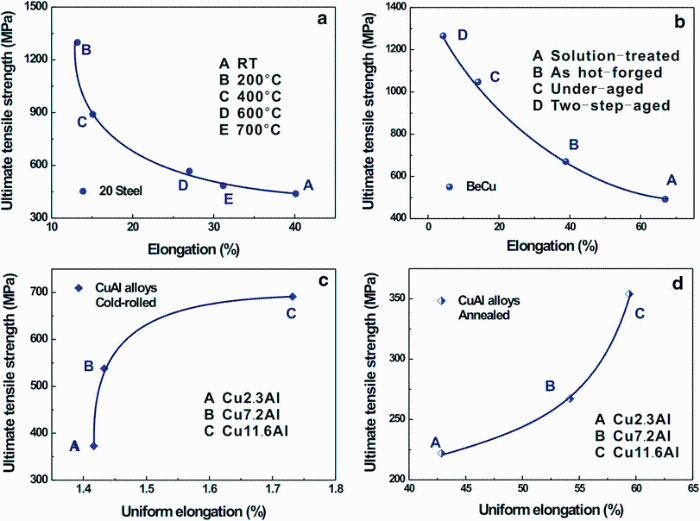
Strength-elongation relationship curves of 20 steel, Cu-2 wt% Be alloy, and cold-rolled and annealed Cu-Al alloy sheets are shown in Fig. 2. Apparently, the relationships between strength and elongation show the similar tendency, for 20 steel and Cu-2 wt% Be alloy [25, 26], i.e., a typical trade-off relation exists, while for both cold-rolled and annealed Cu-Al alloys, with increasing Al content, the uniform elongation and ultimate tensile strength increase concurrently [27]. Coincidentally, the simultaneous increase in strength and ductility was also achieved in Cu-Al alloys after equal-channel angular pressing (ECAP) and high-pressure torsion (HPT), and the reason was attributed to the decrease in the stacking fault energy (SFE) of Cu-Al alloys with different Al contents [28, 29, 30]. The different strength-elongation relationship curves give rise to an interesting question: How strength can be matched well with toughness for those different ductile metals? Therefore, it is necessary to further evaluate or establish the relationship between strength and toughness of the ductile materials.
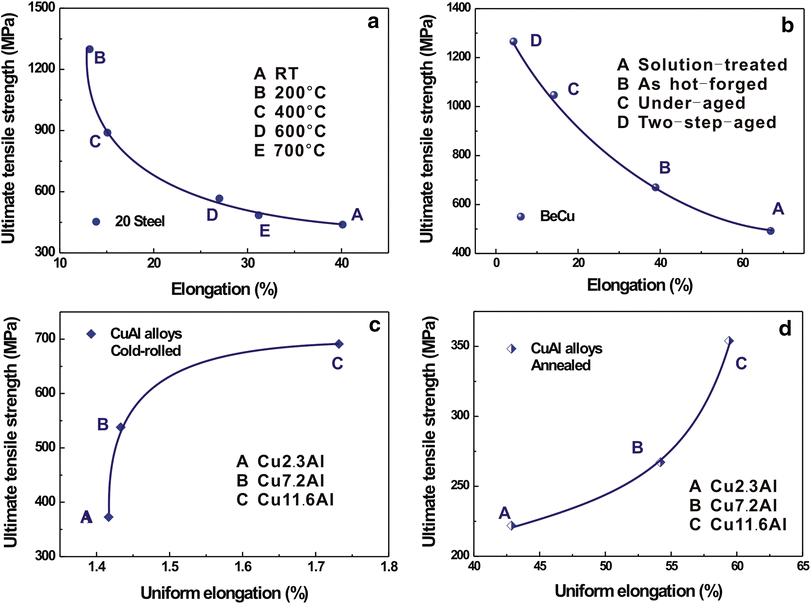 | Fig. 2 Relationship between strength and elongation of 20 steel a, Cu-2 wt% Be alloy b, cold-rolled Cu-Al alloys c, annealed Cu-Al alloys d |
Though the essential work of fracture we and fracture toughness R are used mostly during tearing tests [19, 20, 23, 24], both parameters cannot be calculated directly, and values of parameter are obtained by extrapolating from lots of experimental results. According to the trousers tearing tests of 20 steel sheet specimen, which has the 8 mm in notch width, concept of tearing toughness γ is proposed to evaluate the resistance to crack propagation, and to reflect the comprehensive mechanical properties of strength and ductility for ductile metallic materials [25]. Figure 1 shows the whole tearing processing during the trousers tearing test of thin ductile metals, including the onset of tearing (Fig. 1b), stable propagation of tearing crack (Fig. 1c), and final tearing fracture (Fig. 1d). All the tearing specimens of the typical ductile metals are performed in the same way.
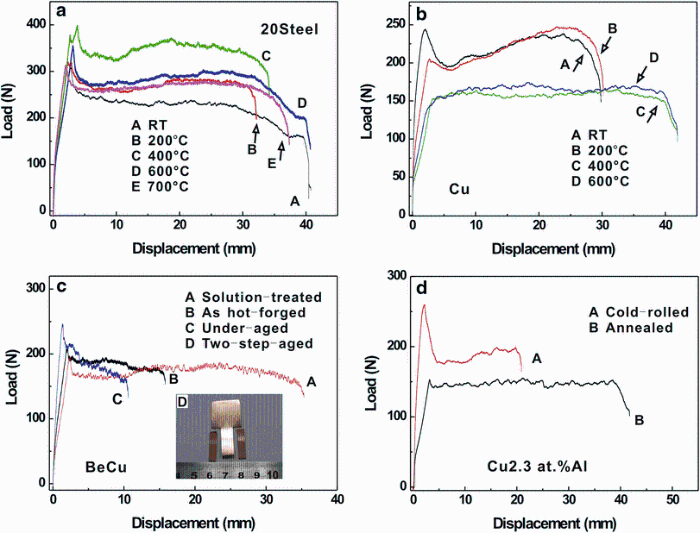
Tearing load-displacement curves for several ductile metals are shown in Fig. 3. As for the results of the 20 steel (Fig. 3a), each applied load increases sharply with the displacement up to the peak point and then starts to drop gradually to a steady value, just as the original definition of the tearing toughness [25]. While for tearing results of copper sheets (Fig. 3b), the shapes of tearing load-displacement curves are different, for those cold-rolled and annealed copper sheets at 200 ° C, tearing load-displacement curves are in accordance with the schematic diagram of the definition of tearing toughness. With increasing annealing temperature to 400 and 600 ° C, the peak point of the applied load disappears, and the tearing crack keeps stable propagation during the whole tearing processing. It is interesting to note that, for Cu-2 wt% Be alloy sheets (Fig. 3c), the load-displacement curves of solution-treated, as-hot-forged, and under-aged specimens are similar to the 20 steel ones, and there are still peak points and stable values of tearing load. When the Cu-2 wt% Be alloy get two-step-aged, the specimen will get brittle fracture (as shown in Fig. 3c) and the tearing test cannot be performed completely. This may be attributed to the less ductility of two-step-aged Cu-2 wt% Be alloy, indicating that the tearing test is suitable for those metals with certain ductility. For those Cu-Al alloys with different Al contents, the tearing load of cold-rolled specimens all reaches the peak point first and then back to be steady; however, the annealed Cu-Al alloy specimens are always in steady processing once tearing crack initiates. From these tearing load-displacement curves, it can be concluded that the existence of the peak load point is not absolute, and the tearing curves without peak in the whole processing are also universal. Stable load value in the steady processing is the uppermost, and only the steady tearing processing is the basis of definition of tearing toughness. Based on these experimental results, the schematic diagram of definition for tearing toughness should be modified correspondingly and will be discussed as follows.
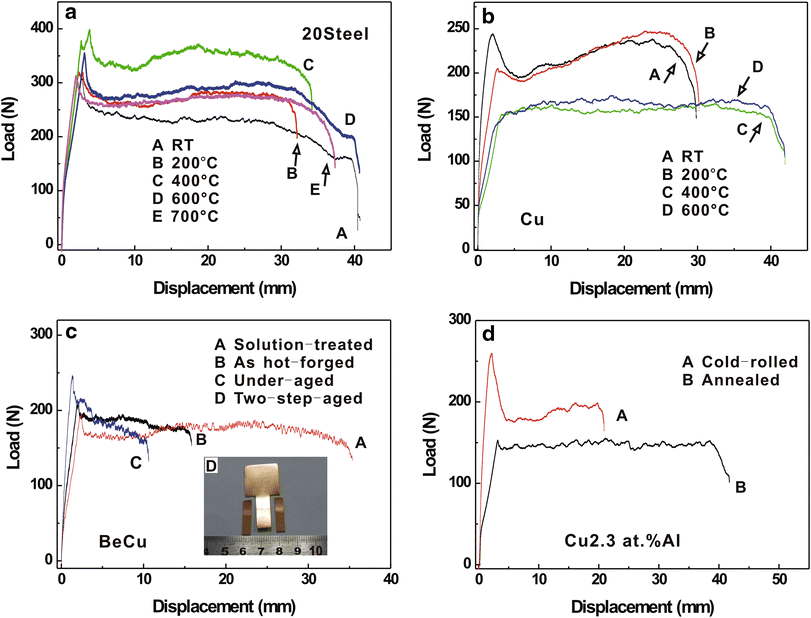 | Fig. 3 Tearing load-displacement curves of 20 steel a, Cu b, Cu-2 wt% Be alloy c, cold-rolled and annealed Cu-Al alloys d |
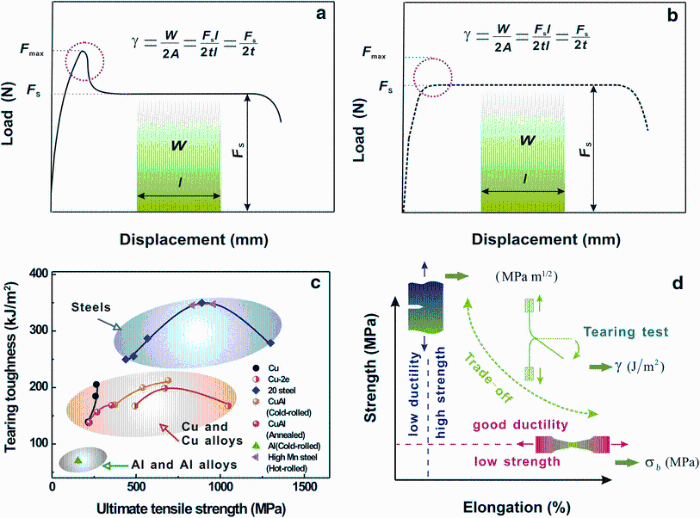
Figure 4 shows the schematic diagrams of definition for tearing toughness and tearing toughness values of several different ductile metals. According to the experimental results, the schematic diagrams of definition for tearing toughness are summarized as shown in Fig. 4a, b. If the peak value Fmax exists (Fig. 4a) or not (Fig. 4b), once tearing crack initiates, the applied load would maintain a stable value Fs. And the stable loadFs will correspond to the plastic work dissipated on the cracking surface to resist the steady propagation of the tearing crack. Accordingly, a parameter named as tearing toughness, γ , is defined to represent the fracture work dissipated per unit area of a tearing crack in evaluating the resistance to the crack propagation of ductile materials. As illustrated in Fig. 4a, b, the definition of the tearing toughness can be expressed as follows [25],
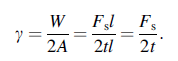 (1)
(1)
According to the definition, the values of tearing toughness for several ductile metals were calculated and are displayed in Fig. 4c, and on the whole the values are identical to those specimens whose interval width is 8 mm [25]. And obviously, it can be seen that tearing toughness is not fixed and depends on the ultimate tensile strength, and the variation tendency varies with the type of ductile metals. Tearing toughness of both 20 steel and Cu-2 wt% Be alloy rises in the beginning and then declines with increasing strength, and the highest tearing toughness of materials corresponds to the state with higher strength or less ductility (Fig. 2a, b), but not to the state with the highest strength or the least ductility. However, for Cu and Cu-Al alloys, the values of tearing toughness increase with strength (or Al content) synchronously. From the results, it can be concluded that the tearing toughness of the ductile metals is not a physical constant (just like elastic modulus) and depends on their mechanical properties or microstructures closely. It is revealed that tearing toughness may represent the comprehensive properties of strength and ductility, which is expected to be helpful in evaluating or optimizing the mechanical properties of ductile materials.
In addition, the values of tearing toughness for two types of high manganese steels are as high as 350 kJ/m2, quite close to the highest value of 20 steel. For copper and copper alloys (Cu, Cu-Al alloys, and Cu-2 wt% Be alloy), their tearing toughness values are in the range of 140-225 kJ/m2. Besides, tearing toughness of cold-rolled Al sheet is only about 70 kJ/m2. It can be clearly seen that the 20 steel and high manganese steel have obviously higher tearing toughness than Cu, Cu-Al alloys, and Cu-2 wt% Be alloy, and also Al sheet, which reveals that tearing toughness also depends on the material types in detail. In view of the results tested by trousers tearing tests, an inference can be made that tearing toughness of each type of ductile metals, such as steels, Cu and Cu alloys, and Al and Al alloys, has their own variation range, just as the elliptic areas displayed in Fig. 4c. Therefore, tearing toughness of different types of ductile metals could be classified; for example, tearing toughness of steels may be in the range of ~250 to ~350 kJ/m2, between 140 and 225 kJ/m2 for copper and copper alloys, and about 70 kJ/m2 for aluminum and aluminum alloys. Tearing toughness of ductile metals is dependent on the mechanical properties and varies with their strengths. If the relationship diagram between strength and tearing toughness, which could combine with strength and ductility of materials, would be performed perfectly, tearing toughness of the same type of materials may be estimated from the existing data roughly. In brief, as shown in Fig. 4d, the mechanical properties of those high-strength or brittle materials [6, 7, 8] can be characterized by the fracture toughness (KIC); materials with good ductility could be tested by tensile test, and information about ultimate tensile strength and elongation can be obtained from their tensile data. Additionally, trousers tearing test and tearing toughness (γ , with a unit of J/m2) can be used as a measurement, for those thin ductile materials, especially sheet materials, the tearing test is applicative.
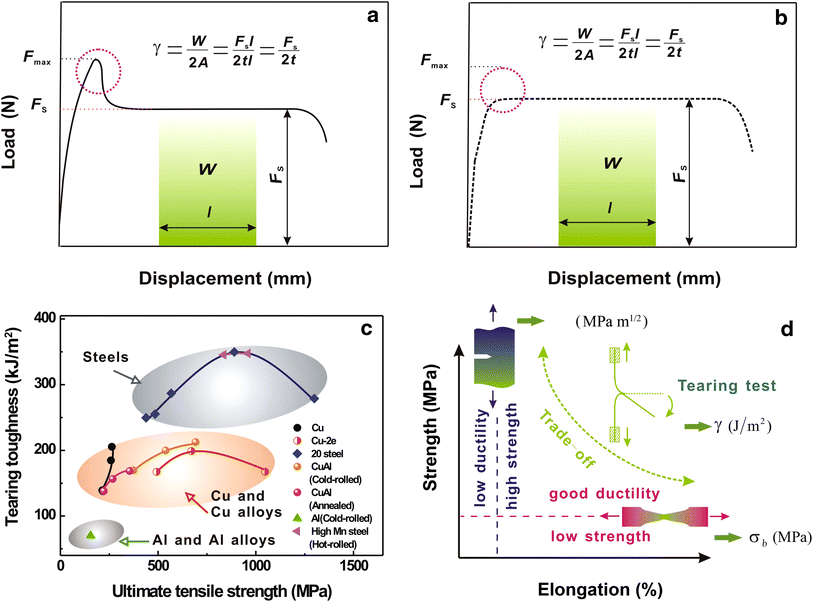 | Fig. 4 a, b Schematic diagrams of tearing load-displacement curve, c dependence of tearing toughness on the ultimate tensile strength of different ductile materials, d schematic illustration of trade-off relationship between strength and ductility of materials |
The efforts on toughness evaluation of ductile materials have not been interrupted. Though concept of tearing toughness is proposed to characterize ductile metals, the feasibility of the tearing toughness in ductile materials should be confirmed. In this letter, several ductile metals, such as 20 steel, Cu, Cu-2 wt% Be alloy, and Cu-Al alloys, are also measured by using the three-leg trousers tearing test to get more information on tearing toughness. It is revealed that the stable load in the steady tearing processing is the critical factor, which is the basis for the definition of tearing toughness. Correspondingly, the schematic diagram of definition for tearing toughness can be displayed in two different types. Similarly, tearing toughness of the several ductile metals is not a physical constant, and it shows a close relation to their tensile strengths and metal types. It can be inferred that tearing toughness of each type of ductile metal has their variation range, is dependent on the mechanical properties, and varies with their strength. It should be reminded again that high strength cannot bring high tearing toughness and similarly the highest tearing toughness of ductile materials does not correspond to the highest strength or elongation. Expectantly, tearing toughness of the same type of materials may be represented by the comprehensive mechanical properties of strength and ductility for various ductile materials.
The authors have declared that no competing interests exist.
| [1] |
|
| [2] |
|
| [3] |
|
| [4] |
|
| [5] |
|
| [6] |
|
| [7] |
|
| [8] |
|
| [9] |
|
| [10] |
|
| [11] |
|
| [12] |
|
| [13] |
|
| [14] |
|
| [15] |
|
| [16] |
|
| [17] |
|
| [18] |
|
| [19] |
|
| [20] |
|
| [21] |
|
| [22] |
|
| [23] |
|
| [24] |
|
| [25] |
|
| [26] |
|
| [27] |
|
| [28] |
|
| [29] |
|
| [30] |
|