


Complex Precipitation Sequences of Al-Cu-Li-(Mg) Alloys Characterized in Relation to Thermal Ageing Processes
Cite this Article
Zhen Gao, Jiang-Hua Chen†, Shi-Yun Duan, Xiu-Bo Yang, Cui-Lan Wu. Complex Precipitation Sequences of Al-Cu-Li-(Mg) Alloys Characterized in Relation to Thermal Ageing Processes. Acta Metallurgica Sinica(English Letters), 2016, 29(1): 94-103 
Permissions
Copyright©2016, Editorial board of Acta Metallurgica Sinica(English Letters)
Copyright reserved, Editorial board of Acta Metallurgica Sinica(English Letters)
Complex Precipitation Sequences of Al-Cu-Li-(Mg) Alloys Characterized in Relation to Thermal Ageing Processes
Abstract
The Al-Cu-Li-(Mg) alloy is a high-performance lightweight material strengthened by complex coexisting precipitates that form in the alloy upon thermal ageing. Using high-resolution (scanning) transmission electron microscopy in association with first-principles energy calculations, we systematically studied the complex coexisting precipitates in the alloys and correlated their precipitation sequences with thermal ageing processes applied. The principal results are the following: (1) eight types of precipitates can be observed in the alloy; (2) of these precipitates, the T1-phase is most stable. The S-phase precipitates with segregated Li atoms at their interfacial edges are unexpectedly more stable than the σ-phase; (3) the T1-phase has a characteristic precursor that plays the key role in its nucleation and growth.
Keyword:
Al-Cu-Li alloy; Electron microscopy; Ageing; Precipitation; Strength
1 Introduction
Al-Cu-Li-(Mg) alloys are one of the important lightweight materials in aerospace industry. It has been shown that addition of 1 wt% of Li can reduce about 3% of alloy’ s density and 6% of alloy’ s Young’ s modulus [1, 2, 3]. Their excellent properties are directly determined by the precipitation of alloying elements occurred in the alloys upon thermal ageing. Since understanding of the precipitation microstructure evolution of the alloys in relation to thermal ageing processes and compositions of alloys is crucial for obtaining optimized properties, thus far extensive studies have been focused on characterization of the precipitate microstructures [4, 5, 6, 7, 8], demonstrating that the precipitates and their evolutions are rather complex and far from the status of well understanding.
One complexity of the Al-Cu-Li-(Mg) alloy system is that many more types of the precipitates can form in the alloys, as compared to other aluminium alloy systems, and the formation mechanisms of some of them are still unclear. For the Al-Cu-Li alloy without Mg addition, the precipitation sequence had been believed as follows [9]: α -supersaturated solid solution (SSSS) → GP zones → θ ′ ′ → θ ′ → θ → δ ′ → δ → T1, whereas a recent study on a Al-Cu-Li-Mg alloy with Mg addition indicates that the precipitation sequence in the alloy aged at 165° C is the following [7]: SSSS → θ ′ ′ + T1 + σ → θ ′ ′ + θ ′ + T1 + σ → θ ′ + T1 + σ , showing that multiple types of the precipitates may coexist in the alloys. Nevertheless, most of these precipitates are well known in the study of other alloy systems. The GP zones were just the one firstly reported by Guinier [10] and Preston [11] in the Al-Cu alloy, and further studied recently with atomic-resolution imaging technique [12]. The GP zones are divided into two classes: the GPI zone with a Cu monolayer lying on {100}Al and the GPII zone known as the θ ′ ′ -phase precipitate, in which three Al layers are sandwiched by two single Cu layers. The θ ′ -phase (Al2Cu) is the plate-like semi-coherent precipitates with a tetragonal structure, and their development results in the peak strength of the Al-Cu binary alloy [13]. However, the θ ′ -phase was believed not to play a dominant role in strengthening the ternary Al-Li-Cu alloy because of its relatively small volume fraction [3]. The δ ′ -phase (Al3Li), well known in Al-Li binary alloys [14], has a L12 structure with a = 0.4308 nm [15]. It appears as sphere-like precipitates hardening the Al-Li alloys. In ternary Al-Li-Cu alloys, due to the prior formation of the GPI zones, it was observed that lenticular δ ′ -phase precipitates nucleate and grow heterogeneously around the GPI zone [16]. The hybrid structure complex made up of a GPI zone sandwiched by lenticular δ ′ -phase precipitates is stable even at 200° C [17], a temperature above the GPI zone solvus in binary Al-Cu alloys. The σ -phase (Al5Cu6Mg2) has a complex cubic structure of 39 atoms per unit cell with lattice parameter a ≈ 0.83 nm in an Al-Cu-Mg alloy [18]. The σ -phase has also been observed in an Al-Cu-Li alloy with the composition of Al5Cu6Li2 [19]. The dominant and most effective strengthening precipitate in Al-Cu-Li-(Mg) alloys is named T1-phase (Al2CuLi), initially reported by Hardy et al. [20]. It has a hexagonal structure with lattice constants of a = 0.4964 and c = 0.935 nm. Although its atomic structure has been determined, using both single crystal X-ray diffraction technique [21] and advanced atomic imaging techniques in a double-aberration-corrected transmission electron microscopy and ab initio modelling [22, 23], the nucleation and growth mechanism of the T1-precipitates have not yet been well understood. In the 1980s of the last century, electron diffraction experiments have demonstrated that a T1′ -phase (the precursor of T1-phase) may exist in an Al-4%Cu-1%Li alloy [24], but without direct observations, its structure details and relations with the T1-phase remain very unclear [25, 26].
Another complexity of the Al-Cu-Li-(Mg) alloy system appears that its precipitation sequences are closely related to both the thermal processes applied and the alloys’ compositions. When natural ageing is added before artificial ageing, the precipitation sequence in a high Li-containing alloy was observed as [27]: SSSS → δ ′ + GP zones → δ ′ + T1 + θ ′ + S′ → T1 + S′ , whereas the precipitation sequence in a low Li-containing alloy was observed as [3]: SSSS → δ ′ + GP zones → GPI zone + T1 + θ ′ + S′ → T1 + θ ′ + S′ + ν , in which the ν -phase has an unknown structure and the S′ -phase is the S-phase well known in a AA2024 alloy [28]. Adding natural ageing before artificial ageing may improve the thermal stability of alloys. Recently, the influence of natural ageing on the precipitation of Al-Cu-Li alloy was studied [29]. Nevertheless, the complex precipitation microstructures and their evolutions have not been systematically studied in relation to optimization of a (natural ageing + artificial ageing) process with respect to the properties of a Al-Cu-Li-(Mg) alloy.
In the present work, the complex evolving precipitates and precipitation sequences have systematically been investigated in relation to the thermal ageing processes and the strength of an Al-4.15Cu-1.15Li-0.29Mg (wt%) alloy. It is shown that a natural ageing for 60 days can optimize the alloy’ s hardness responses in the later artificial ageing. Using atomic-resolution electron microscopy, our study of the complex precipitates reveals the following: (1) Up to eight types of precipitates can be observed in the alloy. (2) Of these precipitates, the T1-phase is most stable. The S-phase precipitates with segregated Li atoms at their interfacial edges are unexpectedly more stable than the σ -phase. (3) The T1-phase has a characteristic precursor that plays the key role in its nucleation and growth.
2 Experimental
2.1 Alloy Samples and Thermal Ageing
A home-made Al-4.15Cu-1.15Li-0.29Mg (wt%) alloy with the addition of 0.56 Zn and 0.10 Si has been used for this investigation. The alloy samples were firstly solution treated at 520° C for 80 min with argon protection, followed by a water quench. The samples were firstly naturally aged for 0, 7 and 60 days, respectively, and then artificially aged at 180 and 200° C, respectively, for various times in oil bath. The hardness measurements were carried out using a Vickers hardness tester. Each hardness value was obtained by averaging five data of measurement. The microstructure characterization was carried out using a FEI Tecnai F20 at Hunan University and a FEI Titan ChemiSTEM at Zhejiang University. The TEM samples were prepared by using a twin-jet polishing unit with an electrolysing solution of 30 vol.% nitric acid and 70 vol.% methanol at -25° C.
2.2 HAADF Imaging in STEM
In the HAADF-STEM imaging mode, the obtained image shows a Z-contrast (where Z represents the atomic numbers of the atoms in the specimen) proportional to Z1.7-2.0 [30, 31]. Hence, the HAADF image contrast is relatively easy to interpret in terms of the structure, so long as the composition of the observed material is known. In the present study, the Cu atoms exhibit the highest HAADF intensity, whereas the Li atoms show the lowest HAADF intensity in a HAADF image of the alloy samples.
2.3 First-Principles Energy Calculations
The first-principles calculations were performed using density functional theory (DFT) implemented in the Vienna ab initio simulation package (VASP) with efficient ultrasoft pseudopotentials [32]. The generalized gradient approximation (GGA) with the exchange-correlation functional of Perdew and Wang [33, 34] was employed. Convergence tests indicated that 330 eV was a sufficient cut-off for the ultrasoft pseudo potential to achieve high precision in the Al-Cu-Li system. For all structures, k-point sampling using Monkhorst-Pack method [35] was used to achieve a precision of 0.1 kJ/mol. The thermal contributions and zero-vibration energy differences or contributions were ignored because of their small effects on this alloy system [36]. Sufficiently large super cells were used in all calculations in order to include the interface energy and the strain energy for the precipitates [36]. The formation enthalpies were defined and calculated in kJ/mol per solute atom.
The formation enthalpy (with thermal contributions and zero-vibration energy differences or contributions being ignored without any significant errors [36]) for an equilibrium phase Al w Cu x Li y Mg z can be defined as
Δ H(AlwCuxLiyMgz)=E(AlwCuxLiyMgz)-wAlE(Al)-xCuE(Cu)-yLiE(Li)-zMgE(Mg).
where E(AlwCuxLiyMgz) is the total energy of AlwCuxLiyMgz phase per atom, obtained by first-principles calculations. E(Al), E(Cu), E(Li) and E(Mg) are that for the pure elements, Al, Cu, Li and Mg, respectively. wAl = w/(w + x+y + z), xCu = x/(w + x+y + z), yLi = y/(w + x+y + z) and zMg = z/(w + x+y + z) are the fractional compositions of Al, Cu, Li and Mg, respectively.
3 Results and Discussion
3.1 Age-Hardening Responses of the Alloy
Figure 1a shows the hardness values of naturally aged and artificially aged alloy samples. It is seen that upon natural ageing the alloy first demonstrates a rapid increase in hardness within 24 h and then reaches its peak hardness value at 48 h. With increasing of ageing time, the hardness keeps unchanged on a flat hardness plateau. When aged at 200° C, the alloy shows three obvious hardness peaks. The hardness reaches the first peak value (171 HV) at 12 h, the second peak value (167 HV) at 32 h and eventually the third peak value at 44 h. Upon ageing at 180° C, the age-hardening behaviour of the alloy is somewhat similar to that of the alloy aged at 200° C, apart from the following points: (1) its second hardness peak is not very obvious, (2) its overall hardness is higher and (3) its hardness increase in the initial stage is slower, as shown by the inset in Fig.1a.
 | Fig.1 Ageing-hardening curves of the alloy aged at different conditions: a single-step ageing, b double-step ageing |
Figure 1b shows the hardness curve of the alloy treated with two-step ageing, in which the effects of natural ageing for 7 and 60 days on the later ageing at 200° C have been shown. It is seen that the samples natural aged for 60 days have a better age-hardening response than those natural aged for 7 days. In Fig.1b, it is also shown that the natural-aged samples have a better hardening response to the artificial ageing at 200° C rather than that at 180° C, which is somewhat different from the hardening behaviour of the alloy upon a one-step ageing (Fig.1a). Furthermore, comparing Fig.1a with Fig.1b, it can be seen that the combination of natural ageing for 60 days plus artificial ageing at 200° C can form a rather good age-hardening thermal process, yielding not only quick hardening response but also higher hardness of the alloy. Interestingly, this implies that some of the clusters and the precipitates formed during 60 days of natural ageing can continue to grow upon later artificial ageing at 200° C.
3.2 Precipitation Microstructures of the Alloy
3.2.1 Precipitates Formed Upon Natural Ageing
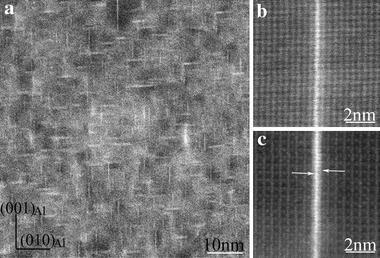
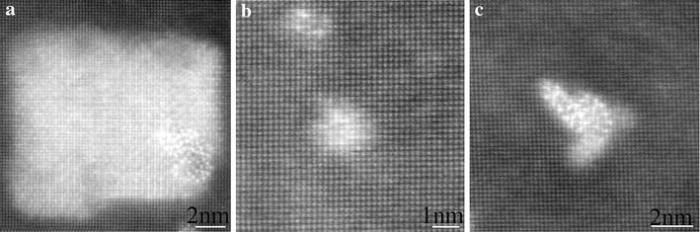
Figure 2a shows the HAADF images of the sample natural aged for 60 days. It is seen that GP zones (Fig.2b) and δ ′ -GP-δ ′ precipitate composites (Fig.2c) were formed and uniformly distributed in the Al-matrix, as reported in an Al-3.2Cu-1.6Li (wt%) alloy [17]. The GP zones are Cu-monolayer GPI zones, showing bright contrast (with respect to the Al-matrix). The δ ′ -GP-δ ′ composites show bright contrast in its middle and dark contrast on two sides. The two lenticular δ ′ -particles flanking the GPI zone are in “ anti-phase” relation with respect to each other (as indicated by the white arrow in Fig.2c). The left δ ′ -particle shifts 0.5 cells in relation to the right one. Hence, the precipitation sequence upon natural ageing is: SSSS → GPI → GPI + δ ′ -GPI-δ ′ .
 | Fig.2 HAADF-STEM images of the alloy natural aged for 60 days, viewed along a < 100> Al direction: a an overview of the precipitates, b a Cu-monolayer GPI zone, c a δ ′ -GPI-δ ′ precipitate composite in an “ anti-phase” relation |
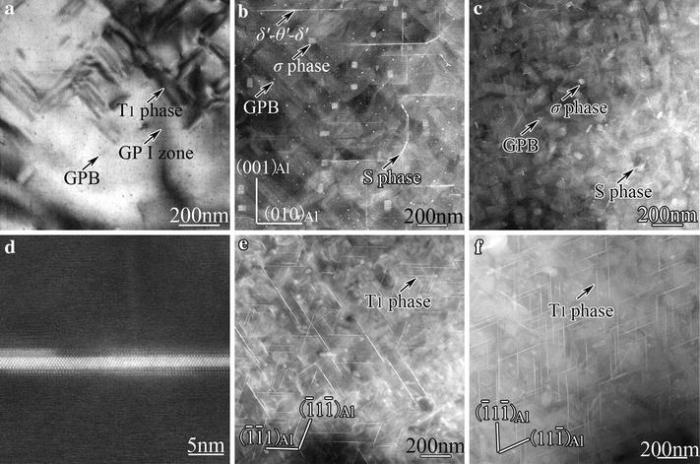
 | Fig.3 Microstructures of samples ageing at 200° C for various times: a-c 2, 12 and 72 h, respectively, viewed along < 100> Al. d δ ′ -θ ′ -δ ′ composite phase as indicated by arrow in b. e, f 12 and 72 h, respectively, viewed along < 011> AlSummarizing our observations and that reported for the samples aged at 180° C [6], the precipitation sequence in an Al-Cu-Li-Mg alloy treated with one-step artificial ageing at about 180-200° C can be considered as follows: SSSS → GPI + δ ′ -GPI-δ ′ + GPB + T1 → δ ′ -θ ′ -δ ′ + GPB + T1 + σ + S → GPB + T1 + σ + S. |
3.2.2 Precipitates Formed Upon One-Step Artificial Ageing
Figure 3 shows the precipitate microstructure of the samples aged at 200° C for various times. No precipitates were observed in the sample aged for 0.5 h (an early stage of under-ageing). In the sample aged for 2 h, a number of Guinier-Preston-Bagaryatsky (GPB) zones, GPI zones (or δ ′ -GPI-δ ′ precipitate complexes with δ ′ precipitates not visible) and T1-phase precipitates were observed (Fig.3a). In the sample aged for 12 h (peak-ageing), without seeing independent θ ′ -precipitates, δ ′ -θ ′ -δ ′ precipitate composites or complexes can be observed (Fig.3b), indicating that (1) the GPI zones in δ ′ -GPI-δ ′ precipitate complexes has transformed into the θ ′ -precipitates to form the δ ′ -θ ′ -δ ′ composite phase (as shown in Fig.3d) and (2) the δ ′ -θ ′ -δ ′ composites are thermally more stable than the θ ′ -precipitates. GPB zones, σ -phase and S-phase precipitates can be seen in the peak-aged samples. The density of T1-precipitates increases with increasing ageing time (Fig.3b, e). All these precipitates contribute to the peak hardness of the alloy. Extending ageing time to 72 h (over-ageing), δ ′ -θ ′ -δ ′ composites vanish, only the precipitates of GPB zones, σ -phase, S-phase and T1-phase remain stable (Fig.3c, f). Note that a < 100 > Al direction is the best viewing direction for most of the precipitates, but not for the T1-phase precipitates that are plate-like and lie on the {111}Al planes.
3.2.3 Precipitates Formed Upon NA60 Days Plus Ageing at 180° C
Figure 4a shows HAADF-STEM image of the sample aged at 180° C for 0.5 h. It is seen that GPI zones and δ ′ -GPI-δ ′ precipitate composites appear uniformly in the matrix, which is similar to that in natural-aged samples (Fig.2), though the precipitate density is greatly reduced after artificial ageing for 0.5 h. Figure 5 further shows the difference of the precipitate size distributions in the two samples for GPI zones and δ ′ -GPI-δ ′ precipitates composites without distinguishing their structure difference. It can be seen that in the sample natural aged for 60 days, the diameters of the precipitates are in the range of 3-6 nm. In contrast, in the sample that was further aged at 180° C for 0.5 h (after natural ageing for 60 days), the diameters of precipitates are in the range of 6-12 nm. Considering the fact that the number density of the precipitates (and therefore the hardness as shown by the inset in Fig.1b) in the later sample has greatly decreased in comparison with that in the former sample, it is reasonable to speculate that the second-step ageing (at 180° C for 0.5 h) has led to the dissolution of most of the small-sized GPI zones and δ ′ -GPI-δ ′ precipitates formed during natural ageing. Nevertheless, still some of the precipitates have survived and further grown larger in diameter upon the ageing at 180° C for 0.5 h.
 | Fig.4 HAADF-STEM images of the samples treated with NA60 days plus ageing at 180° C for various times: a 0.5 h, b 28 h, c 52 h, viewed along < 100> Al |
 | Fig.5 Diameter distributions of GPI zones and δ ′ -GPI-δ ′ composite precipitates observed a in the sample natural aged for 60 days, and b in the sample first natural aged for 60 days and then artificial-aged at 180° C for 0.5 h |
In the sample aged at 180° C for 28 h, however, GPI zones and δ ′ -GPI-δ ′ composite precipitates can no longer be observed, and instead σ -precipitates, GPB zones, S-precipitates and T1-precipitates are formed in the matrix, as shown in Fig.4b. The σ -precipitates are short, rod-shaped and very coherent with the Al-matrix (Fig.6a). Their average size is about 30 nm in cross section. The GPB zones are needle-like Cu-Mg-rich precipitates, and their average size is about 2 nm in cross section (Fig.6b), which seems somewhat different from that reported in AA2024 Al-Cu-Mg alloy [28].
 | Fig.6 Aberration-corrected HAADF-STEM images of different precipitates: a σ -phase in the sample two-step-aged at 180° C for 28 h, b GPB zones in the same sample as a, c GPB zones the sample two-step-aged at 180° C for 52 h, viewed along a < 100> Al direction |
Extending ageing time further to 52 h, σ -precipitates no longer exist, but GPB zone, S-precipitates and T1-precipitates remain present in the matrix, as shown in Fig.4c. The GPB zones (and S-precipitates as well) are notably coarsened as compared with that in the sample aged for 28 h (Fig.6c).
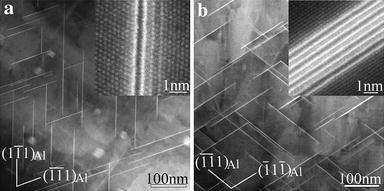
T1-precipitates lying on the {111}Al planes are the most important hardening precipitates in the alloys. One of the best viewing directions to observe T1-precipitates is along a < 110> Al direction. Figure 7 shows the < 110> Al HAADF images of the samples treated with NA60 days plus ageing at 180° C for various times. Aged at 180° C for 28 h, the average thickness of T1-precipitates formed in the sample is mostly 1 or 2 cells in their cT1 direction, as shown Fig.7a. Actually, early-stage precipitates of T1-type lying on the {111}Al planes or the precursors of T1-precipitates (referred to GP T1 zones hereafter) have already been observed in the sample aged at 180° C for 6 h. However, their structure is different from that of the T1-phase. Their relation to the T1-phase shall be discussed in the later coming section. Aged at 180° C for 52 h, the cubic σ -precipitates have vanished in the sample, which is consistent with the observation along a < 100> Al direction, but the T1-precipitates have grown obviously larger with average thickness of about 4 cells along their cT1 direction (Fig.7b). Figure 8 further shows the difference of the precipitate size distributions in the two samples for T1-precipitates. It can be seen that in the sample aged for 28 h, the diameters of precipitates are in the range of 50-150 nm (Fig.8a). In contrast, in the sample aged for 52 h, the diameters of precipitates are in the range of 100-250 nm (Fig.8b). Both the diameter and the thickness of T1-precipitates increase with increasing ageing time. Since it has been known in AA2024 alloys that the S-phase is more stable than the GPB zones, it can be expected that with further extending the ageing time the GPB zones shall vanish when they coexist with the S-precipitates.
 | Fig.7 HAADF-STEM images of samples treated with NA60 days plus ageing at 180° C for various times: a 28 h, b 52 h, viewed along a < 011> Al direction |
 | Fig.8 Diameter distributions of T1-precipitates in the samples first natural aged for 60 days and then artificial-aged at 180° C for 28 h a, 52 h b |
In summary, in the second-step 180° C ageing, the precipitation sequence of the alloy that had been natural aged for 60 days can be regarded as: GPI + δ ′ -GPI-δ ′ → GPB + σ + GP T1 + S → GPB + T1 + S → T1 + S.
Comparing this sequence with that in one-step-ageing, one interesting phenomenon is that the stability of the σ -phase relative to the S-phase appears reversed. To understand this, we performed first-principles energy calculations. The obtained results show that the formation enthalpies of S-phase, σ -phase and T1-phase are -17.8, -23.1 and -32.2 kJ/(mol atom), respectively. It is seen that the σ -phase is less stable than the T1-phase, but more stable than the S-phase, not supporting the experimental observations for the precipitation sequence of the alloy treated with two-step ageing, in which S-precipitates appear more stable than σ -precipitates. The probable reason for this shall be demonstrated in the next section.
3.2.4 Precipitates Formed Upon NA60 Days Plus Ageing at 200° C
Consistent with its better hardening response in Fig.1b, the precipitation behaviour of the alloy treated with NA60 days plus ageing at 200° C is somewhat different from that treated with NA60 days plus ageing at 180° C, as shown below in details.
Figure 9 shows a HAADF image of the NA60 days sample aged at 200° C for 0.5 h. Lots of precipitates-like contrast can be seen in the image. However, when focusing on the interesting contrast at high magnification, none of the precipitates can be found in the Al-matrix, indicating that the GPI zones and δ ′ -GPI-δ ′ composite precipitates formed during natural ageing have structurally been dissolved or unstable, but still have left segregated chemical traces (most likely Cu traces) that appear loop-like.
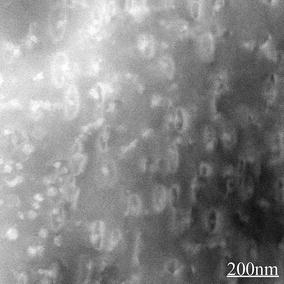 | Fig.9 A typical HAADF-STEM images of the NA60 days sample aged at 200° C for 0.5 h, viewed along a < 100> Al direction |
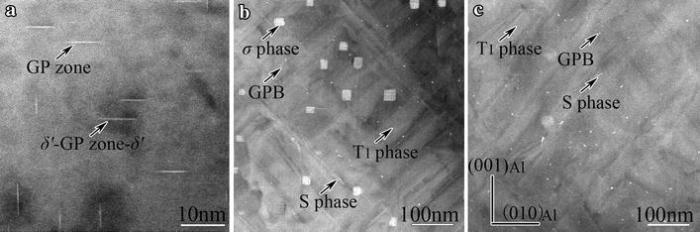
Figure 10 shows HAADF images of the precipitates in the samples aged at 200° C for different times. In the sample aged for 6 h (at the first hardness peak in Fig.1b), T1-precipitates, GPB zones, σ -precipitates and the thinnest S-precipitates, S2-precipitates [37], are observed (Fig.10a). The atomic-resolution image of a typical S2-precipitate is shown in Fig.11a. The typical thickness of the T1-precipitates formed at 6 h is only 1 unit cell along its cT1 direction, as shown by the inset in Fig.10d, which is a < 011> Al image of the same sample as for Fig.10a. The diameters of T1-precipitates in this stage are in the range of 50-200 nm (Fig.12a).
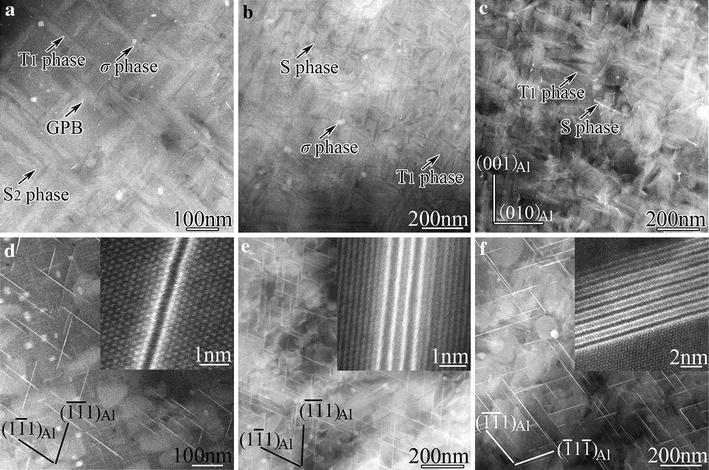 | Fig.10 HAADF-STEM images of precipitates in the samples aged at 200° C for 6, 28 and 72 h, respectively: a-c viewed along a < 100> Al direction, d-f viewed along a < 011> Al direction |
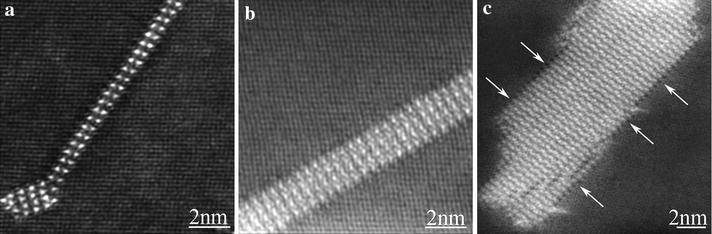 | Fig.11 < 100> Al HAADF-STEM images showing the evolution of S-precipitates in the NA60 days sample aged at 200° C: a a S2-precipitate observed at 6 h, b a S4-precipitate observed at 28 h, c a large S-precipitate observed at 72 h, in which Li atoms segregate at its interfaces with the Al-matrix |
 | Fig.12 Diameter distributions of T1-precipitates in the samples first natural aged for 60 days and then artificial-aged at 200° C for 6 h a, 28 h b, 72 h c |
In the sample aged for 28 h (at the second hardness peak in Fig.1b), T1-precipitates, σ -precipitates and S-precipitates are observed without seeing GPB zones any longer (Fig.10b). Accompanying the dissolution of GPB zones, it was observed that the remaining T1- and S-precipitates have coarsened, whereas the number of remaining σ -precipitates notably decreases without notable change in their sizes. Most of the S-precipitates in this stage have thickened from S2- to S4-precipitates [36, 37] (Fig.11b). The T1-precipitates have typically thickened from 1 cell to 3 cells along the cT1 direction, as shown by the inset in Fig.10e, and their diameters have increased to the range of 100-250 nm (Fig.12b).
Figure 10c, f shows that in the sample over-aged for 72 h, σ -precipitates have vanished, and the remaining S- and T1-precipitates have coarsened further. The T1-precipitates are mostly thicker than 6 unit cells along the cT1 direction (Fig.10f) and their diameters have increased to the range of 100-350 nm (Fig.12c).
Hence, in the second-step 200° C ageing, the precipitation sequence of the alloy (natural aged for 60 days) can be summarized as: GPI + δ ′ -GPI-δ ′ → GPB + σ + GP T1 + S → σ + T1 + S → T1 + S. Comparing this sequence with that in one-step-ageing, again the stability of the σ -phase relative to the S-phase appears reversed.
Interesting is that significant segregation of Li atoms at the interfaces between the S-precipitate and the Al-matrix has been detected by atomic-resolution HAADF imaging, as indicated by the white arrows in Fig.11c. This probably indicates that such segregation of Li atoms can reduce the high interfacial energy of S-precipitates [36] and therefore make them more stable than σ -precipitates. Actually, the Li-to-Cu atomic ratio in the present alloy is about 2.5, whereas this ratio in the T1-phase (Al2CuLi) is 1:1, leading to significant excess Li atoms far beyond the solubility of Li atoms in the Al-matrix at a temperature below 200° C. These excess Li atoms eventually need to be adopted by other remaining precipitates in certain ways. We now know that the σ -phase may have the composition of Al5Cu6Mg2 [18] or Al5Cu6Li2 [19], and the S-phase precipitates may adopt significant Li atoms at their interfacial edges. And the GPB zones can probably also adopt Li atoms, since Fig.7c shows that both the GPB zones and the S-precipitates can be more stable than the σ -precipitates in the two-step ageing process. Therefore, the excess Li atoms apart from the compositional need of δ ′ (Al3Li), σ (Al5Cu6Li2) and T1 (Al2CuLi) phases play a key role in determining the relative stabilities of all possible precipitates. Also the thermal ageing processes certainly are another key factor in determining which kind of precipitates may form or survive in competition with others. The two factors in association with the roles of Cu and Mg elements make the microstructures of Al-Cu-Li-(Mg) alloys rather complex and far from well understanding.
3.2.5 Evolution of T1-Precipitates
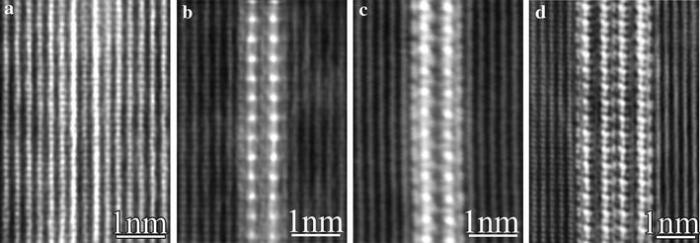
The T1-precipitates are the major hardening phase in this alloy and its formation mechanism has not been very clear previously, as shown in our recent work [38], in which we demonstrated the following: (1) the T1-precipitate has its own well-defined precursors, referred as GP T1 zones; (2) in the evolution from its initial GP T1 zone to the final T1-structure, intermediate structures might exist; (3) the growth of a plate-like T1-precipitate in its thickness (thickening) is realized through first the formation of GP T1 zone on its side and then the transformation of this GP T1 zone into the T1-structure (as shown in Figs. 7, 10), very similar to the thickening mechanism of the S-phase precipitates [38]. To find more concrete evidence about the intermediate structures in the present study, aberration-corrected HAADF-STEM imaging at a resolution better than 0.1 nm was employed to further examine the early structures of T1-precipitates along a < 112> Al direction, as shown in Fig.13. Figure 13a exhibits the initial structure of GP T1 zone, which is a sandwich-like structure but fully coherent with the Al-lattice (solutes aggregate in an ordered manner but without significant deviation from the face-centred cubic Al-lattice). The middle atomic layer between the two Cu-rich layers is still an Al-atomic lattice plane, and no ordered Li atoms segregation occurs in this structure. It is assumed that Li solutes randomly segregate around the GP T1 zone. A transitional structure of the GP T1 zone has been observed, as shown in Fig.13b, in which Li atoms are introduced into the structure and the two Cu-rich layers are also changed, apparently being more similar to a T1-precipitate. Nevertheless, this transitional structure still differs from that of well-developed T1-precipitates with whatever 1 unit cell (Fig.13c) or 2 unit cells (Fig.13d) in thickness. In the T1-structure (Fig.13c-d), Li atoms are highly ordered [38]. Our first-principles energy calculations show that the formation enthalpies of the three structures shown in Fig.13a, c are -6.8 and -32.2 kJ/(mol atom), respectively, confirming that the evolution from GP T1 zone to T1-precipitate is energetically reasonable.
 | Fig.13 Aberration-corrected < 112> Al HAADF-STEM images revealing different atomic structures of the T1-phase in different stages of its evolution: a the initial stage of GP T1 zone; b a transitional stage from GP T1 zone to T1-precipitate; c the T1-precipitate with 1 unit cell in thickness; d the T1-precipitate with 2 unit cells in thickness |
4 Conclusions
(1).A two-step ageing with natural ageing plus artificial ageing at 200° C may significantly increase the age-hardening response of the alloy.
(2)The precipitation sequence in the natural-aged alloy is: SSSS → GPI → GPI + δ ′ -GPI-δ ′ .
(3)The precipitation sequence in the alloy one-step-aged at 180-200° C is: SSSS → GPI +δ ′ -GPI-δ ′ + GPB + T1 → δ ′ -θ ′ -δ ′ + GPB + T1 + σ + S → GPB + T1 + σ + S.
(4)The precipitation sequence in the alloy two-step-aged at 180° C is: GPI + δ ′ -GPI-δ ′ → GPB + σ + GP T1 zone + S → GPB + T1 + S → T1 + S.
(5)The precipitation sequence in the alloy two-step-aged at 200° C is: GPI + δ ′ -GPI-δ ′ → GPB + σ + GP T1 zone + S → σ + T1 + S → T1 + S. It is shown that excess Li atoms segregate at the interfacial edges of S-precipitates and make them more stable than the σ -precipitates.
(6)The T1-precipitates nucleate and grow through their own GP T1 zones. A transitional structure is observed, existing during the transformation from the initial GP T1 zone to the matured T1-precipitate.
This work was financially supported by the National Natural Science Foundation of China (Nos. 51371081, 11427806, 51471067, 51501059 and 51171063) and the National Basic Research Program of China (No. 2009CB623704). The authors are grateful to Dr. Z.J. Shen, Prof. J.X. Li and Prof. Z. Zhang for great helps in using their HRTEM facility at Zhejiang University.
The authors have declared that no competing interests exist.
作者声明: 无竞争性利益关系
Reference
| [1] |
|
| [2] |
|
| [3] |
|
| [4] |
|
| [5] |
|
| [6] |
|
| [7] |
|
| [8] |
|
| [9] |
|
| [10] |
|
| [11] |
|
| [12] |
|
| [13] |
|
| [14] |
|
| [15] |
|
| [16] |
|
| [17] |
|
| [18] |
|
| [19] |
|
| [20] |
|
| [21] |
|
| [22] |
|
| [23] |
|
| [24] |
|
| [25] |
|
| [26] |
|
| [27] |
|
| [28] |
|
| [29] |
|
| [30] |
|
| [31] |
|
| [32] |
|
| [33] |
|
| [34] |
|
| [35] |
|
| [36] |
|
| [37] |
|
| [38] |
|