

Localized Corrosion of Binary Mg-Ca Alloy in 0.9 wt% Sodium Chloride Solution
[Rui-Qing Hou1 , Chen-Qing Ye2 , Cheng-Dong Chen1 , Shi-Gang Dong3 , Miao-Qiang Lv1 , Shu Zhang1 , Jin-Shan Pan1 , Guang-Ling Song5 , Chang-Jian Lin1  ]
]
]
|
|


To further understand the localized corrosion of magnesium alloy, various in situ electrochemical techniques and ex situ electron microprobe analysis and SEM were used to monitor the corrosion process of Mg-1.0Ca alloy in 0.9 wt% sodium chloride solution. The results indicated that the localized corrosion was accompanied by the formation and thickening of a corrosion product film on the Mg-1.0Ca alloy. A localized corrosion of the alloy initiated selectively on the eutectic micro-constituent zones, then enhanced with the exposure, developed in depth with ring-shaped corrosion products accumulated around and finally formed a volcanic-like pitting. Based on the measurements, an electrochemical corrosion model was proposed accordingly to describe the formation mechanism of the volcanic-like pitting on the alloy in 0.9 wt% sodium chloride solution.
Magnesium (Mg) as one of the biodegradable and biocompatible materials could be potentially used for bone screws, plates and even blood vessel stands [1, 2, 3]. However, Mg is susceptible to corrosion attack in aqueous environments, especially those containing chloride. This has largely hindered its clinical applications [4, 5]. To improve its corrosion resistance, various Mg-based alloys have been developed [6, 7, 8]. For clinical applications, calcium (Ca) has been focused as an important alloying element based upon the fact that Ca exists extensively in biologic bone as one of the essential elements [9, 10]. Many tests have demonstrated that the moderate addition of Ca is beneficial to the mechanical properties of Mg alloys including tensile strength, yield strength, ductility and hardness [9, 11, 12]. Moreover, the co-releasing of Mg and Ca ions may be beneficial to the bone healing [12, 13].
The corrosion rate of a Mg-Ca alloy can be partially adjusted by the amount of Ca in the alloy, because the addition of Ca element leads to the formation of the intermetallic phase (Mg2Ca), which can accelerate the dissolution of the alloy by enhancing the micro-galvanic corrosion between the β -Mg2Ca phase and Mg matrix [10, 14, 15]. In fact, it has been well known that the secondary phase plays a significant role in nonuniform corrosion of Mg alloy due to the inhomogeneity of the alloy surface. For example, the tiny intermetallic particles in Mg alloys normally accelerate the corrosion of the surrounding matrix phase [16, 17]. The corrosion of pure Mg usually develops from grain to grain [18]. Williams et al. [19] found that the localized corrosion of pure Mg initiated from irregular pits, then spread laterally and at last covered the whole surface, while the localized corrosion of AZ31 Mg alloy was characterized by the dendrite-like features comprising several mobile, focal anodes coupled with strong local cathodes [20]. The degradation of Mg alloys in physiological environments is actually a complicated electrochemical process [21], and the corrosion behavior of Mg alloys is largely influenced by its microstructure and the medium environments [22]. It will be of great scientific significance to have an insight into the localized corrosion of Mg-Ca alloys.
Traditional techniques for corrosion study, such as hydrogen evolution, weight loss and electrochemical measurements, usually only provide average information from the whole electrodes, lacking in spatial resolution for studying the initiation and the development of localized corrosion. To better follow the process of localized corrosion of Mg-Ca alloy, it requires various in situ and noninvasive correlative electrochemical imaging techniques. Scanning micro-reference electrode technique (SRET) is a powerful tool to probe localized corrosion of metals in aqueous solution [23, 24]. Currently, there are not many studies on localized corrosion process of Mg alloys by using SRET yet, especially for the rapid corrosion of Mg-Ca alloy in 0.9 wt% sodium chloride solution. It is expected that the SRET may provide some new findings for the localized corrosion and nonuniform dissolution of Mg-Ca in 0.9 wt% sodium chloride solution.
In this study, the corrosion behavior of Mg-1.0Ca alloy in 0.9 wt% sodium chloride solution was investigated by combining the traditional electrochemical measurements and the state-of-the-art SRET imaging together with in situ optical microscopic observation. The chemical composition and microstructure of the alloy before and after the exposure were characterized by SEM and EDX analyses. Then, the localized corrosion mechanism of the Mg-1.0Ca alloy in 0.9 wt% sodium chloride solution was discussed.
The Mg-1.0Ca (with 1 wt% Ca) alloy ingot, provided and produced by College of Engineering, Peking University [9, 25], was cast from commercial pure Mg (99.98%) and Ca (99.95%) in a crucible under a mixed gas atmosphere of SF6 and CO2 and was then extruded into a rod at 210° C at a reduction ratio of 17. The experimental Mg-1.0Ca alloy was mechanically cut into Φ 15 mm × 4 mm disk, and one side was connected to a copper wire. The disk and the disk-copper wire joint were mounted in epoxy resin, and only one circular disk surface was exposed as the working surface area. The exposed surface was successively wet ground with SiC papers from 400 to 1500 grit. For optical microscope and SRET experiments, the sample was then polished with 1.0 and 0.3 μ m Al2O3 powders and finally ultrasonically cleaned with ethanol.
A 0.9 wt% sodium chloride solution was prepared using analytical grade sodium chloride and distilled water. All the measurements not specified were carried out at room temperature [(25± 2)° C].
The chemical composition of the phase was analyzed by a JXA-8100 electron microprobe analysis (EPMA) equipped with energy dispersive X-ray (EDX).
A standard three-electrode cell, with Mg-1.0Ca alloy as working electrode, saturated calomel reference electrode (SCE) and platinum sheet as counter electrode, was used in all electrochemical measurements, which was connected to an AUTOLAB instrument, PGSTAT 30 (Eco Chemie B.V.) with a built-in frequency response analyzer (FRA) module. The EIS spectra were recorded under open-circuit potential (OCP), from initial immersion up to 6 h of exposure in 0.9 wt% sodium chloride solution, within the frequency range from 100 kHz to 0.01 Hz and under a perturbation with a peak-to-peak amplitude of 10 mV. Three repetitions were performed for the EIS measurements, and the data were analyzed by using ZSimpWin software.
In situ observation was made with an optical microscopy (SIS Gmbh, Ultra Objective Nano-station III, Germany) equipped with a CCD camera. To avoid obscuring the main observed corrosion features, surface bubbles built up were physically removed by introducing a gentle flow of electrolyte on the surface immediately prior to the acquisition of the images.
In situ SRET measurements were taken by using a home-built scanning tunneling microscope (STM)-assisted SRET system, which has been described in detail previously [26]. It was conducted at a scanning frequency of 0.4 Hz over an area of 4 mm × 4 mm on the sample surface to obtain 256 pixels × 256 pixels images. A Pt/Ir microelectrode, coated with Transparent Para (Arrow Fastener (UK) Ltd.) except its very sharp tip (ca. 500 nm), was used as the scanning probe for in situ imaging corrosion potential difference on the specimen surface. The distance between the probe tip and specimen surface was automatically controlled at 50 μ m assisted by the constant height mode of the STM system which is able to accurately control the distance through sensing the tunnel current. Another Pt/Ir wire was used as reference electrode which was held about 2 mm above the specimen surface.
The morphology and the surface chemical composition after SRET measurements were ex situ analyzed by JXA-8100 EPMA and Hitachi S-4800 scanning electron microscopy (SEM) equipped with EDX microanalysis hardware operated at an acceleration voltage of 15 kV. The size of the analyzed points for EDX is about Φ 6 μ m.
According to the phase diagram for Mg-Ca binary alloy [12, 27], only one intermetallic compound phase (Mg2Ca) can form in the fabrication process. The SEM image in Fig.1a of the polished surface reveals precipitate particles distributed like discontinuous network in the alloy matrix. It has been reported that the discontinuous precipitate is a eutectic micro-constituent of white color, which consists of grayα -Mg and lightβ -Mg2Ca, and the eutectic Mg has a gray color very similar to the primaryα -Mg phase [28]. The EDX elemental maps of eutectic micro-constituent in Fig.1b show calcium enrichment and magnesium deficiency in the eutectic zone, suggesting that Mg2Ca intermetallic particles spread along the phase boundaries. The distribution of oxygen on Mg-Ca alloys indicates the air-formed oxide film contained a mixture of MgO and CaO [29]. The richness in oxygen on eutectic micro-constituent suggests that the oxidation of eutectic micro-constituent is easier to occur than Mg matrix.
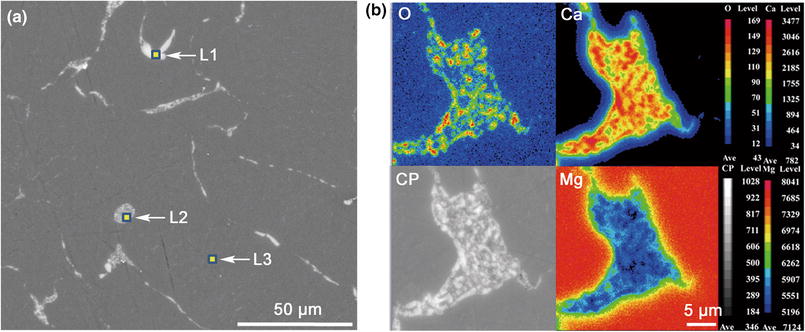 | Fig.1 SEM image on polished alloy surface a and elemental distributions of Ca, Mg and O on the eutectic micro-constituent b (L1, L2 and L3 refer to location 1, location 2 at eutectic micro-constituent and location 3 at matrix sites, respectively; CP means backscattered electron image) |
The EDX point analysis results are given in Table 1, showing large differences in the composition of these analyzed areas. The difference between L1 and L2 was attributed to the different percentage of Mg2Ca in the eutectic micro-constituent. At the precipitate sites (L1 and L2), the Ca content is much higher than that in the alloy matrix (L3, only a trace amount of Ca). The ratio between Ca/Mg at these sites is below the theoretical value of Mg2Ca, due to the existence of eutecticα -Mg and the fact that someα -Mg matrix areas surrounding these particles are included in the EDX spots. It should be mentioned that due to the spot size of the electron beam in EDX analysis, Table 1 can only give rough element levels for the local sites, not the exact compositions of the local corrosion products. Therefore, the measured low Ca/Mg ratios support the conclusion that the discontinuous eutectic precipitate consists ofα -Mg and β -Mg2Ca [30].
| Table 1 EDX results corresponding to the areas marked in Fig.1a |
The open-circuit potential (OCP) evolution with time for the Mg-1.0Ca alloy in 0.9 wt% sodium chloride solution was recorded for 6 h, as shown in Fig.2. The characteristic OCP point of surface film breakdown was not observed [19], indicating the formation of a surface film within the experimental timescale. The OCP rapidly increased during the first hour and subsequently fluctuated within a small range around -1.62 VSCE. The initial fast increase in OCP may arise from the rapid formation of corrosion products on the surface and the conversion of the air-formed oxide film into more stable hydroxide [31], providing a certain protection for the alloy. The subsequent fluctuation could be the results of localized corrosion events, indicating that the Mg alloy cannot produce a dense, effective anticorrosion film on the surface.
 | Fig.2 OCP of Mg-1.0Ca alloy measured during 6 h of exposure in 0.9 wt% sodium chloride solution |
The EIS measurements were taken to monitor the changes in corrosion behavior at the metal-solution interface during the exposure. As shown in Fig.3, typical EIS spectra show two capacitive loops and one inductive loop. The capacitive loop in high frequency usually corresponds to the electrochemical behavior of the corrosion product film on Mg alloy, and the capacitive loop in medium frequency is attributed to the charge transfer process during the metallic dissolution [32]. Numerous examples of such inductive arcs are found in corrosion studies, and various explanations for them have been suggested, mainly involving a potential-dependent adsorption of intermediate or electrically active species [33], which usually associated with the film partial breakdown and dissolution [18, 34].
 | Fig.3 Nyquist a and Bode b plots of Mg-1.0Ca alloy in 0.9 wt% sodium chloride solution for 6 h and equivalent circuit used for the spectra fitting c |
For quantitative analysis of the EIS results, an equivalent circuit in Fig.3c was used for the spectra fitting, which had been commonly used for Mg alloy [35]. The reasonability of this equivalent circuit has recently been further verified on anodized Mg alloy [36]. In this paper, Rs was solution resistance, Rf and CPEf represented the resistance and the constant phase element (CPE) of corrosion product film, and Rct and CPEdl were the charge transfer resistance and the constant phase element of electrochemical double layer, respectively. RL was the inductive impedance of adsorptive ion on local corrosion area, and L represented the inductance element related to relaxation process [37]. The constant phase element was used to replace the capacitance because of the dispersion effect caused by the roughness and heterogeneity of the sample surface [32, 38].
The quantitative results from spectra fitting are given in Table 2. The data represent the mean values for the three parallel measurements, and the standard deviation suggests the reproducibility of the EIS measurements. Rct characterizes the corrosion reactivity of the surface, and Rf represents the resistivity of the precipitated film [39]. The increased Rf can be attributed to the growth of corrosion product film on the surface. In the corrosion process, the destruction of the surface film caused by the attack of chloride ion and the partial protection of corrosion product film resulted from local increased pH occurred on the surface simultaneously. Moreover, the slight fluctuation of Rct with time also demonstrates such competition between corrosive attack of chloride ion and partial corrosion protection of the precipitated film on the Mg-1.0Ca alloy substrate. These small Rf values indicate poor protection of the corrosion product film for the alloy. The variations in RL and L are related to the corrosion on the surface caused by the permeation of aggressive ion [18]. The large Yct values are related to the increased roughness and the damage of the alloy substrate during the corrosion process [40]. The small fluctuation of Yf values associated with the thickness and compactness of the precipitated film indicates the varied morphologies on the sample surface with immersion. In general, the overall impedance of the Mg-Ca alloy in 0.9 wt% sodium chloride solution slightly increased with immersion time, which was consistent with the initial increasing impedance tendency of pure Mg in a simulated body fluid [41]. The increase in corrosion resistance indicates that the encouragement of the dissolution by the localized corrosion is relatively weaker than the retardation effect of corrosion production.
| Table 2 Fitting results from EIS spectra for Mg-1.0Ca alloy in 0.9 wt% sodium chloride solution |
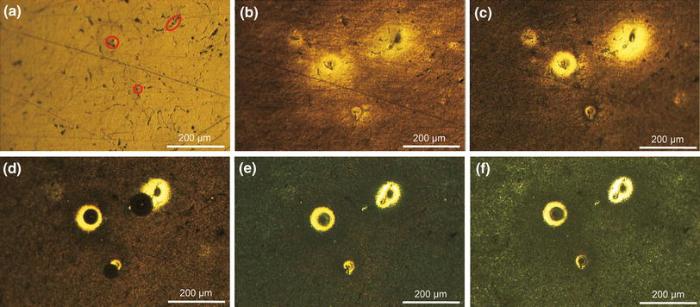
A sequence of photographic images of an Mg-Ca surface freely corroding in 0.9 wt% sodium chloride solution, taken in situ at various intervals, are shown in Fig.4. The appearance of the surface before exposed to the solution is shown in Fig.4a, the scratches and the phase boundary can be observed, but no visible grain boundary was found on the surface. The net-like structure (black area) was identified to the eutectic micro-constituent.
 | Fig.4 In situ optical images of the sample surface after 0 min a, 15 min b, 30 min c, 1 h d, 2 h e, 4 h f of exposure in 0.9 wt% sodium chloride solution |
After exposed to 0.9 wt% sodium chloride solution, the surface structure of the Mg-1.0Ca alloy changed rapidly and became darker (Fig.4b), which was accompanied by the appearance of hydrogen bubbles at the distinct sites on the surface. During the first 30 min of exposure (Fig.4c), the scratch and phase boundary on the surface turned to be vague due to the fast dissolution and the corrosion product film precipitated on the sample. Meanwhile, some bright spots formed at these distinct sites, from which hydrogen bubbles came out as small streams. Few corrosion products could be seen around such bright spots. After 1 h of immersion, the scratches and phase boundary were hard to be recognized (Fig.4d). Some of the bright spots also disappeared, indicating that the activity for hydrogen evolution became weaker due to corrosion products blocking those locations. With prolonged exposure, some annular areas remained to be bright, within which a ring-shaped structure began to form around the center of the bright spot, and the indistinct center of the bright spot was probably caused by a small hydrogen bubble rising from the region (Fig.4e, f).
Repeated optical microscopic observations showed that such ring-shaped structure was very common, with hydrogen bubbles emerging from the bright spots. Therefore, the term “ ring-shaped structure” will be used in the following discussion when referring to this type of feature.
The home-built SRET/STM system has been used previously to study pitting corrosion of carbon steel, stainless steel and aluminum alloys [24, 26, 42, 43]. The relative local potential due to the localized corrosion in micro-areas mapped by this system is associated with the activity of localized corrosion. In the potential images, each potential peak/valley represents the activity of the local anode/cathode in the ongoing corrosion process, and a more positive/negative potential indicates a stronger tendency of anodic/cathodic reaction.
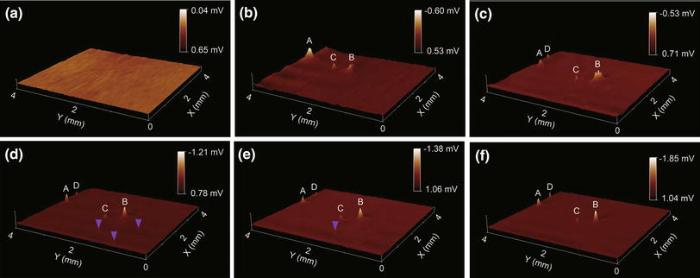
Repeated in situ SRET images at open-circuit potential (OCP) monitor the initiation and propagation of localized corrosion of the Mg-1.0Ca alloy in 0.9 wt% sodium chloride solution. In the 3D images shown in Fig.5, the sign of Z scale was reversed and the Z-range was set to accommodate the maximum potential difference in order to recognize the valleys more clearly. Thus, the potential peaks in Fig.5 were associated with the micro-cathodic activity on the sample, always galvanically coupled with anodic activity over the Mg alloy surface. Therefore, the higher the potential peak is, the stronger the intensity of localized corrosion reaction is.
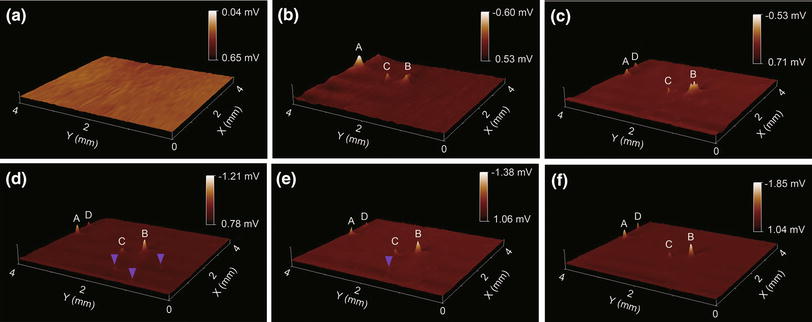 | Fig.5 Sequential 3D potential images (4 mm × 4 mm) on the surface of Mg-1.0Ca alloy in 0.9 wt% sodium chloride solution at OCP, obtained after 10 min a, 1 h b, 2 h c, 3 h d, 4 h e and 6 h f exposure |
As shown in Fig.5a, apparently no active spots can be seen on the potential image in the first 10 min exposure in 0.9 wt% sodium chloride solution. Meanwhile, at this initial exposure stage, a layer of white precipitates gradually covered over the alloy surface was observed by naked eye. After 1 h exposure, three potential peaks (peak A, B, C) clearly appeared in the potential images (Fig.5b), which indicated the enhanced localized corrosion activities at these areas due to intensified cathodic activity in the localized corrosion. These three spots remained to be active and the intensity of peak A became weaker after 2 h exposure, while the activity of peak B enhanced dramatically and a new active spots (peak D in Fig.5c) appeared. With further exposure, a couple of small potential peaks also appeared on the surface (marked with purple arrows in Fig.5d), and the potential peak at the scanned area increased correspondingly, implying increased localized corrosion activities over these sites. During prolonged exposure (Fig.5e, f), some small active spots marked with purple arrows became indistinguishable, meaning the loss or weakening of the corrosive activity at these spots, whereas at other active spots (peak A, B, C and D), the potential peak kept increasing, indicating the development of localized corrosion at these spots.
The occurrence of active spots on the alloy surface during exposure was ascribed to the onset of localized corrosion of the alloy, which involves local cathodic reaction (hydrogen evolution) and coupled anodic dissolution. The disappearance of the active spots could be due to the formation of corrosion products that weaken the local reactions. Moreover, as revealed by the sequential SRET images in Fig.5, the localized corrosion plays a role in the growth of a surface hydroxide film, where several focal cathodic active spots with a potential peak distribute over, with the remainder of the surface weakly anodic. In the early stage of immersion, an imperfect surface film consisted of magnesium hydroxide formed over the exposure region. During protracted immersion time, several active spots were seen to develop, coincident with the appearance of several bright spots over the imperfect surface film with rising streams of hydrogen bubbles. However, the focal cathode remains stable rather than traverse over the scanned area, indicating that the area affected by cathodic activity is kept considerably constant, further signifying that the percentage of the exposed surface which remains cathodic activity has little influence on the development of active spots.
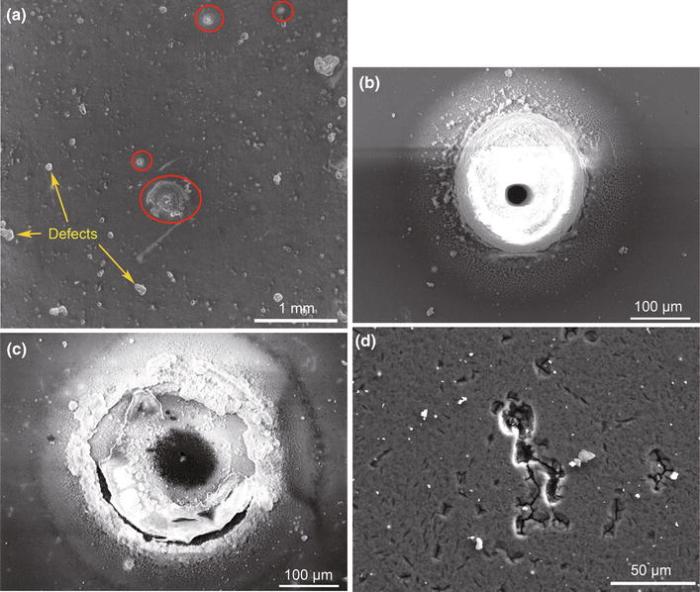
Figure 6 shows SEM micrographs of the sample surface after the SRET measurements. As shown in Fig.6a, some traces resulted from active spots exist on the surface (marked with red ellipse), corresponding to the active spots in Fig.5f. Meanwhile, there are also some small traces and corrosion defects remained on the sample surface, indicating a severe corrosion of the alloy in 0.9 wt% sodium chloride solution. The high-magnification image of an active spot before the removal of corrosion products by ultrasound in Fig.6b shows a ring-shaped structure formed around a hole and a circle regions of smooth surface outside of the ring-shaped structure, which is consistent with the in situ observation of optical microscopy.
 | Fig.6 SEM micrographs of the sample surface after the SRET measurement a, high-magnification images of the area with an active spot before b and after c the removal of corrosion products by ultrasound and SEM image of a corroded defect on the Mg-1.0Ca alloy surface d |
An obvious pit can be seen in the center of the ring-shaped structure, as shown in Fig.6c, after the sample was treated with ultrasonic to remove the corrosion products as much as possible, demonstrating that a localized corrosion occurs in the center of the active spot. The formation of the pitting indicates that the center of the ring structure as a local anode rapidly dissolved during the exposure, which was in accordance with the rapid dissolution of the center of the spots observed from the optical microscopy. Besides these pits, there are also many corroded defects (Fig.6d) with micro-cracks remained on the sample surface, which may result from the corrosion of the matrix.
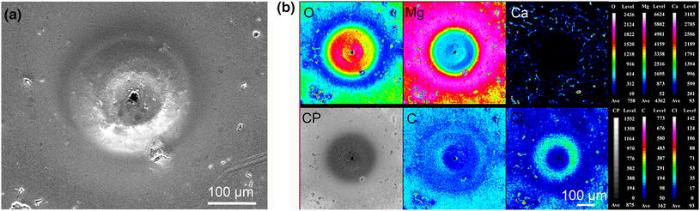
In order to further analyze the active spots, elemental distributions of the area on the pitting site were also imaged by EPMA. As shown in Fig.7, the ring-shaped feature with volcanic-like morphology was rich in oxygen and chloride (mainly in the ring), which suggested that the ring-shaped corrosion product cap covered the corrosion pit. This pit was too deep to probe the elemental composition in the center of the cap. The low content of oxygen and high content of magnesium at the smooth surface suggest that little corrosion product was formed on the circular region with a smooth surface. Furthermore, calcium distributed on the smooth surface in a network form, indicating that the smooth surface was almost like bare alloy matrix. This supports the explanation that such zone is cathodically protected by the localized corrosion through the micro-galvanic effect. The richness of Cl in the defects on the smooth areas indicates the formation of defects has an inextricable connection with the permeation of Cl-. The good correlation between C-rich defects and O-rich ones in these defects suggests the formation of MgCO3 on the sites of defects, which is most probably realized via the dissolution of CO2. The presence of MgCO3 also has been commonly found in the previous literature [44].
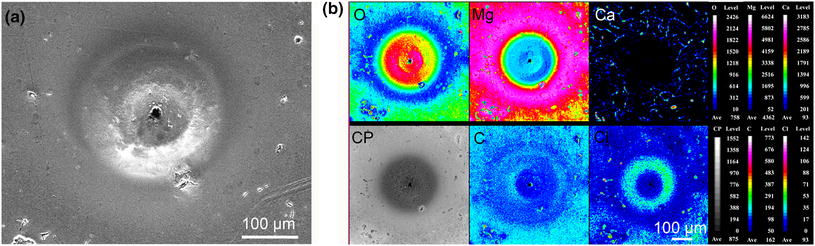 | Fig.7 SEM image a and elemental distribution b of a large active spot on the Mg-1.0Ca alloy surface after the SRET measurement (CP means backscattered electron image) |
Due to the structural heterogeneities, the corrosion of Mg alloys is largely influenced by micro-galvanic reactions between the matrix Mg and other phase, which depends on the microstructure and the ratio ofβ -phase toα -matrix as well [17, 33, 45]. The localized corrosion of the Mg alloy observed here, primarily promoted by the breakdown of surface film at these sites, is essentially determined by the micro-galvanic effect, which is different from the traditional pitting corrosion of steels in chloride ion-containing solution [46].
Generally when intermetallics are present in Mg, they are assumed as cathodes [47]. However, there is a controversial interpretation for the role of β -Mg2Ca in the localized corrosion of Mg-Ca alloy. It had been reported that the potential of β -Mg2Ca particles was relatively more positive than that of α -Mg, which caused galvanic corrosion between β -Mg2Ca (cathode) and α -Mg (anode) [14, 48, 49]. However, several investigations recently indicated that Mg2Ca phase was highly reactive as an efficient local anode owing to the more negative potential of Mg2Ca phase (OCP of Mg2Ca is -1.75 VSCE; OCP of primary Mg phase is -1.65 VSCE in 0.1 mol/L sodium chloride solution) and the chemical and crystal structure of Mg2Ca [47, 50].
To verify the role of Mg2Ca in the localized corrosion, an etching process was conducted by using diluted hydrochloric acid for several seconds. The morphologies and compositions of eutectic micro-constituent before and after etching are shown in Fig.8. It is apparent that a selective dissolution happens on eutectic micro-constituent, and the light particles (Mg2Ca) preferentially dissolve after etching. The results of EDX linear analysis show a relatively high content of Ca before etching but almost depletion of Ca after etching in the eutectic zone, suggesting that the Mg2Ca particles are preferentially dissolved as the local anode during the localized corrosion. Although the etching solution used is much more aggressive than the 0.9 wt% NaCl solution, there is a same mechanism of the localized dissolution for Mg-Ca alloy. This fact is also supported by the work of Jung et al. [28, 51], in which it was reported that the fast corrosion of the Mg2Ca phase in Mg-Ca alloy is induced by the atomically exchange of O and Ca and then the corroded Mg2Ca phase is transformed to Mg oxides. Previous studies [15, 52] showed that the fast corrosion of Mg2Ca phase leads to the rapid increase in Ca2+ concentration in the solution, which accelerates the formation of the Ca-P protective film on sample surface. Although how the Mg2Ca reacts still is an open question due to its fast dissolution rate, based upon these prior works, Ca2+ can be affirmed to one of the products from the dissolution of Mg2Ca.
 | Fig.8 SEM images and EDX linear analysis before a and after b etching experiment on the eutectic micro-constituent |
The galvanic corrosion between Mg2Ca and Mg matrix around the eutectic micro-constituent inevitably occurs on the surface when the sample is immersed in an aqueous solution. The Mg matrix around Mg2Ca particles acted as local cathodes is protected by galvanic effect [53], and the evolution of H2 on these zone prevents the coverage of corrosion products. This is the reason for the light spots observed in optical microscopy. Therefore, we define the uncovered matrix areas surrounding the Mg2Ca particles as the local cathode in the localized corrosion.
The corrosion intensity of the galvanic corrosion between Mg2Ca and Mg matrix is not only retarded by the surface film, but also determined by the distribution structure of Mg2Ca phase. As described in the literature [30], continuous distribution of Mg2Ca phase promotes deep pitting in matrix and undercutting of matrix phase, while the propagation of galvanic corrosion can be interrupted by the discontinuous Mg2Ca phase. This could explain our results from SRET that the intensity of several active spots enhanced, while some active spots lose their corrosive activities.
There appears to be a discrepancy between the results from SRET and that from the morphology. Both the potential peaks in Fig.5 and the H2 evolution observed in Fig.4 nominally suggest the cathodic reaction in these areas. This inconsistency arises as a consequence of the limitation of SRET resolution (the size of eutectic micro-constituent is always less than 10 μ m from SEM images, while the scanning data interval length of SRET calculated is about 15 μ m). Furthermore, as seen from Fig.6c, the almost naked area around the pits defined as the local cathode is much larger than the anodic area (Mg2Ca particle), indicating that the large cathode to small anode may be another factor for this inconsistency. Additionally, the galvanic corrosion transfers into the interior of the alloy with the dissolution of Mg2Ca phase [30], which leads to be more difficult to detect it. The corrosion pit under the coverage of corrosion products as shown in Fig.6c also verifies the speculation on the galvanic corrosion.
Based on the aforementioned discussion, a conceptual model of localized corrosion was proposed to describe the formation process of the volcanic-like pitting on the Mg-Ca alloy in the chloride ion-containing aqueous solution, as shown in Fig.9. When a fresh Mg-1.0Ca alloy surface is exposed to the 0.9 wt% sodium chloride solution, the insoluble corrosion products (mainly magnesium hydroxide) precipitate on the surface of the specimen as a barrier layer, resulting in a slight increases in corrosion resistance of the alloy [41, 54]. Reversely, the increase in corrosion resistance indicates that the encouragement of the dissolution by the localized corrosion is relatively weaker than the retardation effect of corrosion production. Simultaneously, the micro-galvanic corrosion between β -Mg2Ca and α -Mg around eutectic micro-constituent occurs on the surface due to the potential difference between β -Mg2Ca and α -Mg [47] (Fig.9a). Therefore, the localized corrosion always initiated at the eutectic structure develops speedily, which resulted in the loss of β -Mg2Ca particles from the eutectic zone, leaving a hole at the eutectic sites, while the matrix regions around the pit acted as local cathode are protected by the pitting (galvanic) corrosion (Fig.9b). The closer to Mg2Ca particles the matrix is, the more H2 overflow from such zone due to galvanic effect. The local region in the center of pitting was not probed due to the limitation of SRET resolution and the effect of small anode to large cathode. During the exposure, some small pits disappeared or weakened, which was caused by the blocking of corrosion products or determined by their discontinuous microstructure [30]. However, the emission of hydrogen from these sites can result in micro-cracks (Fig.9c). With the deepening of corroding pits, the galvanic corrosion transfers into the interior of alloy [28] and the corrosion product deposits accumulate gradually around the pits, which eventually leads to the formation of the volcanic-like structure as the opened cap covering the pit. The permeation of chloride ion into some defects on matrix substrate also results in corroded defects on matrix phase during exposure [55, 56]. Consequently, the volcanic-like corrosion pits, micro-cracks and corroded defects coexisted on the surface of Mg-1.0Ca alloy (Fig.9d).
 | Fig.9 Schematic diagrams of corrosion process for the Mg-1.0Ca alloy in 0.9 wt% sodium chloride solution |
The localized corrosion of several Mg alloys has been reported in previous literatures [20, 56, 57, 58, 59], but these are all different with our result. Williams et al. [19] found that the cathodically active spots coincided with points on the intact Mg surface where H2 bubbles were slowly evolved in 5 wt% NaCl solution. However, the cathodically active spots have not been unequivocally stated due to the decreased activity of the focal cathodic regions and subsequent breakdown of the surface film [19, 60]. Additionally, these measurements are performed in 5 wt% NaCl solution which is more aggressive than human body condition. A higher concentration of Cl- is easier to lead to the breakdown of the surface film [54, 60]. Although the 0.9 wt% NaCl solution is also more corrosive than human body condition [61], the breakdown of the surface film is not observed for the Mg-Ca alloys in our study, indicating that the discernible breakdown of the surface film normally may not happen in human body condition. However, the pitting of magnesium would be observed for Cl- concentrations exceeding 30 mmol/L [2]. Therefore, the work described herein revealed a localized corrosion of Mg-Ca alloy under the coverage of corrosion products. More detailed research on the rapid dissolution of Mg2Ca also needs to be done in the further works.
Based on the above measurements and discussion, the following conclusions can be drawn. In situ SRET is able to provide detailed information in the ongoing pitting corrosion of Mg-Ca alloy in aqueous solution. It is found that the eutectic micro-constituent composed of α -Mg and β -Mg2Ca is primarily active point to localized corrosion initiation. In general, the overall corrosion of the alloy declines due to the protection of surface film, while the localized corrosion of the alloy offers intensified tendency within 6 h. With the development of localized corrosion, a ring-shaped corrosion product accumulates gradually on Mg-1.0Ca alloy, leaving a hole at the center and finally forming a volcanic-like corrosion pit. The SRET results show that the localized corrosion of Mg-Ca alloy in 0.9 wt% sodium chloride solution, hided underneath the corrosion products cap, mainly develops in depth at same sites rather than spreads over the surface. An electrochemical corrosion model is proposed to illustrate the formation mechanism of volcanic-like corrosion pits in 0.9 wt% sodium chloride solution.
This work was financially supported by the National Natural Science Foundation of China (No. 21321062), International Scientific and Technological Cooperation Program of China (No. 2014DFG52350) and the National Technology Support Program of China (No. 2012BAI07B09).
The authors have declared that no competing interests exist.
作者声明: 无竞争性利益关系
| [1] |
|
| [2] |
|
| [3] |
|
| [4] |
|
| [5] |
|
| [6] |
|
| [7] |
|
| [8] |
|
| [9] |
|
| [10] |
|
| [11] |
|
| [12] |
|
| [13] |
|
| [14] |
|
| [15] |
|
| [16] |
|
| [17] |
|
| [18] |
|
| [19] |
|
| [20] |
|
| [21] |
|
| [22] |
|
| [23] |
|
| [24] |
|
| [25] |
|
| [26] |
|
| [27] |
|
| [28] |
|
| [29] |
|
| [30] |
|
| [31] |
|
| [32] |
|
| [33] |
|
| [34] |
|
| [35] |
|
| [36] |
|
| [37] |
|
| [38] |
|
| [39] |
|
| [40] |
|
| [41] |
|
| [42] |
|
| [43] |
|
| [44] |
|
| [45] |
|
| [46] |
|
| [47] |
|
| [48] |
|
| [49] |
|
| [50] |
|
| [51] |
|
| [52] |
|
| [53] |
|
| [54] |
|
| [55] |
|
| [56] |
|
| [57] |
|
| [58] |
|
| [59] |
|
| [60] |
|
| [61] |
|